NSE: DIVISLAB | Pharmaceuticals | Large Cap | Updated: June 17, 2025
📊 Technical Structure
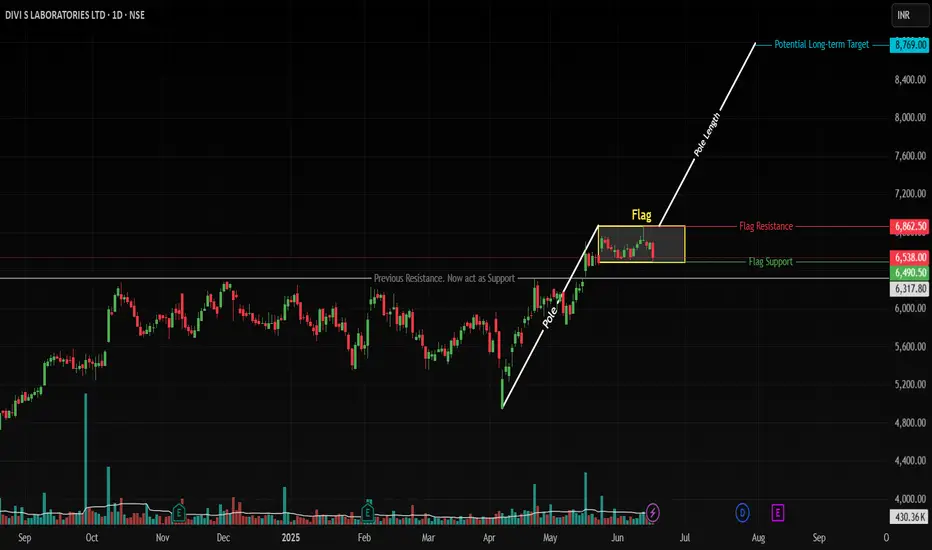
Pole Formation: Rally from 4,955 → 6,862 (1,907 points) on high volume
Flag Consolidation: Tight range between 6,490 (support) and 6,800 (resistance)
Key Breakout Trigger: Daily close above 6,862 (ATH)
Pattern Target: 8,769 (6,862 + 1,907 pole length)
Critical Support: 6,300 (confirmed swing low)
🎯 Price Targets & Roadmap
Immediate Target: 7,200 (2024 swing high)
Strong Resistance Zone: 7,600-7,750 (analysts ceiling)
Pattern Target: 8,769 (100% pole extension)
Confirmation Required for 8,769:
• Breakout volume >650K (20% above 20D avg)
• Pharma sector PE >42 (currently 39.2)
⚡ Trade Strategy
Scenario 1: ATH Breakout (Preferred)
Entry: Daily close above 6,862 (6,880-6,900 zone)
Targets:
• 7,200 (book 30% profits)
• 7,600 (book 50% profits)
• 8,769 (full exit)
Stop Loss: 6,700
Scenario 2: Flag Breakdown
Entry: 6,300-6,160 (50-DMA confluence)
Target: 6,800 flag retest → 7,200
Stop Loss: 6,050
Risk Management Essentials: Max 2% capital per trade
⚖️ Fundamental Drivers
Strengths:
• 15.4% ROE (vs sector 12.1%)
• 17% EPS growth (FY26E)
• FII holdings ↑2.1% YoY to 18.01%
Risks:
• High PE 79.2 (sector 39.2)
• Overbought risk above 7,600
⚠️ Critical Risks
Valuation Risk: Profit-booking likely near 7,600
Sector Risk: Pharma index seasonality (+4.91% avg June)
📉 Real-Time Levels
Current Price: ₹6,538 (-2.24% today)
Support: 6,490 (flag base) → 6,300 (swing flip)
Resistance: 6,800 (flag top) → 6,862 (ATH)
Volume Alert: Breakout requires >650K shares
✅ Conclusion
DIVISLAB offers a high-reward setup with defined risk parameters. The flag breakout above 6862 is the preferred play, backed by sector leadership and earnings growth. Always hedge with stops—overvaluation remains a concern.
📜 Disclaimer
This analysis represents my personal market view and not investment advice. Trading carries significant risk of capital loss. Past performance doesn't guarantee future results. Always:
Conduct your own due diligence
Consider your risk tolerance
Consult a SEBI-certified advisor
Verify real-time data before acting
Never risk more than you can afford to lose.
📊 Technical Structure
Pole Formation: Rally from 4,955 → 6,862 (1,907 points) on high volume
Flag Consolidation: Tight range between 6,490 (support) and 6,800 (resistance)
Key Breakout Trigger: Daily close above 6,862 (ATH)
Pattern Target: 8,769 (6,862 + 1,907 pole length)
Critical Support: 6,300 (confirmed swing low)
🎯 Price Targets & Roadmap
Immediate Target: 7,200 (2024 swing high)
Strong Resistance Zone: 7,600-7,750 (analysts ceiling)
Pattern Target: 8,769 (100% pole extension)
Confirmation Required for 8,769:
• Breakout volume >650K (20% above 20D avg)
• Pharma sector PE >42 (currently 39.2)
⚡ Trade Strategy
Scenario 1: ATH Breakout (Preferred)
Entry: Daily close above 6,862 (6,880-6,900 zone)
Targets:
• 7,200 (book 30% profits)
• 7,600 (book 50% profits)
• 8,769 (full exit)
Stop Loss: 6,700
Scenario 2: Flag Breakdown
Entry: 6,300-6,160 (50-DMA confluence)
Target: 6,800 flag retest → 7,200
Stop Loss: 6,050
Risk Management Essentials: Max 2% capital per trade
⚖️ Fundamental Drivers
Strengths:
• 15.4% ROE (vs sector 12.1%)
• 17% EPS growth (FY26E)
• FII holdings ↑2.1% YoY to 18.01%
Risks:
• High PE 79.2 (sector 39.2)
• Overbought risk above 7,600
⚠️ Critical Risks
Valuation Risk: Profit-booking likely near 7,600
Sector Risk: Pharma index seasonality (+4.91% avg June)
📉 Real-Time Levels
Current Price: ₹6,538 (-2.24% today)
Support: 6,490 (flag base) → 6,300 (swing flip)
Resistance: 6,800 (flag top) → 6,862 (ATH)
Volume Alert: Breakout requires >650K shares
✅ Conclusion
DIVISLAB offers a high-reward setup with defined risk parameters. The flag breakout above 6862 is the preferred play, backed by sector leadership and earnings growth. Always hedge with stops—overvaluation remains a concern.
📜 Disclaimer
This analysis represents my personal market view and not investment advice. Trading carries significant risk of capital loss. Past performance doesn't guarantee future results. Always:
Conduct your own due diligence
Consider your risk tolerance
Consult a SEBI-certified advisor
Verify real-time data before acting
Never risk more than you can afford to lose.
Uwaga
On the verge of the Break-Out ! Keep an eye !Wyłączenie odpowiedzialności
Informacje i publikacje przygotowane przez TradingView lub jego użytkowników, prezentowane na tej stronie, nie stanowią rekomendacji ani porad handlowych, inwestycyjnych i finansowych i nie powinny być w ten sposób traktowane ani wykorzystywane. Więcej informacji na ten temat znajdziesz w naszym Regulaminie.
Wyłączenie odpowiedzialności
Informacje i publikacje przygotowane przez TradingView lub jego użytkowników, prezentowane na tej stronie, nie stanowią rekomendacji ani porad handlowych, inwestycyjnych i finansowych i nie powinny być w ten sposób traktowane ani wykorzystywane. Więcej informacji na ten temat znajdziesz w naszym Regulaminie.