After reviewing DigiByte on both the monthly and weekly timeframes - overlaid with Bitcoin’s macro cycle - the structure forming right now is one of the cleanest asymmetric setups I’ve seen in years. This idea outlines why DGB may be positioned for a 100–200× revaluation relative to USD - targeting a $8B–$20B market cap if the pattern resolves the way prior cycles have.
1. BTC Leads, DGB Lags — Same Setup as 2017 and 2021
Overlaying BTC on DGB reveals a consistent historical cycle:
1. BTC expands first
2. Altcoins lag during BTC’s vertical phase
3. Once BTC cools or consolidates, liquidity rotates outward
4. High-beta alts like DGB accelerate aggressively
This BTC → DGB lag effect preceded both the:
• 2017 ~150× DGB move
• 2021 ~80× DGB move
We are in the same structural position again.
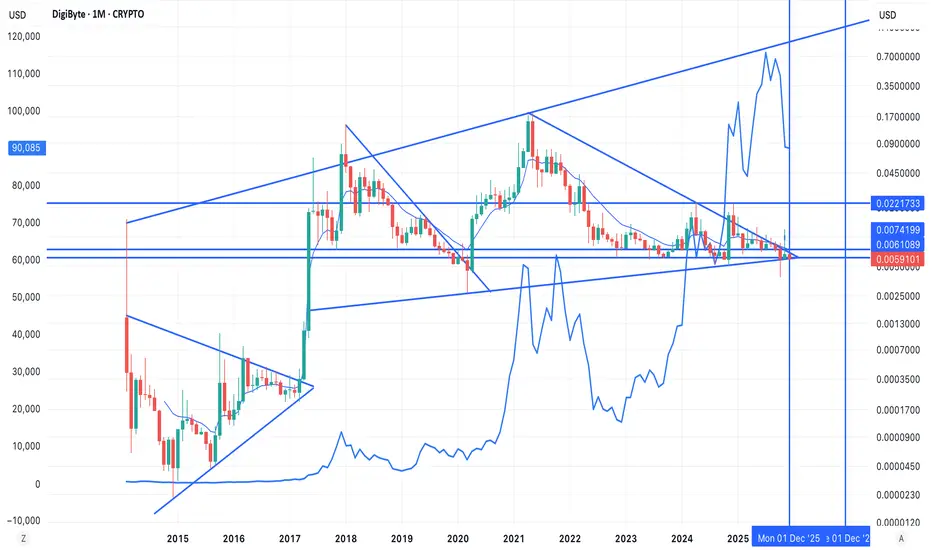
2. DGB Is Completing a Multi-Year Falling Wedge (2018–2025)
On the monthly chart, DigiByte is finishing a massive 5-year compression pattern:
• Price has respected the same horizontal accumulation floor since 2017
• Volatility has collapsed to cycle lows
• Each downside wick has been aggressively bought
• The wedge apex aligns with Q4 2025—the window altcoins historically begin major expansions
This is the exact signature of a high-timeframe breakout setup.
3. Long-Term Support Is Fully Intact
The 0.004–0.007 USD support zone has held for:
• 2017
• 2019
• 2020
• 2022
• 2023–2025
This level has acted as the macro accumulation floor for almost a decade.
The recent false breakdown and rebound back inside the wedge is a textbook spring.
4. High-Timeframe Charts Give a 100–200× Expansion Target
If DGB simply repeats prior altseason performance:
• 100× move = ~$8B market cap
• 200× move = ~$15–20B market cap
These values align cleanly with:
• Upper macro trend channels
• Fib extension confluence zones
• Historical BTC-relative performance
Given current compression, this move does not require unrealistic liquidity—just a standard altseason rotation.
5. Timing Aligns with BTC Dominance and Liquidity Cycles
The BTC overlay shows:
• BTC dominance is peaking
• BTC volatility is high but stalling
• Historically, this is when altcoins begin their acceleration phase
DGB’s wedge resolution lines up precisely with the expected rotation window.
Final View (Macro)
DigiByte is showing:
• Multi-year wedge completion
• Decade-long accumulation support
• BTC-leading / DGB-lagging cycle setup
• Extremely low volatility
• Compression ready for expansion
This is one of the most asymmetric risk-to-reward structures on the chart right now.
A confirmed breakout above the wedge resistance opens the door to the 100–200× range, consistent with DGB’s historical behavior during altseason expansions.
1. BTC Leads, DGB Lags — Same Setup as 2017 and 2021
Overlaying BTC on DGB reveals a consistent historical cycle:
1. BTC expands first
2. Altcoins lag during BTC’s vertical phase
3. Once BTC cools or consolidates, liquidity rotates outward
4. High-beta alts like DGB accelerate aggressively
This BTC → DGB lag effect preceded both the:
• 2017 ~150× DGB move
• 2021 ~80× DGB move
We are in the same structural position again.
2. DGB Is Completing a Multi-Year Falling Wedge (2018–2025)
On the monthly chart, DigiByte is finishing a massive 5-year compression pattern:
• Price has respected the same horizontal accumulation floor since 2017
• Volatility has collapsed to cycle lows
• Each downside wick has been aggressively bought
• The wedge apex aligns with Q4 2025—the window altcoins historically begin major expansions
This is the exact signature of a high-timeframe breakout setup.
3. Long-Term Support Is Fully Intact
The 0.004–0.007 USD support zone has held for:
• 2017
• 2019
• 2020
• 2022
• 2023–2025
This level has acted as the macro accumulation floor for almost a decade.
The recent false breakdown and rebound back inside the wedge is a textbook spring.
4. High-Timeframe Charts Give a 100–200× Expansion Target
If DGB simply repeats prior altseason performance:
• 100× move = ~$8B market cap
• 200× move = ~$15–20B market cap
These values align cleanly with:
• Upper macro trend channels
• Fib extension confluence zones
• Historical BTC-relative performance
Given current compression, this move does not require unrealistic liquidity—just a standard altseason rotation.
5. Timing Aligns with BTC Dominance and Liquidity Cycles
The BTC overlay shows:
• BTC dominance is peaking
• BTC volatility is high but stalling
• Historically, this is when altcoins begin their acceleration phase
DGB’s wedge resolution lines up precisely with the expected rotation window.
Final View (Macro)
DigiByte is showing:
• Multi-year wedge completion
• Decade-long accumulation support
• BTC-leading / DGB-lagging cycle setup
• Extremely low volatility
• Compression ready for expansion
This is one of the most asymmetric risk-to-reward structures on the chart right now.
A confirmed breakout above the wedge resistance opens the door to the 100–200× range, consistent with DGB’s historical behavior during altseason expansions.
Wyłączenie odpowiedzialności
Informacje i publikacje nie stanowią i nie powinny być traktowane jako porady finansowe, inwestycyjne, tradingowe ani jakiekolwiek inne rekomendacje dostarczane lub zatwierdzone przez TradingView. Więcej informacji znajduje się w Warunkach użytkowania.
Wyłączenie odpowiedzialności
Informacje i publikacje nie stanowią i nie powinny być traktowane jako porady finansowe, inwestycyjne, tradingowe ani jakiekolwiek inne rekomendacje dostarczane lub zatwierdzone przez TradingView. Więcej informacji znajduje się w Warunkach użytkowania.