1. Market Condition
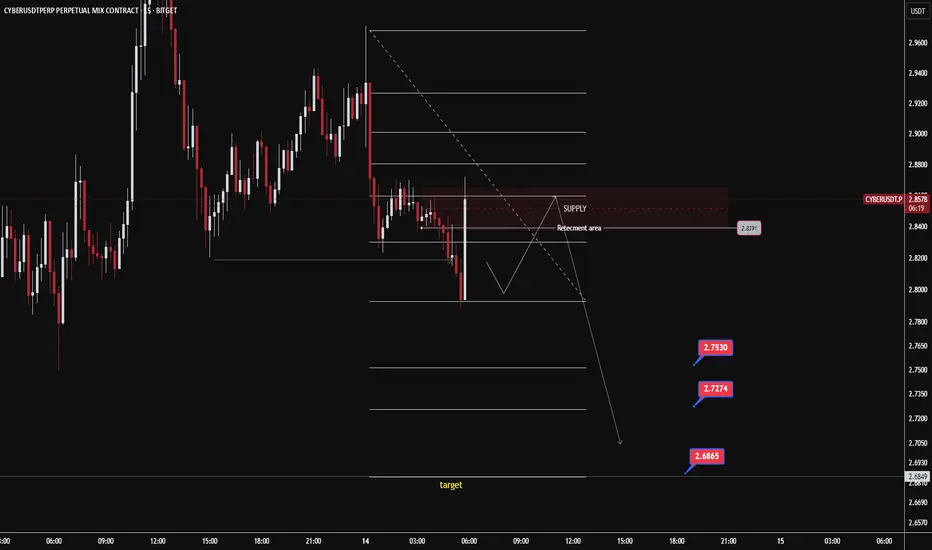
The market is currently in a downtrend on the 15-minute timeframe. Price has just broken below a minor support level and is moving toward a temporary demand area before a potential retest of the supply zone (around 2.8391). The structure is still forming lower highs and lower lows, indicating seller dominance.
2. Decision-Making Approach
Primary Scenario: Wait for price to retrace toward the supply/retracement zone (around 2.83–2.84) to look for sell opportunities in line with the prevailing trend.
Confirmation: Look for rejection or reversal candlestick patterns in the supply zone before entering.
Targets: As marked on the chart, potential take-profit levels are around 2.7530, 2.7274, and 2.6865.
Stop Loss: Place just above the supply zone to manage risk effectively.
3. Chart Explanation
Fibonacci Retracement & Extension: Used to measure potential pullback levels and the next downside targets.
Supply Zone: The red area above indicates a potential seller re-entry zone.
Arrows & Price Path: Illustrates the expected movement — pullback to supply followed by a drop toward the targets.
Price Labels: 2.7530, 2.7274, and 2.6865 are projected downside targets based on technical analysis.
Wyłączenie odpowiedzialności
Informacje i publikacje przygotowane przez TradingView lub jego użytkowników, prezentowane na tej stronie, nie stanowią rekomendacji ani porad handlowych, inwestycyjnych i finansowych i nie powinny być w ten sposób traktowane ani wykorzystywane. Więcej informacji na ten temat znajdziesz w naszym Regulaminie.