CTCUSDT 1D Chart Analysis | Ascending Momentum Targets Major Breakout
🔍 Let’s break down CTC/USDT spot price action and map out the upward scenario as bullish momentum gains traction, with a focus on trendline support, volume dynamics, and key resistance levels.
⏳ 1-Day Overview
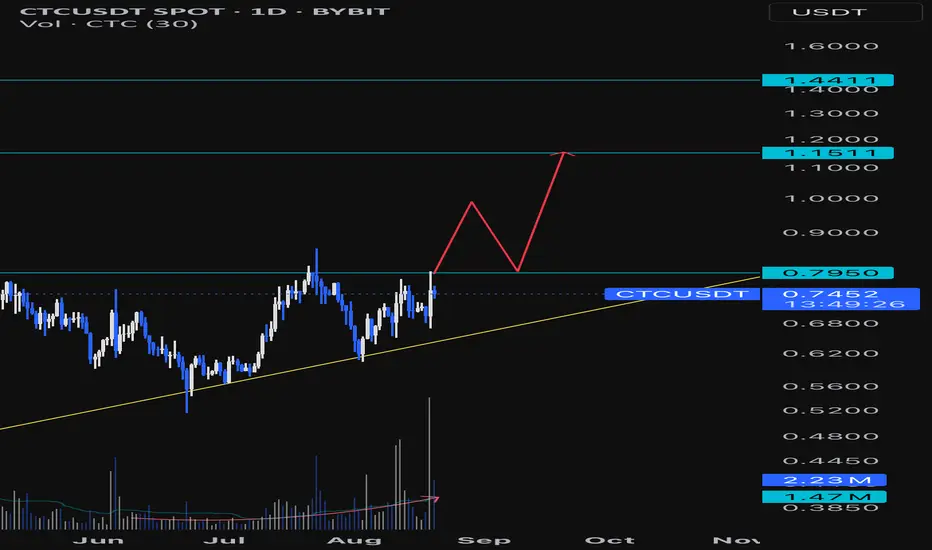
CTC/USDT on the daily chart is carving out an ascending triangle formation, supported by a firm rising yellow trendline. Price is pressing against key horizontal resistance at $0.7950 as trading volume builds, hinting at buying interest ahead of a breakout move.
📈 Volume & Structure Insights
- Steady volume expansion as price approaches the apex, confirming accumulation and bullish intent.
- Strong base forming above the yellow ascending trendline, which has consistently held since April.
- Immediate upside resistance stands at $0.7950; higher levels to target are $1.1511 and $1.4411 on a convincing breakout.
📊 Key Highlights:
- Technical structure: Clear ascending triangle signals bullish continuation if resistance cracks.
- Volume spike: Increasing volume supports the validity of the upward move.
- Breakout scenario: If price closes above $0.7950, expect momentum to carry toward $1.1511 (next resistance), followed by $1.4411.
- Price projection: Short-term retests are likely (see mapped path), but trend bias favors upside as long as the rising support holds.
🚨 Conclusion:
CTC/USDT is poised for a breakout, with momentum and volume aligning for an upward move. Watch for a daily close above $0.7950 as the trigger—targets are $1.1511 and $1.4411. Volume acceleration and bullish structure reinforce the setup. Stay alert for invalidation if the ascending trendline fails to hold.
🔍 Let’s break down CTC/USDT spot price action and map out the upward scenario as bullish momentum gains traction, with a focus on trendline support, volume dynamics, and key resistance levels.
⏳ 1-Day Overview
CTC/USDT on the daily chart is carving out an ascending triangle formation, supported by a firm rising yellow trendline. Price is pressing against key horizontal resistance at $0.7950 as trading volume builds, hinting at buying interest ahead of a breakout move.
📈 Volume & Structure Insights
- Steady volume expansion as price approaches the apex, confirming accumulation and bullish intent.
- Strong base forming above the yellow ascending trendline, which has consistently held since April.
- Immediate upside resistance stands at $0.7950; higher levels to target are $1.1511 and $1.4411 on a convincing breakout.
📊 Key Highlights:
- Technical structure: Clear ascending triangle signals bullish continuation if resistance cracks.
- Volume spike: Increasing volume supports the validity of the upward move.
- Breakout scenario: If price closes above $0.7950, expect momentum to carry toward $1.1511 (next resistance), followed by $1.4411.
- Price projection: Short-term retests are likely (see mapped path), but trend bias favors upside as long as the rising support holds.
🚨 Conclusion:
CTC/USDT is poised for a breakout, with momentum and volume aligning for an upward move. Watch for a daily close above $0.7950 as the trigger—targets are $1.1511 and $1.4411. Volume acceleration and bullish structure reinforce the setup. Stay alert for invalidation if the ascending trendline fails to hold.
Wyłączenie odpowiedzialności
Informacje i publikacje przygotowane przez TradingView lub jego użytkowników, prezentowane na tej stronie, nie stanowią rekomendacji ani porad handlowych, inwestycyjnych i finansowych i nie powinny być w ten sposób traktowane ani wykorzystywane. Więcej informacji na ten temat znajdziesz w naszym Regulaminie.