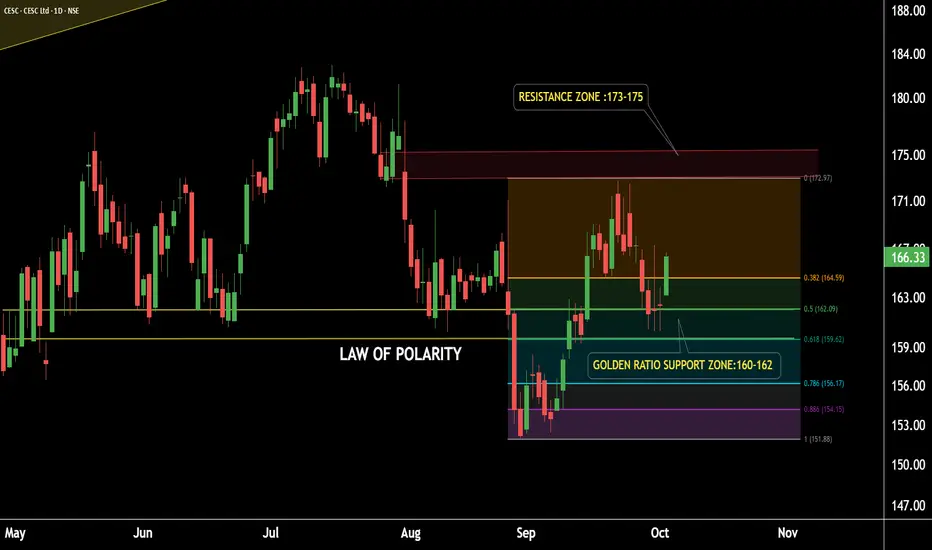
CESC Daily Timeframe Analysis
CESC is sustaining above its Law of Polarity (LOP) after a breakout.
The stock has successfully retested the LOP and is showing strength.
This level also aligns with the Golden Ratio Zone of Fibonacci Retracement, representing a strong support zone around 159–162.
Potential Upside Target: 172–175.
If the support zone sustains, we may see higher prices in CESC.
Thank you!
@RahulSaraoge
Connect us at t.me/stridesadvisory
Connect us at t.me/stridesadvisory
Wyłączenie odpowiedzialności
Informacje i publikacje nie stanowią i nie powinny być traktowane jako porady finansowe, inwestycyjne, tradingowe ani jakiekolwiek inne rekomendacje dostarczane lub zatwierdzone przez TradingView. Więcej informacji znajduje się w Warunkach użytkowania.