Executive Summary
Downtrend in Progress, Monitoring for a Potential Major Reversal
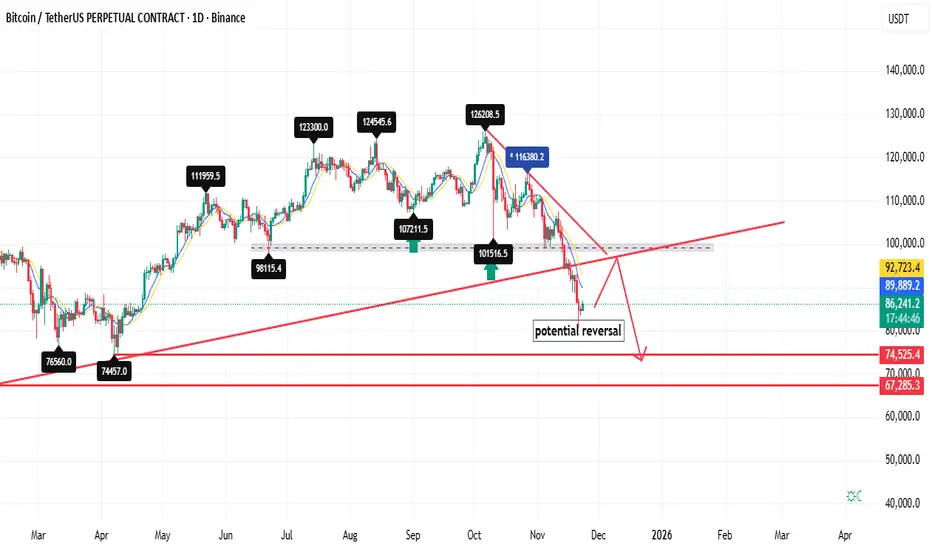
The current market structure for Bitcoin is bearish, characterized by a series of lower highs and lower lows. While the recent decline has been significant, it is interpreted not as a market end, but as a necessary correction within a larger bullish context. Technical analysis suggests the downtrend has further room to extend, with a primary target in the **$67,000 support zone**. However, a decisive break above key resistance could invalidate this bearish short-term outlook and signal the start of a powerful reversal, with a potential long-term target of **$99,000** by the end of the month. This report outlines the critical levels and scenarios.
---
1. Current Market Structure & Trend Analysis
* **Primary Trend (Long-term):** The move from the 2023 lows remains intact, suggesting the overall bull market is not over.
* **Intermediate Trend (Medium-term):** **Bearish.** Price action has formed a clear downtrend from the all-time high, with sellers in control.
* **Key Observation:** The "falling was not the end" aligns with the Elliott Wave principle, where this decline is likely a corrective wave (e.g., Wave 4 or a significant pullback) before a final impulsive Wave 5 advance begins.
2. Critical Technical Levels
Support Levels:
* **Immediate Support:** **$74,400** (Recent swing low and psychological level). A break below this confirms the downtrend's continuation.
* **Primary Downside Target / Strong Support Zone:** **$67,000 - $68,000**. This zone is critical as it represents:
* The 0.50 - 0.618 Fibonacci retracement level of the prior major upward move.
* A previous significant resistance level that should now act as support.
* A high-volume node and area of prior consolidation.
Resistance Levels:
* **Immediate Resistance:** The descending trendline connecting the recent lower highs.
* **Key Breakdown Level / Bullish Invalidation:** **$69,000** (A break below this would signal a deeper correction than currently anticipated).
* **Major Resistance & Reversal Confirmation:** **$98,000**. A decisive weekly close above this level would confirm the downtrend is broken and the anticipated reversal to new highs is underway.
3. Scenario Analysis & Forward Outlook
#### **Scenario 1: Bearish Continuation (High Probability in Short-Term)**
* **Path:** Selling pressure continues. Price breaks below the immediate support at **$74,400** and follows the prevailing downtrend channel.
* **Target:** The decline is expected to find a significant floor and strong buyer interest in the **$67,000 - $68,000 support zone**. This is the most probable area for the downtrend to exhaust itself.
* **Rationale:** This move would complete a standard technical correction, shaking out weak hands and establishing a solid base for the next leg up.
**Scenario 2: Bullish Reversal (Potential for End of Month)
* **Catalyst:** A strong bullish reversal pattern (e.g., a double bottom or bullish engulfing) forming at or near the **$67,000 support zone**.
* **Path:** A powerful rally from the support zone, breaking above the descending trendline and then consolidating. Momentum would then build for an assault on the all-time high resistance near **$98,000**.
* **Target:** A successful breakout above **$98,000** would project a move towards the **$99,000** target, potentially achievable by month-end if momentum is exceptionally strong.
* **Rationale:** This aligns with the "potential reversal was expected" view. It would represent the start of the final impulsive Wave 5 in the larger bull market cycle.
4. Key Indicators & Confluences
* **Volume:** Observe for increasing volume on a bounce from the $67,000 zone or on a break above the downtrend resistance. Declining volume on downward moves suggests selling pressure is waning.
* **RSI (Relative Strength Index):** Currently in bearish territory. Look for a bullish divergence (price makes a new low but RSI makes a higher low) as a strong buy signal near the $67,000 target.
* **Moving Averages:** The 50-day MA is likely below the 200-day MA (a Death Cross), confirming the bearish intermediate trend. A reversal would be signaled by price reclaiming these key averages.
---
Conclusion & Strategic Implications
The technical evidence points towards a continued downtrend with a high probability of testing the **$67,000 - $68,000 support zone**. This move is not viewed as catastrophic but as a healthy correction within a broader bull market.
* **For Traders:** The path of least resistance is down. Short-term positions might target the $67,000 area. Aggressive longs should wait for a confirmed reversal signal (e.g., a bullish hammer candle on high volume) at the key support.
* **For Investors:** The **$67,000 zone** represents a high-probability, high-value accumulation area for long-term portfolios. The anticipated reversal from this level, targeting **$99,000**, offers a favorable risk-to-reward ratio.
**Risk Warning:** A sustained break below the **$67,000** support zone would invalidate the bullish reversal scenario and open the door for a deeper correction, potentially towards $60,000. All traders should employ strict risk management.
---
**Disclaimer:** This report is based solely on technical analysis and does not constitute financial advice. The cryptocurrency market is highly volatile. You should conduct your own research and consult with a qualified financial advisor before making any investment decisions.
Downtrend in Progress, Monitoring for a Potential Major Reversal
The current market structure for Bitcoin is bearish, characterized by a series of lower highs and lower lows. While the recent decline has been significant, it is interpreted not as a market end, but as a necessary correction within a larger bullish context. Technical analysis suggests the downtrend has further room to extend, with a primary target in the **$67,000 support zone**. However, a decisive break above key resistance could invalidate this bearish short-term outlook and signal the start of a powerful reversal, with a potential long-term target of **$99,000** by the end of the month. This report outlines the critical levels and scenarios.
---
1. Current Market Structure & Trend Analysis
* **Primary Trend (Long-term):** The move from the 2023 lows remains intact, suggesting the overall bull market is not over.
* **Intermediate Trend (Medium-term):** **Bearish.** Price action has formed a clear downtrend from the all-time high, with sellers in control.
* **Key Observation:** The "falling was not the end" aligns with the Elliott Wave principle, where this decline is likely a corrective wave (e.g., Wave 4 or a significant pullback) before a final impulsive Wave 5 advance begins.
2. Critical Technical Levels
Support Levels:
* **Immediate Support:** **$74,400** (Recent swing low and psychological level). A break below this confirms the downtrend's continuation.
* **Primary Downside Target / Strong Support Zone:** **$67,000 - $68,000**. This zone is critical as it represents:
* The 0.50 - 0.618 Fibonacci retracement level of the prior major upward move.
* A previous significant resistance level that should now act as support.
* A high-volume node and area of prior consolidation.
Resistance Levels:
* **Immediate Resistance:** The descending trendline connecting the recent lower highs.
* **Key Breakdown Level / Bullish Invalidation:** **$69,000** (A break below this would signal a deeper correction than currently anticipated).
* **Major Resistance & Reversal Confirmation:** **$98,000**. A decisive weekly close above this level would confirm the downtrend is broken and the anticipated reversal to new highs is underway.
3. Scenario Analysis & Forward Outlook
#### **Scenario 1: Bearish Continuation (High Probability in Short-Term)**
* **Path:** Selling pressure continues. Price breaks below the immediate support at **$74,400** and follows the prevailing downtrend channel.
* **Target:** The decline is expected to find a significant floor and strong buyer interest in the **$67,000 - $68,000 support zone**. This is the most probable area for the downtrend to exhaust itself.
* **Rationale:** This move would complete a standard technical correction, shaking out weak hands and establishing a solid base for the next leg up.
**Scenario 2: Bullish Reversal (Potential for End of Month)
* **Catalyst:** A strong bullish reversal pattern (e.g., a double bottom or bullish engulfing) forming at or near the **$67,000 support zone**.
* **Path:** A powerful rally from the support zone, breaking above the descending trendline and then consolidating. Momentum would then build for an assault on the all-time high resistance near **$98,000**.
* **Target:** A successful breakout above **$98,000** would project a move towards the **$99,000** target, potentially achievable by month-end if momentum is exceptionally strong.
* **Rationale:** This aligns with the "potential reversal was expected" view. It would represent the start of the final impulsive Wave 5 in the larger bull market cycle.
4. Key Indicators & Confluences
* **Volume:** Observe for increasing volume on a bounce from the $67,000 zone or on a break above the downtrend resistance. Declining volume on downward moves suggests selling pressure is waning.
* **RSI (Relative Strength Index):** Currently in bearish territory. Look for a bullish divergence (price makes a new low but RSI makes a higher low) as a strong buy signal near the $67,000 target.
* **Moving Averages:** The 50-day MA is likely below the 200-day MA (a Death Cross), confirming the bearish intermediate trend. A reversal would be signaled by price reclaiming these key averages.
---
Conclusion & Strategic Implications
The technical evidence points towards a continued downtrend with a high probability of testing the **$67,000 - $68,000 support zone**. This move is not viewed as catastrophic but as a healthy correction within a broader bull market.
* **For Traders:** The path of least resistance is down. Short-term positions might target the $67,000 area. Aggressive longs should wait for a confirmed reversal signal (e.g., a bullish hammer candle on high volume) at the key support.
* **For Investors:** The **$67,000 zone** represents a high-probability, high-value accumulation area for long-term portfolios. The anticipated reversal from this level, targeting **$99,000**, offers a favorable risk-to-reward ratio.
**Risk Warning:** A sustained break below the **$67,000** support zone would invalidate the bullish reversal scenario and open the door for a deeper correction, potentially towards $60,000. All traders should employ strict risk management.
---
**Disclaimer:** This report is based solely on technical analysis and does not constitute financial advice. The cryptocurrency market is highly volatile. You should conduct your own research and consult with a qualified financial advisor before making any investment decisions.
Wyłączenie odpowiedzialności
Informacje i publikacje nie stanowią i nie powinny być traktowane jako porady finansowe, inwestycyjne, tradingowe ani jakiekolwiek inne rekomendacje dostarczane lub zatwierdzone przez TradingView. Więcej informacji znajduje się w Warunkach użytkowania.
Wyłączenie odpowiedzialności
Informacje i publikacje nie stanowią i nie powinny być traktowane jako porady finansowe, inwestycyjne, tradingowe ani jakiekolwiek inne rekomendacje dostarczane lub zatwierdzone przez TradingView. Więcej informacji znajduje się w Warunkach użytkowania.