1. Trend Context
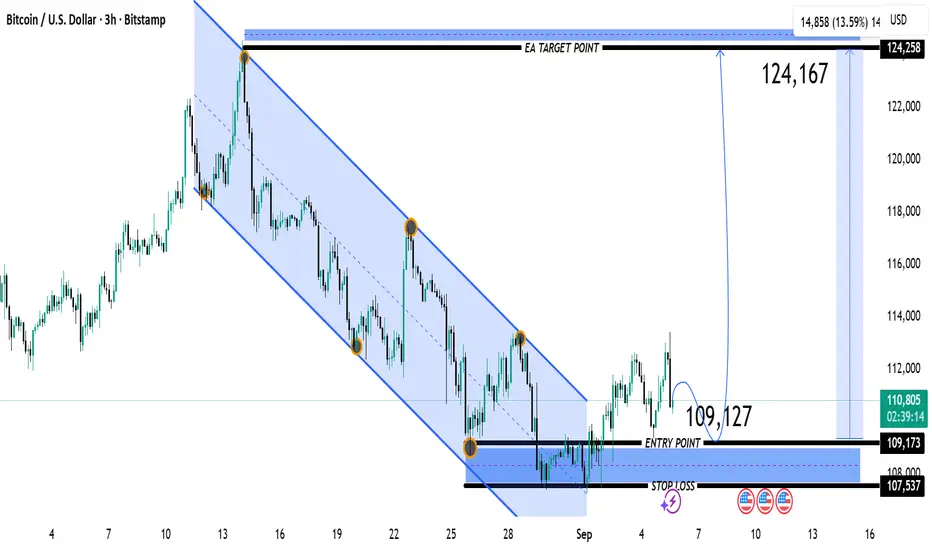
The chart shows BTC in a descending channel (highlighted in blue) from mid-August to early September.
Recently, price broke out of this channel to the upside, signaling a potential trend reversal.
2. Key Levels
Entry Point: Around 109,127 – 109,173 USD (highlighted zone).
Stop Loss: Around 107,537 USD, just below recent support.
Target Point (EA Target): 124,167 – 124,258 USD.
3. Risk–Reward Setup
Entry vs Stop Loss: Risk ≈ 1,600 points.
Entry vs Target: Reward ≈ 15,000 points.
Risk-to-Reward ratio ≈ 1:9.3, which is very favorable.
4. Technical Signals
Breakout of Downtrend: Price exited the descending channel, which often suggests the end of bearish momentum.
Support Zone Retest: The entry level aligns with a strong support zone (black box), previously resistance during the channel breakdowns.
Upside Projection: Target around 124K corresponds to previous strong resistance and Fibonacci extension.
📈 Trading Idea (based on chart)
Buy Entry: ~109,127 – 109,173
Stop Loss: ~107,537
Take Profit: ~124,167 – 124,258
Expected Gain: +13.5% (approx.)
Expected Loss: -1.5% (approx.)
⚠️ Notes
This is a high risk–reward setup favoring bulls, but BTC is very volatile.
If price falls below 107,500, the bullish setup invalidates.
Confirmation with higher timeframes (Daily/Weekly) would strengthen the trade signal.
✅ In summary:
The chart suggests a bullish breakout trade, with entry around 109K, stop below 107.5K, and a large target near 124K. The setup favors buyers if support holds.
Join my telegram (COPY_TRADE)
t.me/+4ns23-AkD5RmM2Q0
t.me/+4ns23-AkD5RmM2Q0
Join my refrel broker link
one.exnesstrack.org/a/l1t1rf3p6v
t.me/+4ns23-AkD5RmM2Q0
t.me/+4ns23-AkD5RmM2Q0
Join my refrel broker link
one.exnesstrack.org/a/l1t1rf3p6v
Wyłączenie odpowiedzialności
Informacje i publikacje przygotowane przez TradingView lub jego użytkowników, prezentowane na tej stronie, nie stanowią rekomendacji ani porad handlowych, inwestycyjnych i finansowych i nie powinny być w ten sposób traktowane ani wykorzystywane. Więcej informacji na ten temat znajdziesz w naszym Regulaminie.