Determining Bitcoin's Final Drop Using Fibonacci Levels
📊 Summary
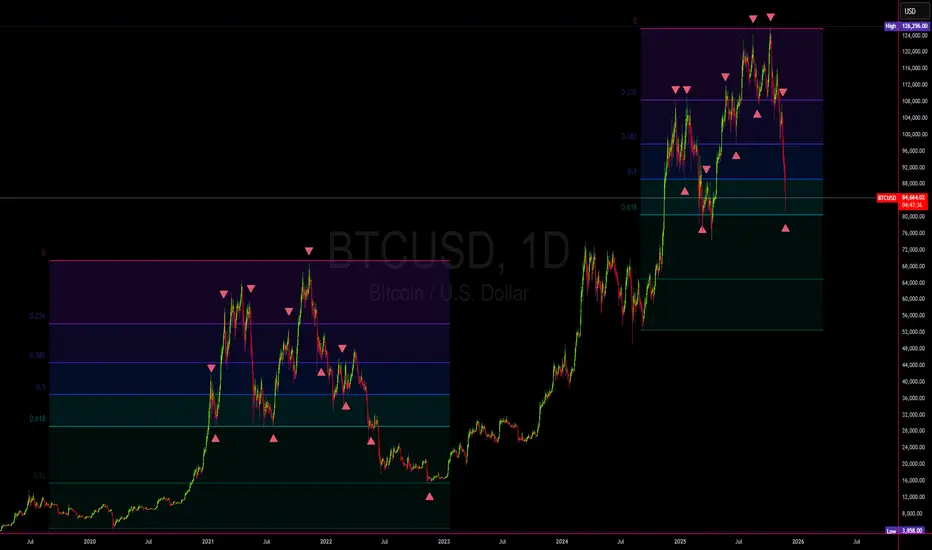
Based on historical Fibonacci and cyclical analysis, Bitcoin, after reaching its 2025 peak at **$124,000**, has entered a corrective phase similar to the 2021–2022 cycle. Currently, it is sitting near the 0.618 Fibonacci level (~$84,000), and if past patterns repeat, the next likely drop extends toward the **0.83 Fibonacci level at $65,000**.
🔹 Cycle Comparison
Phase Fibo Level 2021 Cycle 2025 Cycle (Projection)
-------------------------------------------------------------------------
Cycle Top 0.0 $69,000 $124,000
Mid Correction 0.5 $47,000 $83,000
Major Support 0.618 $42,000 $74,000
Final Support 0.83 $29,000 **$65,000**
🔻 Current Trend Analysis
1. After a strong rally to 124K, Bitcoin has started a structured correction.
2. The price is consolidating around 84K, similar to its 2021 sideways phase before a drop.
3. If the pattern repeats, the next leg down targets around 65K before potential stabilization.
🎯 Final Outlook
The $65,000 zone is expected to be a temporary cycle bottom and key support area for Bitcoin.
If this zone fails, the next long-term support lies near $52,000
💬 If you agree with this analysis, give it a like 👍 and if you have a different view, share it in the comments so
📊 Summary
Based on historical Fibonacci and cyclical analysis, Bitcoin, after reaching its 2025 peak at **$124,000**, has entered a corrective phase similar to the 2021–2022 cycle. Currently, it is sitting near the 0.618 Fibonacci level (~$84,000), and if past patterns repeat, the next likely drop extends toward the **0.83 Fibonacci level at $65,000**.
🔹 Cycle Comparison
Phase Fibo Level 2021 Cycle 2025 Cycle (Projection)
-------------------------------------------------------------------------
Cycle Top 0.0 $69,000 $124,000
Mid Correction 0.5 $47,000 $83,000
Major Support 0.618 $42,000 $74,000
Final Support 0.83 $29,000 **$65,000**
🔻 Current Trend Analysis
1. After a strong rally to 124K, Bitcoin has started a structured correction.
2. The price is consolidating around 84K, similar to its 2021 sideways phase before a drop.
3. If the pattern repeats, the next leg down targets around 65K before potential stabilization.
🎯 Final Outlook
The $65,000 zone is expected to be a temporary cycle bottom and key support area for Bitcoin.
If this zone fails, the next long-term support lies near $52,000
💬 If you agree with this analysis, give it a like 👍 and if you have a different view, share it in the comments so
Powiązane publikacje
Wyłączenie odpowiedzialności
Informacje i publikacje nie stanowią i nie powinny być traktowane jako porady finansowe, inwestycyjne, tradingowe ani jakiekolwiek inne rekomendacje dostarczane lub zatwierdzone przez TradingView. Więcej informacji znajduje się w Warunkach użytkowania.