Indicators
Smart Money Support/Resistance (Lite) & ATAI Volume Analysis with Price Action V1.03
Analytical Setup
• LTF: 10 seconds
• LTF Coverage Bars: 70
• Global Volume Period: 52
• Market Type: Range
• Active Zones:
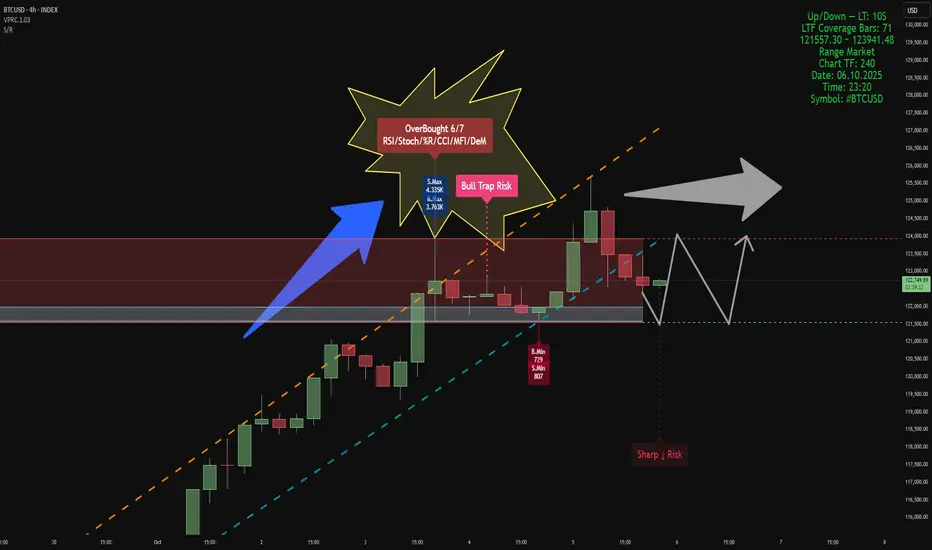
- Support Zone: 121,557 – 123,941 USD (current active range shown in panel)
The analysis timeframe ensures valid volume coverage, as the period (52) is smaller than total LTF bars (70).
Resistance Area & Bull Trap Risk
In the upper range (≈123,900 USD), a Bull Trap Risk has formed immediately after an OverBought 6/7 condition — confirmed by RSI, Stoch, %R, CCI, MFI, and DeM modules in ATAI. At this point, both buy and sell volumes peaked within the 52-bar window, with S.Max = 4.33K and B.Max = 3.76K. This slight dominance by sellers indicates demand absorption at the top of the structure. The setup matches ATAI’s trap logic — high wick, overbought context, and volume imbalance — signaling potential exhaustion near resistance.
Support Area
Support is currently anchored near 121,550 USD, derived from B.Min and S.Min lows (B.Min = 7.29, S.Min = 807). This aligns with the lower projection from Smart Money S/R, marking the point where cumulative delta begins to compress. Historically, compression at minimum-volume zones often precedes short-term accumulation or range stabilization.
Structural Behavior
The chart shows a defined upward channel (orange and cyan dashed lines). After testing the upper boundary, price entered the resistance zone and generated a Bull Trap Risk followed by moderate rejection. Below, the Sharp ↓ Risk tag signals potential for a short liquidity sweep before stabilization. Volume readings still support range continuation rather than a confirmed reversal, consistent with the Range Market tag.
Probable Scenario
1. A short pullback toward the lower boundary of support (~121.5K) is expected.
2. If support holds and volume compression persists, a rebound toward 123.9K (resistance ceiling) is probable.
3. A breakdown below 121.5K could trigger a deeper correction toward the next S/R projection near 120K.
This represents a neutral-to-bullish range bias: short-term weakness, but constructive above support.
Summary
• OverBought 6/7 + Bull Trap Risk detected at resistance (≈123.9K).
• Support around 121.5K built from B.Min and S.Min.
• Sellers slightly dominant at the trap peak.
• Likely scenario: retest of support, then rebound toward resistance if volume confirms.
• Bias: range continuation until breakout beyond 123.9K or breakdown below 121.5K.
Zlecenie aktywne
BTCUSD – 4H Volume-Structure UpdateAfter our previous analysis, BTC moved exactly as projected — a correction followed the OverBought (6/7) zone and Bull Trap Risk signal.
Price is now consolidating between 121,500 – 124,000, confirming a short-term range structure.
At this stage, market momentum remains neutral; volume flow suggests buyers and sellers are balancing around the mid-range.
A breakout above 124,500 could open the path toward 126,000, while a drop below 121,000 may extend the correction toward 118,000.
Let’s keep watching how volume dynamics evolve here. 📊
Powiązane publikacje
Wyłączenie odpowiedzialności
Informacje i publikacje przygotowane przez TradingView lub jego użytkowników, prezentowane na tej stronie, nie stanowią rekomendacji ani porad handlowych, inwestycyjnych i finansowych i nie powinny być w ten sposób traktowane ani wykorzystywane. Więcej informacji na ten temat znajdziesz w naszym Regulaminie.