Title:
Complete Beginner’s Guide to Fibonacci, AutoFibGauge, and How to Plan Perfect Trades! 🎯
⸻
Many traders hear about Fibonacci but don’t really know what it is or how to use it properly.
Here’s a full beginner-friendly guide covering everything — from the math basics to real trading strategies!
What is Fibonacci?
The Fibonacci Sequence is a set of numbers where each number is the sum of the two numbers before it.
It looks like this:
0, 1, 1, 2, 3, 5, 8, 13, 21, 34, 55, 89, 144…
This simple rule creates a pattern that we see everywhere in nature:
• In the way flowers bloom
• In the spiral of seashells
• In the structure of hurricanes
• Even in galaxies
Nature follows Fibonacci.
Markets, which are built by human emotions (fear, greed, hope), also often follow Fibonacci behavior.
That’s why Fibonacci is important in trading.
⸻
The Special Golden Ratio — 61.8%
From the Fibonacci sequence, if you divide a number by the next one (e.g., 21 ÷ 34), you get approximately 0.618 — or 61.8%.
This is called the Golden Ratio.
The Golden Ratio shows up in art, architecture, music, human faces, and… yes, financial markets.
In trading, the 61.8% retracement is considered the strongest potential turning point.
If a price pulls back by around 61.8%, there’s a high chance it will bounce and continue the trend.
⸻
What is Fibonacci Retracement in Trading?
In trading, after a big move (up or down), the market rarely moves in a straight line.
It pulls back (corrects) before continuing.
Fibonacci Retracement levels help us predict where the pullback might end and the trend might continue.
Commonly Used Fibonacci Levels:
• 23.6% — Very shallow retracement
• 38.2% — Healthy pullback
• 50.0% — Halfway mark (not a Fibonacci number, but widely watched)
• 61.8% — Golden zone (high probability area)
• 78.6% — Deep retracement before a reversal
Traders look at these levels as support and resistance zones.
⸻
What is AutoFibGauge?
Normally, drawing Fibonacci manually takes time — you have to find correct swings and plot retracement.
AutoFibGauge does it automatically:
• Detects swing highs and swing lows
• Plots Fibonacci retracement levels instantly
• Keeps updating live as price moves
✅ Saves time
✅ Reduces human error
✅ Keeps your chart clean and professional
It’s built for traders who want speed, simplicity, and reliability.
⸻
My Default Settings for AutoFibGauge:
• Swing Length: 25
• Fib Levels Displayed: 23.6%, 38.2%, 50.0%, 61.8%, 78.6%, 100%
• Mode: Automatic (finds swings without needing to adjust)
• Visual: Bands instead of just thin lines (for easier viewing)
Adjustment Tip:
• 15 min chart: Swing Length 20–25
• 1 Hour chart: Swing Length 25–30
• 4 Hour chart: Swing Length 30–40
Higher timeframes = Slightly bigger swing lengths.
⸻
How to Plan Entry:
1. Wait for price to approach a major Fibonacci level (especially 38.2%, 50%, or 61.8%).
2. Watch how the candles behave:
• If you see a bullish engulfing candle, hammer, or strong bounce from the level → Good sign to buy.
• If price hesitates or gives bearish reversal → Could signal continuation of downtrend.
3. Combine with trend confirmation tools (QMA, Parabolic SAR, moving averages).
✅ Remember: Confirmation is key.
Don’t just blindly buy or sell because price touched a level.
⸻
How to Plan Exit:
• Set first target at the next major Fibonacci level.
Example:
• If you enter near 61.8%, target 38.2% or 23.6%.
• Another method: Trail your stop-loss behind swing highs/lows as price moves in your favor.
✅ This way you lock profits even if the market reverses later.
⸻
When Fibonacci Works Well:
✅ In trending markets (clear uptrend or downtrend)
✅ When combined with price action or indicators
✅ After strong impulsive moves followed by natural pullbacks
⸻
When Fibonacci Might Not Work Well:
❌ In sideways (rangebound) markets
❌ During extreme news events or unexpected volatility
❌ When used alone without confirmation
Always remember — Fibonacci levels are not magical.
They are guidelines, not exact rules.
You need to combine them with market structure and momentum for best results.
⸻
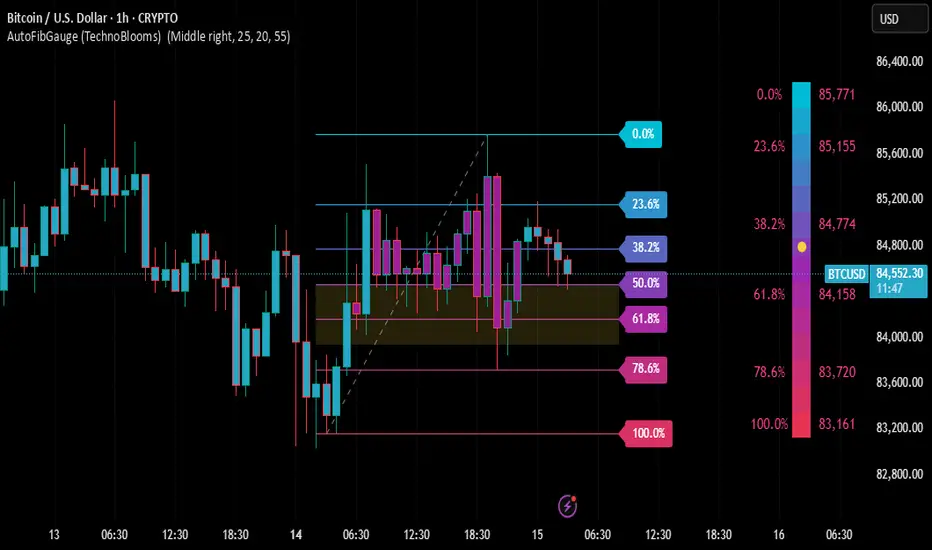
Real Example (BTC/USD 1H Chart):
• After a rally, price retraced into the 50%-61.8% zone.
• Bullish candles appeared showing price respecting the zone.
• This was an excellent opportunity to plan a long entry with Fibonacci guidance.
⸻
Final Words:
• Fibonacci is not only for “professional” traders — anyone can learn it.
• AutoFibGauge makes using Fibonacci simple and automatic, even if you’re just starting out.
• If you respect the levels, wait for confirmation, and follow a disciplined plan, Fibonacci becomes one of your best trading tools.
⸻
Found this helpful? Tap LIKE ❤ & FOLLOW ➕ for more beginner-to-advanced trading guides every week!
⸻
#Fibonacci #AutoFibGauge #FibonacciRetracement #TechnicalAnalysis #PriceAction #TradingTools #LearnTrading #CryptoTrading #ForexStrategy #SwingTrading #BeginnersGuide
Complete Beginner’s Guide to Fibonacci, AutoFibGauge, and How to Plan Perfect Trades! 🎯
⸻
Many traders hear about Fibonacci but don’t really know what it is or how to use it properly.
Here’s a full beginner-friendly guide covering everything — from the math basics to real trading strategies!
What is Fibonacci?
The Fibonacci Sequence is a set of numbers where each number is the sum of the two numbers before it.
It looks like this:
0, 1, 1, 2, 3, 5, 8, 13, 21, 34, 55, 89, 144…
This simple rule creates a pattern that we see everywhere in nature:
• In the way flowers bloom
• In the spiral of seashells
• In the structure of hurricanes
• Even in galaxies
Nature follows Fibonacci.
Markets, which are built by human emotions (fear, greed, hope), also often follow Fibonacci behavior.
That’s why Fibonacci is important in trading.
⸻
The Special Golden Ratio — 61.8%
From the Fibonacci sequence, if you divide a number by the next one (e.g., 21 ÷ 34), you get approximately 0.618 — or 61.8%.
This is called the Golden Ratio.
The Golden Ratio shows up in art, architecture, music, human faces, and… yes, financial markets.
In trading, the 61.8% retracement is considered the strongest potential turning point.
If a price pulls back by around 61.8%, there’s a high chance it will bounce and continue the trend.
⸻
What is Fibonacci Retracement in Trading?
In trading, after a big move (up or down), the market rarely moves in a straight line.
It pulls back (corrects) before continuing.
Fibonacci Retracement levels help us predict where the pullback might end and the trend might continue.
Commonly Used Fibonacci Levels:
• 23.6% — Very shallow retracement
• 38.2% — Healthy pullback
• 50.0% — Halfway mark (not a Fibonacci number, but widely watched)
• 61.8% — Golden zone (high probability area)
• 78.6% — Deep retracement before a reversal
Traders look at these levels as support and resistance zones.
⸻
What is AutoFibGauge?
Normally, drawing Fibonacci manually takes time — you have to find correct swings and plot retracement.
AutoFibGauge does it automatically:
• Detects swing highs and swing lows
• Plots Fibonacci retracement levels instantly
• Keeps updating live as price moves
✅ Saves time
✅ Reduces human error
✅ Keeps your chart clean and professional
It’s built for traders who want speed, simplicity, and reliability.
⸻
My Default Settings for AutoFibGauge:
• Swing Length: 25
• Fib Levels Displayed: 23.6%, 38.2%, 50.0%, 61.8%, 78.6%, 100%
• Mode: Automatic (finds swings without needing to adjust)
• Visual: Bands instead of just thin lines (for easier viewing)
Adjustment Tip:
• 15 min chart: Swing Length 20–25
• 1 Hour chart: Swing Length 25–30
• 4 Hour chart: Swing Length 30–40
Higher timeframes = Slightly bigger swing lengths.
⸻
How to Plan Entry:
1. Wait for price to approach a major Fibonacci level (especially 38.2%, 50%, or 61.8%).
2. Watch how the candles behave:
• If you see a bullish engulfing candle, hammer, or strong bounce from the level → Good sign to buy.
• If price hesitates or gives bearish reversal → Could signal continuation of downtrend.
3. Combine with trend confirmation tools (QMA, Parabolic SAR, moving averages).
✅ Remember: Confirmation is key.
Don’t just blindly buy or sell because price touched a level.
⸻
How to Plan Exit:
• Set first target at the next major Fibonacci level.
Example:
• If you enter near 61.8%, target 38.2% or 23.6%.
• Another method: Trail your stop-loss behind swing highs/lows as price moves in your favor.
✅ This way you lock profits even if the market reverses later.
⸻
When Fibonacci Works Well:
✅ In trending markets (clear uptrend or downtrend)
✅ When combined with price action or indicators
✅ After strong impulsive moves followed by natural pullbacks
⸻
When Fibonacci Might Not Work Well:
❌ In sideways (rangebound) markets
❌ During extreme news events or unexpected volatility
❌ When used alone without confirmation
Always remember — Fibonacci levels are not magical.
They are guidelines, not exact rules.
You need to combine them with market structure and momentum for best results.
⸻
Real Example (BTC/USD 1H Chart):
• After a rally, price retraced into the 50%-61.8% zone.
• Bullish candles appeared showing price respecting the zone.
• This was an excellent opportunity to plan a long entry with Fibonacci guidance.
⸻
Final Words:
• Fibonacci is not only for “professional” traders — anyone can learn it.
• AutoFibGauge makes using Fibonacci simple and automatic, even if you’re just starting out.
• If you respect the levels, wait for confirmation, and follow a disciplined plan, Fibonacci becomes one of your best trading tools.
⸻
Found this helpful? Tap LIKE ❤ & FOLLOW ➕ for more beginner-to-advanced trading guides every week!
⸻
#Fibonacci #AutoFibGauge #FibonacciRetracement #TechnicalAnalysis #PriceAction #TradingTools #LearnTrading #CryptoTrading #ForexStrategy #SwingTrading #BeginnersGuide
Wyłączenie odpowiedzialności
Informacje i publikacje nie stanowią i nie powinny być traktowane jako porady finansowe, inwestycyjne, tradingowe ani jakiekolwiek inne rekomendacje dostarczane lub zatwierdzone przez TradingView. Więcej informacji znajduje się w Warunkach użytkowania.
Wyłączenie odpowiedzialności
Informacje i publikacje nie stanowią i nie powinny być traktowane jako porady finansowe, inwestycyjne, tradingowe ani jakiekolwiek inne rekomendacje dostarczane lub zatwierdzone przez TradingView. Więcej informacji znajduje się w Warunkach użytkowania.