Bitcoin Daily Outlook: Navigating the Pullback & Key Levels
Disclaimer:
The information provided in this chart is for educational and informational purposes only and should not be considered as investment advice. Trading and investing involve substantial risk and are not suitable for every investor. You should carefully consider your financial situation and consult with a financial advisor before making any investment decisions. The creator of this chart does not guarantee any specific outcome or profit and is not responsible for any losses incurred as a result of using this information. Past performance is not indicative of future results. Use this information at your own risk. This chart has been created for my own improvement in Trading and Investment Analysis. Please do your own analysis before any investments.
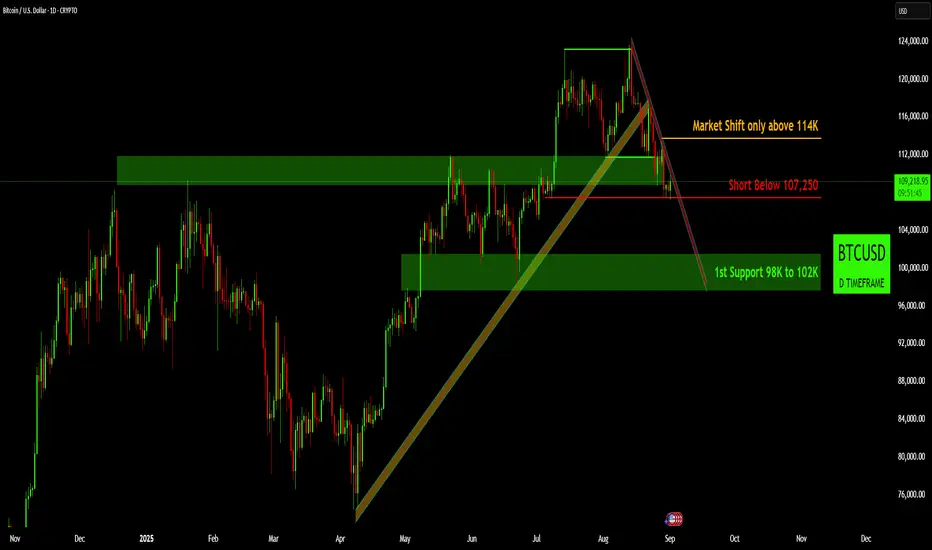
- Bearish Momentum: The long-term bullish trendline that started in April has been clearly broken, and Bitcoin is currently trading within a short-term downtrend channel, indicating a shift in immediate momentum.
- Downside Confirmation: We're looking at a critical level around 107,250. If Bitcoin breaks and holds below this point, it would confirm further bearish momentum and suggest more downside.
- Bullish Reversal: For a significant bullish market shift and to regain upward momentum, Bitcoin needs to decisively break and sustain above the 114,000 mark.
- Key Support: Our immediate downside target and the first strong support zone to watch is between $98,000 and $102,000. This is where we might see buyers step in for a potential bounce.
Disclaimer:
The information provided in this chart is for educational and informational purposes only and should not be considered as investment advice. Trading and investing involve substantial risk and are not suitable for every investor. You should carefully consider your financial situation and consult with a financial advisor before making any investment decisions. The creator of this chart does not guarantee any specific outcome or profit and is not responsible for any losses incurred as a result of using this information. Past performance is not indicative of future results. Use this information at your own risk. This chart has been created for my own improvement in Trading and Investment Analysis. Please do your own analysis before any investments.
Wyłączenie odpowiedzialności
Informacje i publikacje przygotowane przez TradingView lub jego użytkowników, prezentowane na tej stronie, nie stanowią rekomendacji ani porad handlowych, inwestycyjnych i finansowych i nie powinny być w ten sposób traktowane ani wykorzystywane. Więcej informacji na ten temat znajdziesz w naszym Regulaminie.