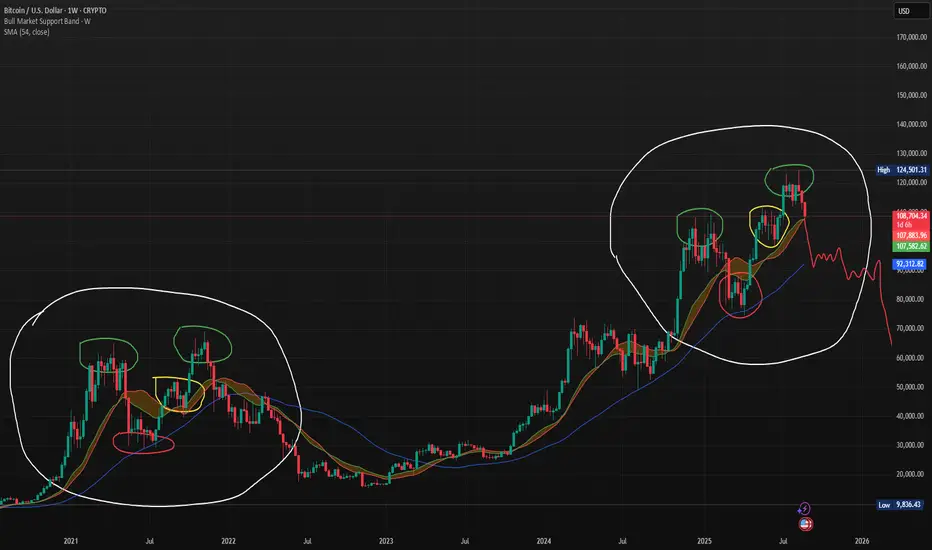
This chart compares Bitcoin’s current weekly price action to its 2021 market structure. Both periods show striking similarities: double-top patterns (green circles), mid-cycle consolidations (yellow highlights), and support retests (red circles) within the bull market support band. The projection in red outlines a potential bearish scenario, where BTC could follow a similar path to the last cycle—breaking below support and entering a prolonged corrective phase. Traders should watch the $92K SMA and bull market support band closely as critical levels for trend confirmation.
Wyłączenie odpowiedzialności
Informacje i publikacje nie stanowią i nie powinny być traktowane jako porady finansowe, inwestycyjne, tradingowe ani jakiekolwiek inne rekomendacje dostarczane lub zatwierdzone przez TradingView. Więcej informacji znajduje się w Warunkach użytkowania.
Wyłączenie odpowiedzialności
Informacje i publikacje nie stanowią i nie powinny być traktowane jako porady finansowe, inwestycyjne, tradingowe ani jakiekolwiek inne rekomendacje dostarczane lub zatwierdzone przez TradingView. Więcej informacji znajduje się w Warunkach użytkowania.