🔍 Price snapshot:
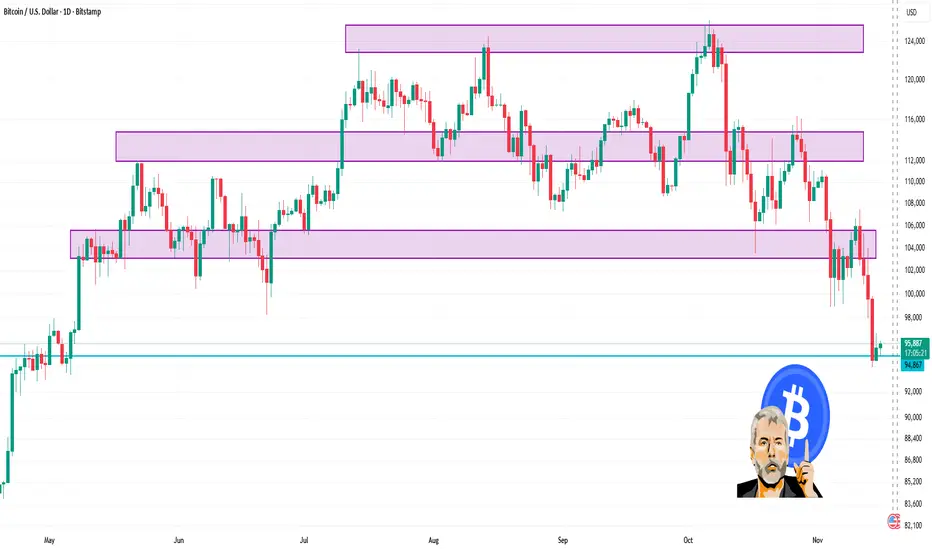
1. It’s trading in the vicinity of ~US$95,900 (as per latest data) per coin.
2. Daily range (roughly) sits between ~US$94,800 and ~US$96,400 (depending on source).
3. Technical summary on the daily timeframe is leaning toward a “Strong Sell / Sell” bias per one analytics page.
📌 Key levels to watch (daily chart):
1. Support zone: Around the US$94,000–95,000 area (recent lows)
2. Resistance zone: Around the US$100,000 + region (psychological + prior highs)
3. Because the data shows price trading below ~US$100,000 and bouncing near US$95,000, the latter areas act as important anchors.
Powiązane publikacje
Wyłączenie odpowiedzialności
Informacje i publikacje nie stanowią i nie powinny być traktowane jako porady finansowe, inwestycyjne, tradingowe ani jakiekolwiek inne rekomendacje dostarczane lub zatwierdzone przez TradingView. Więcej informacji znajduje się w Warunkach użytkowania.