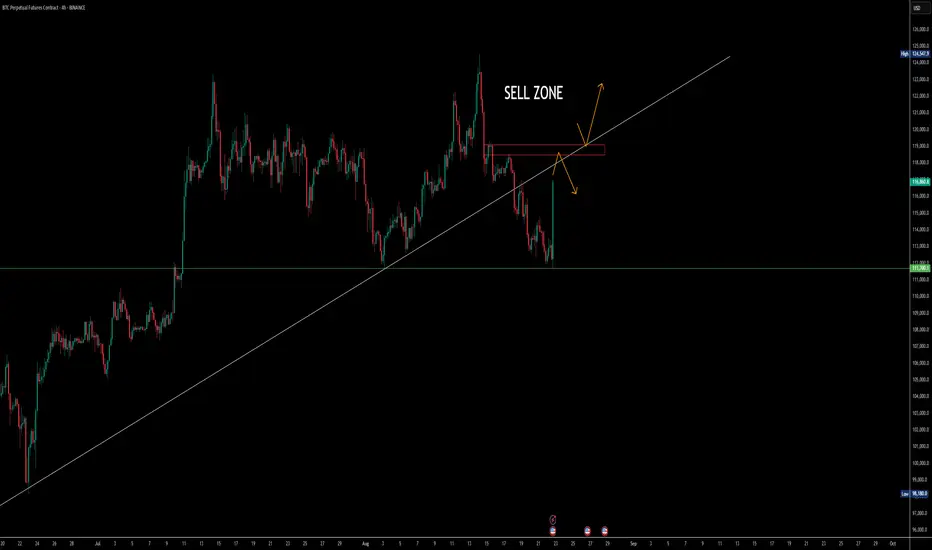
On the 4H chart, BTC recently showed a clear bullish divergence that sparked an upward move. The current structure points toward a favorable liquidity zone between 120k and 118k, but the real test lies at the 122k level. If BTC can hold above 122k, momentum could continue, but failure to sustain will likely bring a rejection back near 119k. With the weekend approaching and typical sell pressure often kicking in around Monday or Tuesday, traders should stay cautious. Longs from lower levels are looking good, but this is not the moment to expect a fresh all-time high. Watch the liquidity flips and manage positions carefully.
FOLLOW MY TELEGRAM CHANNEL FOR FREE : bit.ly/3JfrpgV
Wyłączenie odpowiedzialności
Informacje i publikacje przygotowane przez TradingView lub jego użytkowników, prezentowane na tej stronie, nie stanowią rekomendacji ani porad handlowych, inwestycyjnych i finansowych i nie powinny być w ten sposób traktowane ani wykorzystywane. Więcej informacji na ten temat znajdziesz w naszym Regulaminie.