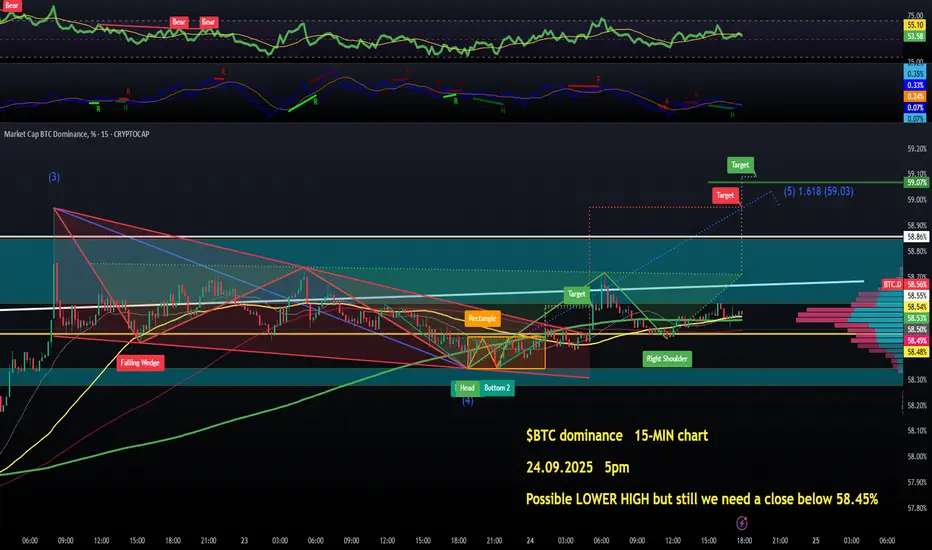
On the shortest timeframe I ever use for analysis, the 15-MIN chart it's looking like  BTC DOMINANCE could be starting to struggle with a very weak swing high right now, and under crucial resistances.
But to confirm this we basically need a breakdown below the immediate dynamic (50 & 200 SMAs, yellow and green right below the price, and just after a Golden Cross too) and horizontal support (yellow horizontal at 58.48%).
We really DON'T wanna see a breakout above the Inverse Head & Shoulders pattern (above 58.7%).
It's all simple for me, no leverage positions untilBTC DOMINANCE has decided what it wants to do👽💙
But to confirm this we basically need a breakdown below the immediate dynamic (50 & 200 SMAs, yellow and green right below the price, and just after a Golden Cross too) and horizontal support (yellow horizontal at 58.48%).
We really DON'T wanna see a breakout above the Inverse Head & Shoulders pattern (above 58.7%).
It's all simple for me, no leverage positions until
Wyłączenie odpowiedzialności
Informacje i publikacje przygotowane przez TradingView lub jego użytkowników, prezentowane na tej stronie, nie stanowią rekomendacji ani porad handlowych, inwestycyjnych i finansowych i nie powinny być w ten sposób traktowane ani wykorzystywane. Więcej informacji na ten temat znajdziesz w naszym Regulaminie.