Stock: BSE (Bombay Stock Exchange)
Timeframe: Daily (1D)
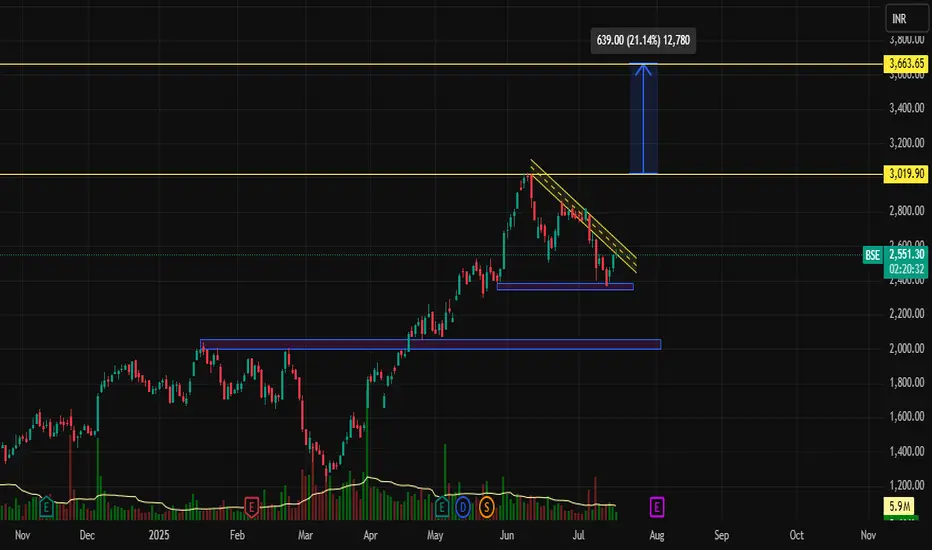
Current Price: ₹2,547.90
Potential Upside: ₹639 (+21.14%)
Resistance Levels: ₹3,019.90, ₹3,663.65
Support Zones: ₹2,370 | ₹2,110
📌 Technical Analysis
1. Falling Wedge Formation (Bullish Reversal Pattern)
BSE is currently trading within a well-defined falling wedge pattern, a classic bullish reversal structure. The stock has been consolidating after a strong uptrend and is approaching the apex of the wedge, indicating a possible breakout.
Downward Sloping Resistance Line is being tested.
The support zone around ₹2,370 has held strong multiple times, creating a solid base.
2. Volume Analysis
Noticeably declining volume during the wedge formation signals a healthy consolidation phase.
A spike in volume on breakout would confirm strong buying momentum.
🔍 Breakout Target Projection
If BSE breaks out from the wedge resistance, the measured move suggests a potential upside of ₹639, bringing the target around:
📍 Target: ₹3,180–3,340 range
📍 Long-Term Resistance: ₹3,663.65 (next major hurdle)
🧠 Strategy Suggestion
Type Entry stop loss entry
Swing Trade ₹2,600–2,650 (after breakout confirmation) ₹2,370 ₹3,019 / ₹3,340 / ₹3,663
Note: Wait for daily candle close above the falling wedge with above-average volume for confirmation.
⚠️ Key Observations
🔹 Bullish momentum from previous uptrend still intact.
🔹 Price respecting demand zone at ₹2,370.
🔹 RSI near neutral – enough room for an upside.
🔹 Ideal breakout zone: Between ₹2,600–2,650
📅 Conclusion
BSE is showing a promising setup with a falling wedge pattern supported by strong demand zones. A successful breakout could lead to a 20%+ rally. Keep this stock on your radar as it nears a potential trend reversal.
📌 Disclaimer: This is not investment advice. Do your own research or consult with a financial advisor before investing.
Timeframe: Daily (1D)
Current Price: ₹2,547.90
Potential Upside: ₹639 (+21.14%)
Resistance Levels: ₹3,019.90, ₹3,663.65
Support Zones: ₹2,370 | ₹2,110
📌 Technical Analysis
1. Falling Wedge Formation (Bullish Reversal Pattern)
BSE is currently trading within a well-defined falling wedge pattern, a classic bullish reversal structure. The stock has been consolidating after a strong uptrend and is approaching the apex of the wedge, indicating a possible breakout.
Downward Sloping Resistance Line is being tested.
The support zone around ₹2,370 has held strong multiple times, creating a solid base.
2. Volume Analysis
Noticeably declining volume during the wedge formation signals a healthy consolidation phase.
A spike in volume on breakout would confirm strong buying momentum.
🔍 Breakout Target Projection
If BSE breaks out from the wedge resistance, the measured move suggests a potential upside of ₹639, bringing the target around:
📍 Target: ₹3,180–3,340 range
📍 Long-Term Resistance: ₹3,663.65 (next major hurdle)
🧠 Strategy Suggestion
Type Entry stop loss entry
Swing Trade ₹2,600–2,650 (after breakout confirmation) ₹2,370 ₹3,019 / ₹3,340 / ₹3,663
Note: Wait for daily candle close above the falling wedge with above-average volume for confirmation.
⚠️ Key Observations
🔹 Bullish momentum from previous uptrend still intact.
🔹 Price respecting demand zone at ₹2,370.
🔹 RSI near neutral – enough room for an upside.
🔹 Ideal breakout zone: Between ₹2,600–2,650
📅 Conclusion
BSE is showing a promising setup with a falling wedge pattern supported by strong demand zones. A successful breakout could lead to a 20%+ rally. Keep this stock on your radar as it nears a potential trend reversal.
📌 Disclaimer: This is not investment advice. Do your own research or consult with a financial advisor before investing.
Zlecenie aktywne
prise movement in patternWyłączenie odpowiedzialności
Informacje i publikacje nie stanowią i nie powinny być traktowane jako porady finansowe, inwestycyjne, tradingowe ani jakiekolwiek inne rekomendacje dostarczane lub zatwierdzone przez TradingView. Więcej informacji znajduje się w Warunkach użytkowania.
Wyłączenie odpowiedzialności
Informacje i publikacje nie stanowią i nie powinny być traktowane jako porady finansowe, inwestycyjne, tradingowe ani jakiekolwiek inne rekomendacje dostarczane lub zatwierdzone przez TradingView. Więcej informacji znajduje się w Warunkach użytkowania.