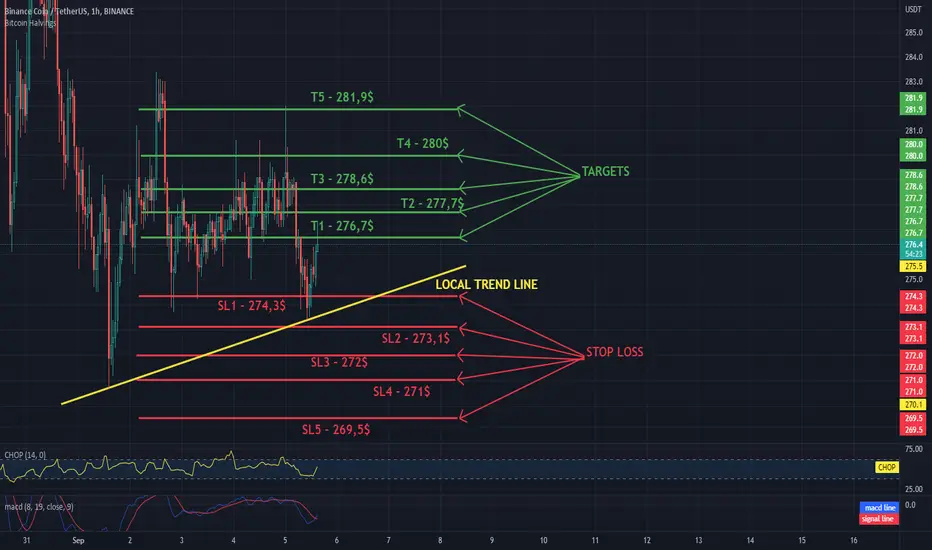
Hello everyone, let's take a look at the 1H BNB to USDT chart as you can see the price is moving above the local uptrend line.
Let's start by setting goals for the near future that we can consider:
T1 - $ 276.7
T2 - $ 277.7
T3 - $ 278.6
T4 - $ 280
and
T5 - $ 281.9
Now let's move on to the stop loss in case of further market declines:
SL1 - $ 274.3
SL2 - $ 273.1
SL3 - $ 272
SL4 - $ 271
and
SL5 - $ 269.5
Looking at the CHOP indicator, we can see that in the 1H range we have more and more energy, while the MACD indicator shows a local upward trend.
Wyłączenie odpowiedzialności
Informacje i publikacje przygotowane przez TradingView lub jego użytkowników, prezentowane na tej stronie, nie stanowią rekomendacji ani porad handlowych, inwestycyjnych i finansowych i nie powinny być w ten sposób traktowane ani wykorzystywane. Więcej informacji na ten temat znajdziesz w naszym Regulaminie.