Bank Nifty continued its short-term downtrend but managed to stabilize by closing in a tight, consolidating range. The market is now sitting directly beneath a critical resistance zone, and all eyes are on the RBI MPC outcome today.
Detailed Market Structure Breakdown
4-Hour Chart (Macro Trend)
Structure: The Bank Nifty is in a sharp corrective phase, having broken the ascending channel and making lower highs and lower lows. The current price is right below the immediate resistance at 54,750 - 54,850. The strong red candle on the 4H chart indicates that the bears are dominating the longer timeframe structure.
Key Levels:
Major Supply (Resistance): 54,750 - 54,850. This area is a crucial overhead supply, aligning with the FVG (Fair Value Gap) and a prior horizontal swing high.
Major Demand (Support): 54,250 - 54,400. This is the key "line in the sand" where the market has shown a strong tendency to reverse. A break below 54,250 would accelerate the decline toward 53,500.
Outlook: The bearish pressure is intense, but the market is consolidating right near a key breakdown point. Volatility is expected due to the RBI announcement.
1-Hour Chart (Intermediate View)
Structure: The 1H chart shows the Bank Nifty trading in a tight, descending channel, with a clear structure of lower highs. Monday and Tuesday's price action formed a small flag/pennant consolidation pattern, typically seen before a continuation of the prior trend (down).
Key Levels:
Immediate Resistance: 54,750 (Upper trendline and the bottom of the previous FVG zone).
Immediate Support: 54,450 (The low of the recent consolidation).
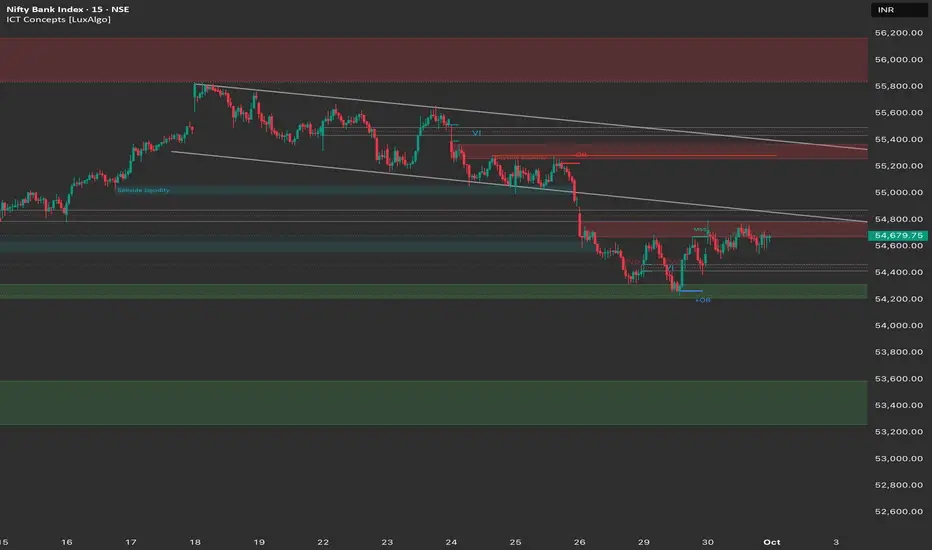
15-Minute Chart (Intraday View)
Structure: The 15M chart shows a tight, sideways-to-upward consolidation on Tuesday, marked by a Market Structure Shift (MSS) on the upside on the intraday scale. This small recovery suggests the market is attempting a technical bounce.
Key Levels:
Intraday Supply: 54,750 - 54,850. Breaking this zone will lead to a sharp move.
Intraday Demand: 54,500. The immediate support level.
Outlook: Neutral, awaiting the breakout.
Trade Plan (Wednesday, 1st October)
Market Outlook: The market is expected to be highly volatile due to the RBI MPC outcome scheduled for today. The plan must focus on exploiting the directional move that follows the announcement.
Bullish Scenario (Bounce/Reversal Plan)
Justification: A sustained move above the overhead resistance, likely triggered by a "dovish" stance or rate cut from the RBI.
Entry: Long entry on a decisive break and 15-minute candle close above 54,850 (breaking the FVG and Order Block).
Stop Loss (SL): Below 54,600.
Targets:
T1: 55,000 (Psychological resistance).
T2: 55,250 (Previous swing low/resistance).
T3: 55,400 (Upper channel resistance).
Bearish Scenario (Continuation Plan)
Justification: The continuation of the strong bearish trend, possibly due to a hawkish pause from the RBI or weak global cues.
Entry: Short entry on a decisive break and 15-minute candle close below 54,450.
Stop Loss (SL): Place a stop loss above 54,650.
Targets:
T1: 54,250 (Major support zone).
T2: 53,750 - 53,500 (Next major demand zone).
Key Levels for Observation:
Immediate Decision Point: The 54,450 - 54,850 zone.
Bearish Confirmation: A break and sustained move below 54,450.
Bullish Confirmation: A recapture of the 54,850 level.
Crucial Event: RBI MPC outcome. Trade small quantities or wait until the volatility subsides after the announcement.
Line in the Sand: 54,250.
Detailed Market Structure Breakdown
4-Hour Chart (Macro Trend)
Structure: The Bank Nifty is in a sharp corrective phase, having broken the ascending channel and making lower highs and lower lows. The current price is right below the immediate resistance at 54,750 - 54,850. The strong red candle on the 4H chart indicates that the bears are dominating the longer timeframe structure.
Key Levels:
Major Supply (Resistance): 54,750 - 54,850. This area is a crucial overhead supply, aligning with the FVG (Fair Value Gap) and a prior horizontal swing high.
Major Demand (Support): 54,250 - 54,400. This is the key "line in the sand" where the market has shown a strong tendency to reverse. A break below 54,250 would accelerate the decline toward 53,500.
Outlook: The bearish pressure is intense, but the market is consolidating right near a key breakdown point. Volatility is expected due to the RBI announcement.
1-Hour Chart (Intermediate View)
Structure: The 1H chart shows the Bank Nifty trading in a tight, descending channel, with a clear structure of lower highs. Monday and Tuesday's price action formed a small flag/pennant consolidation pattern, typically seen before a continuation of the prior trend (down).
Key Levels:
Immediate Resistance: 54,750 (Upper trendline and the bottom of the previous FVG zone).
Immediate Support: 54,450 (The low of the recent consolidation).
15-Minute Chart (Intraday View)
Structure: The 15M chart shows a tight, sideways-to-upward consolidation on Tuesday, marked by a Market Structure Shift (MSS) on the upside on the intraday scale. This small recovery suggests the market is attempting a technical bounce.
Key Levels:
Intraday Supply: 54,750 - 54,850. Breaking this zone will lead to a sharp move.
Intraday Demand: 54,500. The immediate support level.
Outlook: Neutral, awaiting the breakout.
Trade Plan (Wednesday, 1st October)
Market Outlook: The market is expected to be highly volatile due to the RBI MPC outcome scheduled for today. The plan must focus on exploiting the directional move that follows the announcement.
Bullish Scenario (Bounce/Reversal Plan)
Justification: A sustained move above the overhead resistance, likely triggered by a "dovish" stance or rate cut from the RBI.
Entry: Long entry on a decisive break and 15-minute candle close above 54,850 (breaking the FVG and Order Block).
Stop Loss (SL): Below 54,600.
Targets:
T1: 55,000 (Psychological resistance).
T2: 55,250 (Previous swing low/resistance).
T3: 55,400 (Upper channel resistance).
Bearish Scenario (Continuation Plan)
Justification: The continuation of the strong bearish trend, possibly due to a hawkish pause from the RBI or weak global cues.
Entry: Short entry on a decisive break and 15-minute candle close below 54,450.
Stop Loss (SL): Place a stop loss above 54,650.
Targets:
T1: 54,250 (Major support zone).
T2: 53,750 - 53,500 (Next major demand zone).
Key Levels for Observation:
Immediate Decision Point: The 54,450 - 54,850 zone.
Bearish Confirmation: A break and sustained move below 54,450.
Bullish Confirmation: A recapture of the 54,850 level.
Crucial Event: RBI MPC outcome. Trade small quantities or wait until the volatility subsides after the announcement.
Line in the Sand: 54,250.
Wyłączenie odpowiedzialności
Informacje i publikacje przygotowane przez TradingView lub jego użytkowników, prezentowane na tej stronie, nie stanowią rekomendacji ani porad handlowych, inwestycyjnych i finansowych i nie powinny być w ten sposób traktowane ani wykorzystywane. Więcej informacji na ten temat znajdziesz w naszym Regulaminie.