Detailed Market Structure Breakdown
4-Hour Chart (Macro Trend)
Structure: The Bank Nifty is in an accelerated corrective phase, trading below a clear descending channel. The price broke major support but found powerful buying interest at the 54,250 - 54,350 zone. This area is a key Bullish Order Block (OB) and a strong horizontal support.
Key Levels:
Major Supply (Resistance): 54,750 - 54,850. This area is now the immediate and most critical resistance, aligning with the FVG (Fair Value Gap) and a prior broken support.
Major Demand (Support): 54,250 - 54,350. This is the key "line in the sand." A sustained break below 54,250 would signal a deeper correction toward 53,500.
Outlook: The trend is strongly bearish, but the fierce defense of 54,250 on Monday suggests a temporary bottom may be in place.
1-Hour Chart (Intermediate View)
Structure: The 1H chart is bearish, confined to a descending channel. The market made a sharp move down, followed by a strong recovery, printing a large wick that penetrated the 54,250 demand zone. The strong rejection of lower prices indicates heavy buying.
Key Levels:
Immediate Resistance: The upper boundary of the descending channel, currently near 54,700.
Immediate Support: 54,250.
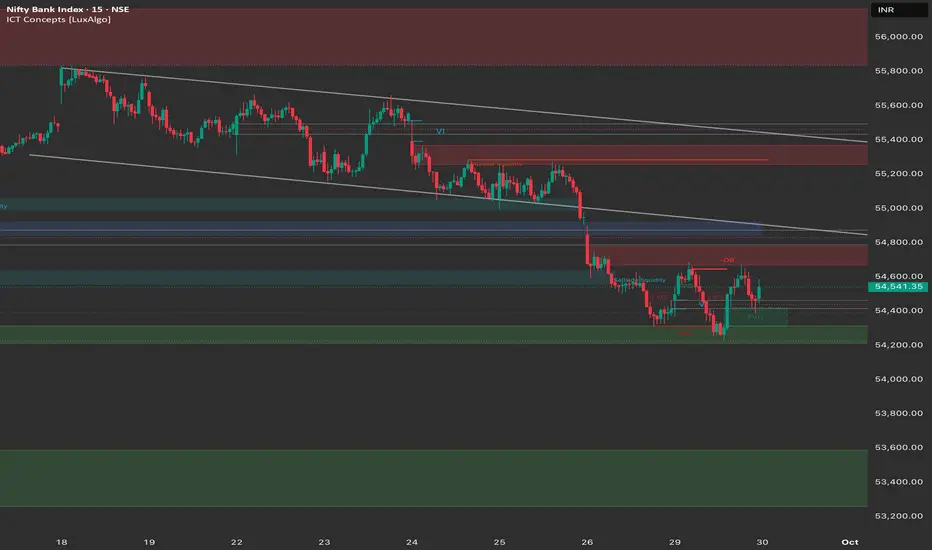
15-Minute Chart (Intraday View)
Structure: The 15M chart shows clear consolidation, forming a small bullish flag or pennant after the sharp recovery. The price is trading above the intraday FVG, which suggests a mild bullish bias for the short-term breakout.
Key Levels:
Intraday Supply: 54,750. This is the high of the recent consolidation and aligns with the major resistance.
Intraday Demand: 54,350. The immediate support level that must be defended.
Outlook: Neutral-to-Bullish for the session open, focused on a break of the tight consolidation.
Trade Plan (Tuesday, 30th September)
Market Outlook: The Bank Nifty is at a major support level. The strategy should be reactive, focusing on a breakout from the tight consolidation, with a strong emphasis on the 54,750 resistance.
Bullish Scenario (Bounce/Reversal Plan)
Justification: The strong defense of the 54,250 macro support and the tight consolidation pattern suggest buyers are ready for a counter-trend move.
Entry: Long entry on a decisive break and 15-minute candle close above 54,750 (breaking the resistance/FVG zone).
Stop Loss (SL): Below 54,500.
Targets:
T1: 55,000 (Psychological resistance).
T2: 55,250 (Major Order Block/Supply).
Bearish Scenario (Continuation Plan)
Justification: The continuation of the strong bearish trend, with the breakdown of the major support.
Entry: Short entry on a decisive break and 15-minute candle close below 54,250.
Stop Loss (SL): Place a stop loss above 54,450.
Targets:
T1: 54,000 (Psychological support).
T2: 53,500 - 53,750 (Next major demand zone).
Key Levels for Observation:
Immediate Decision Point: The 54,350 - 54,750 zone.
Bearish Confirmation: A break and sustained move below 54,250.
Bullish Confirmation: A recapture of the 54,750 level.
Line in the Sand: 54,250. The overall bullish structure remains intact only if this level holds.
4-Hour Chart (Macro Trend)
Structure: The Bank Nifty is in an accelerated corrective phase, trading below a clear descending channel. The price broke major support but found powerful buying interest at the 54,250 - 54,350 zone. This area is a key Bullish Order Block (OB) and a strong horizontal support.
Key Levels:
Major Supply (Resistance): 54,750 - 54,850. This area is now the immediate and most critical resistance, aligning with the FVG (Fair Value Gap) and a prior broken support.
Major Demand (Support): 54,250 - 54,350. This is the key "line in the sand." A sustained break below 54,250 would signal a deeper correction toward 53,500.
Outlook: The trend is strongly bearish, but the fierce defense of 54,250 on Monday suggests a temporary bottom may be in place.
1-Hour Chart (Intermediate View)
Structure: The 1H chart is bearish, confined to a descending channel. The market made a sharp move down, followed by a strong recovery, printing a large wick that penetrated the 54,250 demand zone. The strong rejection of lower prices indicates heavy buying.
Key Levels:
Immediate Resistance: The upper boundary of the descending channel, currently near 54,700.
Immediate Support: 54,250.
15-Minute Chart (Intraday View)
Structure: The 15M chart shows clear consolidation, forming a small bullish flag or pennant after the sharp recovery. The price is trading above the intraday FVG, which suggests a mild bullish bias for the short-term breakout.
Key Levels:
Intraday Supply: 54,750. This is the high of the recent consolidation and aligns with the major resistance.
Intraday Demand: 54,350. The immediate support level that must be defended.
Outlook: Neutral-to-Bullish for the session open, focused on a break of the tight consolidation.
Trade Plan (Tuesday, 30th September)
Market Outlook: The Bank Nifty is at a major support level. The strategy should be reactive, focusing on a breakout from the tight consolidation, with a strong emphasis on the 54,750 resistance.
Bullish Scenario (Bounce/Reversal Plan)
Justification: The strong defense of the 54,250 macro support and the tight consolidation pattern suggest buyers are ready for a counter-trend move.
Entry: Long entry on a decisive break and 15-minute candle close above 54,750 (breaking the resistance/FVG zone).
Stop Loss (SL): Below 54,500.
Targets:
T1: 55,000 (Psychological resistance).
T2: 55,250 (Major Order Block/Supply).
Bearish Scenario (Continuation Plan)
Justification: The continuation of the strong bearish trend, with the breakdown of the major support.
Entry: Short entry on a decisive break and 15-minute candle close below 54,250.
Stop Loss (SL): Place a stop loss above 54,450.
Targets:
T1: 54,000 (Psychological support).
T2: 53,500 - 53,750 (Next major demand zone).
Key Levels for Observation:
Immediate Decision Point: The 54,350 - 54,750 zone.
Bearish Confirmation: A break and sustained move below 54,250.
Bullish Confirmation: A recapture of the 54,750 level.
Line in the Sand: 54,250. The overall bullish structure remains intact only if this level holds.
Wyłączenie odpowiedzialności
Informacje i publikacje nie stanowią i nie powinny być traktowane jako porady finansowe, inwestycyjne, tradingowe ani jakiekolwiek inne rekomendacje dostarczane lub zatwierdzone przez TradingView. Więcej informacji znajduje się w Warunkach użytkowania.
Wyłączenie odpowiedzialności
Informacje i publikacje nie stanowią i nie powinny być traktowane jako porady finansowe, inwestycyjne, tradingowe ani jakiekolwiek inne rekomendacje dostarczane lub zatwierdzone przez TradingView. Więcej informacji znajduje się w Warunkach użytkowania.