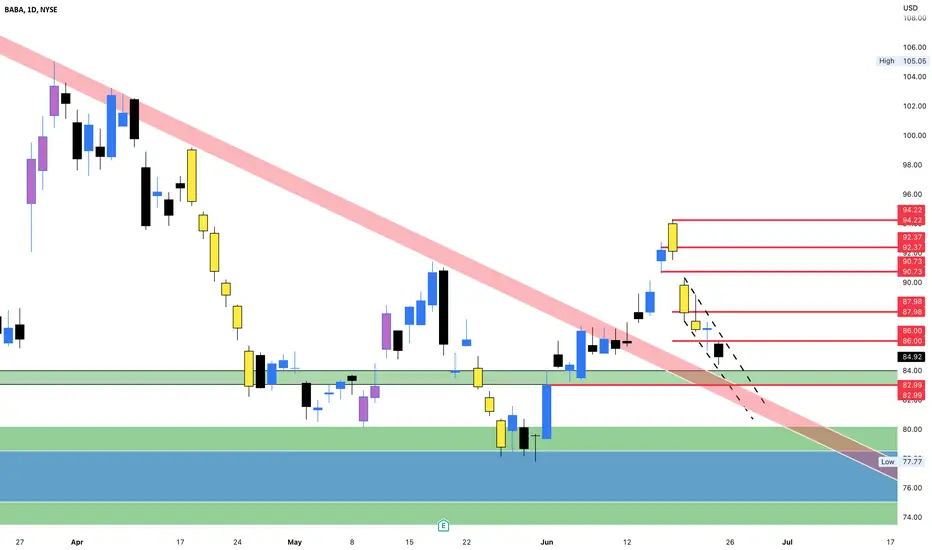
On Friday June 16th, BABA hit a daily supply area following a CHOCH on the daily as well as a breakout of a longterm down trend that began back on January 26th. BABA has since retraced into the fib golden zone (50%-61.8%). It is currently sitting on a support between 83.04 and 83.99. BABA’s price action on the daily also seems to be creating a smaller inverted head and shoulders pattern within the right shoulder of the larger head and shoulders forming on the weekly/monthly charts. Watch for price to hold this level at 83.04 and 83.99. Wait for the daily candles to start making a new high (above 86.00). Also note that the price of the previous 4 daily candles are trading within a descending channel. Drop to lower time frames (30m/1h/4h) to find a precise entry after the breakout of the descending channel and a structural change in price.
Targets: 87.98, 90.73, 92.37, 94.22
Stop: 82.98 or a break and hold below the current support between 83.04 and 83.99. ***** If price price does fail to hold watch for a retest of support turned resistance for an entry to the downside with targets of (78.10-78.83). OR watch for a reclaim of the broken support*****
Zlecenie aktywne
BABA is still holding the main support of interest but struggling. As long as it holds here and begin getting some bullish flow, watch for a move back above 86.00. For now? Sideways.Transakcja zamknięta: osiągnięto wyznaczony cel
TP 1 HIT! Next up ... 90.73Uwaga
BABA has hit TP 2, 3, and 4!Dennis Butler Jr.
Wyłączenie odpowiedzialności
Informacje i publikacje nie stanowią i nie powinny być traktowane jako porady finansowe, inwestycyjne, tradingowe ani jakiekolwiek inne rekomendacje dostarczane lub zatwierdzone przez TradingView. Więcej informacji znajduje się w Warunkach użytkowania.
Dennis Butler Jr.
Wyłączenie odpowiedzialności
Informacje i publikacje nie stanowią i nie powinny być traktowane jako porady finansowe, inwestycyjne, tradingowe ani jakiekolwiek inne rekomendacje dostarczane lub zatwierdzone przez TradingView. Więcej informacji znajduje się w Warunkach użytkowania.
