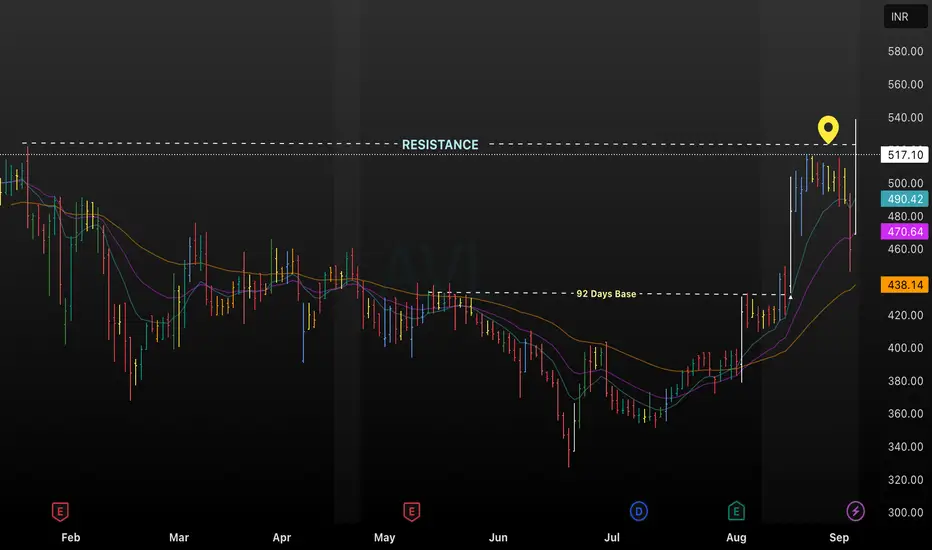
This AVL daily chart highlights a crucial resistance level near ₹540 after a robust 92-day base formation. The recent breakout above this resistance zone signals potential bullish strength, supported by moving averages (EMA 20, 50, 100, 200) currently trending upward above ₹438. A sharp price surge to ₹517 is visible, with strong momentum and historical base support, suggesting possible continuation if resistance sustains.
Use this structure to maximize engagement and provide clarity for community members or followers analyzing AVL’s price action.
Use this structure to maximize engagement and provide clarity for community members or followers analyzing AVL’s price action.
Wyłączenie odpowiedzialności
Informacje i publikacje nie stanowią i nie powinny być traktowane jako porady finansowe, inwestycyjne, tradingowe ani jakiekolwiek inne rekomendacje dostarczane lub zatwierdzone przez TradingView. Więcej informacji znajduje się w Warunkach użytkowania.
Wyłączenie odpowiedzialności
Informacje i publikacje nie stanowią i nie powinny być traktowane jako porady finansowe, inwestycyjne, tradingowe ani jakiekolwiek inne rekomendacje dostarczane lub zatwierdzone przez TradingView. Więcej informacji znajduje się w Warunkach użytkowania.