Bearish Symmetrical Triangle Breakdown with Strong Downside
AUD/USD 4H – Bearish Symmetrical Triangle Breakdown with Strong Downside Momentum
Detailed Description & Analysis:
Pair: AUD/USD (Australian Dollar vs US Dollar)
Timeframe: 4-hour chart
Key Technical Observations:
Overall Trend:
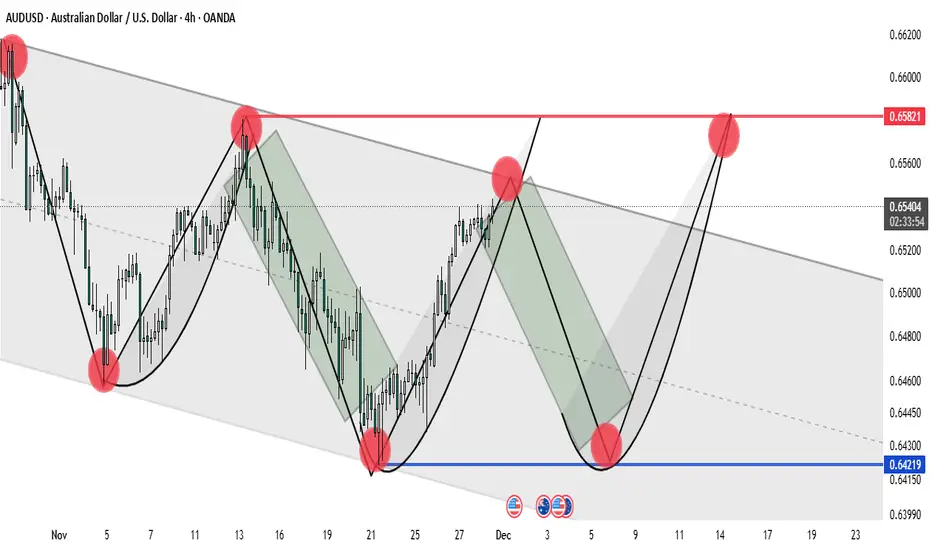
Strongly bearish. The pair has been in a clear downtrend since early November, making lower highs and lower lows.
Pattern:
A large symmetrical triangle (highlighted in green shading) formed between roughly 10–25 November.
Upper trendline: descending resistance connecting the highs around 0.6620 → 0.6582 → 0.6539
Lower trendline: ascending support connecting the swing lows
The triangle acted as a continuation pattern within the broader downtrend.
Breakdown:
Price broke decisively below the lower trendline of the triangle around 25–26 November with a strong bearish candle and increased volume (visible acceleration downward). This confirms the bearish resolution of the pattern.
Current Price Action (as of 28 Nov):
Trading at ~0.6422 (marked in blue) after a sharp drop from the 0.6582–0.6590 area.
Recent 4H candles show almost uninterrupted selling pressure with very little retracement.
Key Levels:
Immediate resistance: Former triangle support (now resistance) around 0.6480–0.6500
Major horizontal resistance: 0.6582 (multiple prior highs)
Next major support: Psychological 0.6400, then 0.6350–0.6330 zone (2023–2024 lows)
Measured Move Target (from triangle):
Height of the triangle at its widest point ≈ 350–400 pips.
Subtracting from the breakdown point (~0.6520) gives a textbook target around 0.6120–0.6170 longer-term.
Momentum & Sentiment:
Extremely bearish. No meaningful bullish divergence or reversal candles yet. Risk of further capitulation toward multi-year lows if 0.6400 gives way.
Detailed Description & Analysis:
Pair: AUD/USD (Australian Dollar vs US Dollar)
Timeframe: 4-hour chart
Key Technical Observations:
Overall Trend:
Strongly bearish. The pair has been in a clear downtrend since early November, making lower highs and lower lows.
Pattern:
A large symmetrical triangle (highlighted in green shading) formed between roughly 10–25 November.
Upper trendline: descending resistance connecting the highs around 0.6620 → 0.6582 → 0.6539
Lower trendline: ascending support connecting the swing lows
The triangle acted as a continuation pattern within the broader downtrend.
Breakdown:
Price broke decisively below the lower trendline of the triangle around 25–26 November with a strong bearish candle and increased volume (visible acceleration downward). This confirms the bearish resolution of the pattern.
Current Price Action (as of 28 Nov):
Trading at ~0.6422 (marked in blue) after a sharp drop from the 0.6582–0.6590 area.
Recent 4H candles show almost uninterrupted selling pressure with very little retracement.
Key Levels:
Immediate resistance: Former triangle support (now resistance) around 0.6480–0.6500
Major horizontal resistance: 0.6582 (multiple prior highs)
Next major support: Psychological 0.6400, then 0.6350–0.6330 zone (2023–2024 lows)
Measured Move Target (from triangle):
Height of the triangle at its widest point ≈ 350–400 pips.
Subtracting from the breakdown point (~0.6520) gives a textbook target around 0.6120–0.6170 longer-term.
Momentum & Sentiment:
Extremely bearish. No meaningful bullish divergence or reversal candles yet. Risk of further capitulation toward multi-year lows if 0.6400 gives way.
Zlecenie aktywne
⚜️Free VIP Signals
t.me/Forexfrontierfx
⚜️Daily Market Mapping
t.me/Forexfrontierfx
⚜️Join My Refferel Broker
one.exnessonelink.com/a/uvd1etcgg1
Refferal Code -
uvd1etcgg1
t.me/Forexfrontierfx
⚜️Daily Market Mapping
t.me/Forexfrontierfx
⚜️Join My Refferel Broker
one.exnessonelink.com/a/uvd1etcgg1
Refferal Code -
uvd1etcgg1
Powiązane publikacje
Wyłączenie odpowiedzialności
Informacje i publikacje nie stanowią i nie powinny być traktowane jako porady finansowe, inwestycyjne, tradingowe ani jakiekolwiek inne rekomendacje dostarczane lub zatwierdzone przez TradingView. Więcej informacji znajduje się w Warunkach użytkowania.