Please LIKE or FOLLOW if you like this idea.
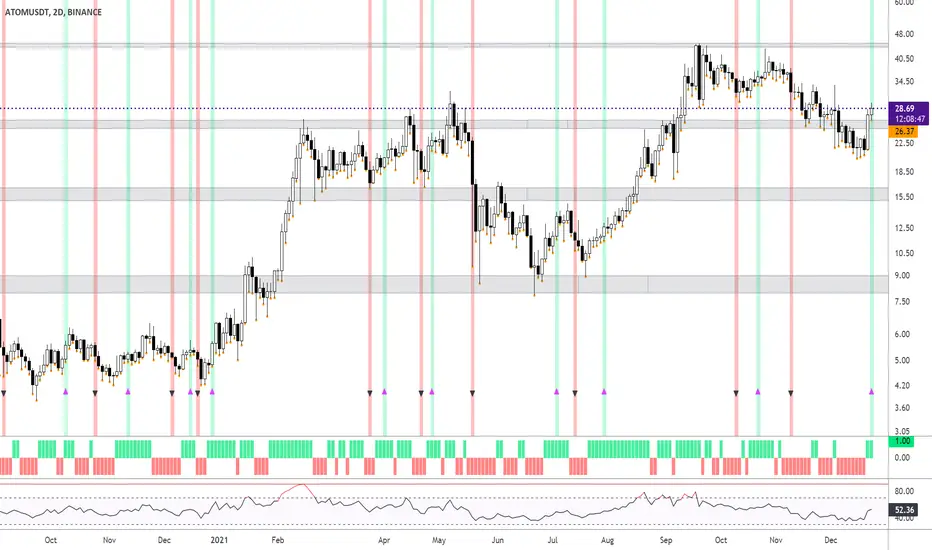
RSI is above 50, which indicates a possible upmarket. The Heikin Ashi indicator is also showing green blocks (indicator below). Which also confirms we're most likely looking at a possible uptrend.
In the chart I am using the Supertrend Ninja indicator, which is a trend-following indicator (Green and red vertical line with arrows).
When the background of the candlestick closes green (vertical line) with an upwards pointing pink arrow. It indicates a possible bullish (up)trend.
The Supertrend Ninja indicator is forming its 7th bullish signal in 2021.
Supports and resistances are displayed in grey. With price finding support.
With each trade proper risk management is essential. Either by using my script Trailing Stoploss Bottom Activation indicator, visible as orange dots below the candles. Which sends an alert, when current price goes below the previous candle low. Or using my Heikin Ashi Trailing Stoploss Activation, the indicator below with green and red blocks. Or third option, exit when the Supertrend Ninja indicator displays a vertical red line with a downwards pointing black arrow. Remember, the first stop(loss) is always the cheapest stop.
Thank you for reading.
Namasté
Disclaimer: Ideas are for entertainment purposes only. Not financial advice. Your own due diligence is highly advised before entering trades. Past performance is no guarantee of future returns.
Beware of scammers. I do NOT have Telegram, Discord, Instagram, Twitter, Youtube or Facebook.
Tradingview is the only channel I use.
Tradingview is the only channel I use.
Wyłączenie odpowiedzialności
Informacje i publikacje nie stanowią i nie powinny być traktowane jako porady finansowe, inwestycyjne, tradingowe ani jakiekolwiek inne rekomendacje dostarczane lub zatwierdzone przez TradingView. Więcej informacji znajduje się w Warunkach użytkowania.