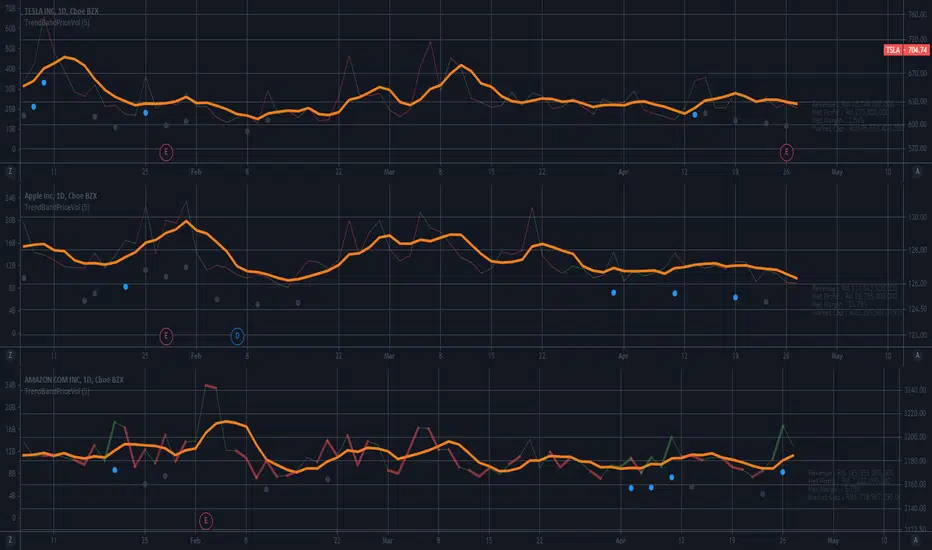
Orange line: Weekly Average trading value.
Green-Red line: Daily Average trading value.
Daily Price Volume(Trading Value) vs Volume!
Volume is the number of shares of security traded during a given period.
Generally, securities with more daily volume are more liquid than those without, since they are more "active".
Volume is an important indicator in technical analysis because it is used to measure the relative significance of a market move.
The higher the volume during a price move, the more significant the move, and the lower the volume during a price move, the less significant the move.
If you multiply the volume by the price of equity then you will have the Dollar value of daily trades! (daily volume * closing price= daily trading value)
In 2021, Tesla has had the highest daily trading value among all the securities, Apple has had the second rank, and Amazon was ranked 3rd.
Looking at the volume price trend will reveal what you cant see easily!
Tesla:
The weekly average trading value decreased from 46 billion/day to less than 23 billion/day.
Apple:
The weekly average trading value decreased from 23 billion/day to less than 10 billion/day.
Amazon:
The weekly average trading value decreased from 17 billion/day to less than 9 billion/day.
As you see, money constantly gets out of market leaders, and the price of equities drops constantly! and it is not limited to these big names! you can see it everywhere, even in meme stocks!
The story for Amazon is somehow different, in the last 2 days, Amazon's daily trading value increased and passed its weekly average trading value;
and passed Apple and ranked as the second in terms of the value of daily trading. Keep it in your mind although the trading value increased +25% this week, it is 36% lower than the average trading value in the first 2 weeks of February 2021.
This could be related to stock split news which could give Amazon a boost.
In conclusion, Money Influx leads to higher prices, Money outflux leads to lower prices!
Use the following link to access trading ideas: patreon.com/SniperTraderStocks?utm_medium=unknown&utm_source=join_link&utm_campaign=creatorshare_creator&utm_content=copyLink
Wyłączenie odpowiedzialności
Informacje i publikacje przygotowane przez TradingView lub jego użytkowników, prezentowane na tej stronie, nie stanowią rekomendacji ani porad handlowych, inwestycyjnych i finansowych i nie powinny być w ten sposób traktowane ani wykorzystywane. Więcej informacji na ten temat znajdziesz w naszym Regulaminie.