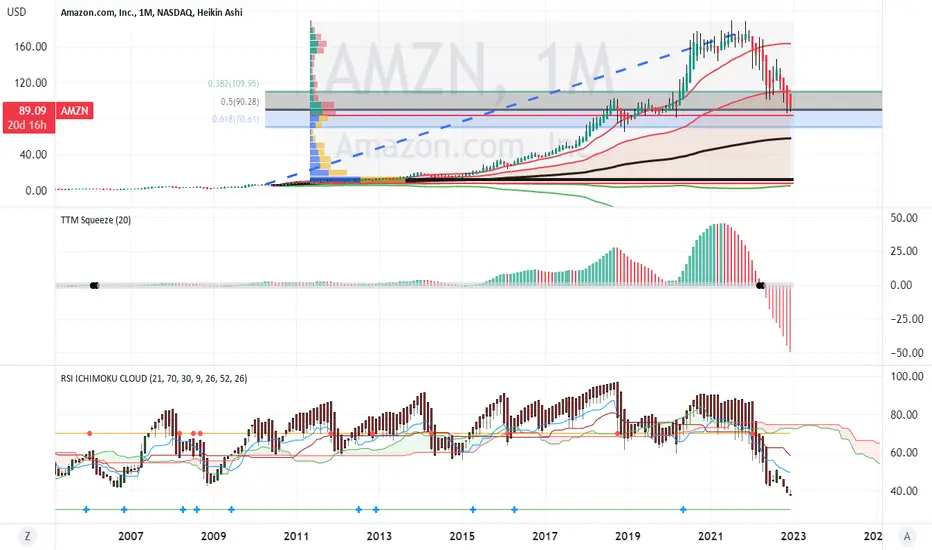
Om a monthly chart from Amazon's beginning to the present.
Amazon was in a sustained uptrend peaking in the summer of 2021.
Since then it has retraced down to the Fib 0.5 level. Price
was more than two standard deviations above the long term
anchored VWAP and is now downtrending into a value area.
The volume profile shows three high volume nodes and price
is currently in the middle node, Finally, the volatility on the
RSI indicator has decreased as had the strength itself.
AMZN is likely setting up for a reversal. Now, is a good time
to buy stock or a long term call option. This is a long idea
for investors not traders.
Wyłączenie odpowiedzialności
Informacje i publikacje przygotowane przez TradingView lub jego użytkowników, prezentowane na tej stronie, nie stanowią rekomendacji ani porad handlowych, inwestycyjnych i finansowych i nie powinny być w ten sposób traktowane ani wykorzystywane. Więcej informacji na ten temat znajdziesz w naszym Regulaminie.