The weekly chart of bitcoin is going to close in the next few hours from I write this post. However, current form is now enough to anticipate the weekly close as well. Now, I want to cover the analysis on this time basis and explain some important levels that could give the significant factor for bitcoin's movement in the future.
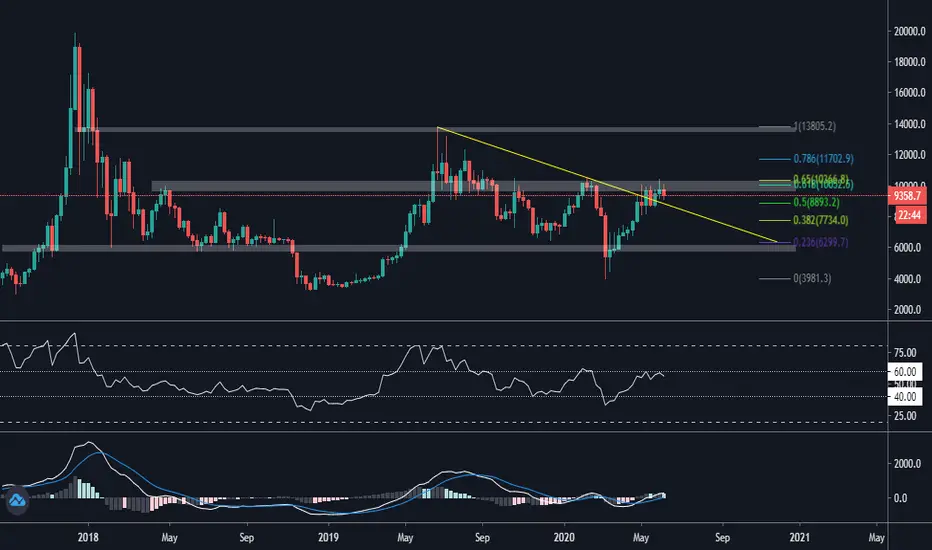
Looking at the chart, it's clear that the price is now trending above the yellow resistance trend line as the exactly 1 year resistance trend line. There could be 2 potential future movement in current rate. The first potential factor to occur is that current movement is the bulls trap which traps the most of the long position and we'll see it comes back to the area below the yellow resistance trend line. The 2nd probability is that this is the real break out from the yellow trend line and we have to wait more patient to confirms the up trend moves.
We can't deny that currently the price is still trending slightly under the strong resistance. This resistance includes so many factors in it. There were a crucial zone on previous price action, Psychological number of $10000 and the Golden pocket zone as resistance. That's why current price action which is going back and forth between $10000 - $9000 is very ideal knowing the resistance that the price faces is a very very very strong. But, look at the other side when the price is able to breaks this resistance, we'll see a fantastic movement to the upside and this could be the beginning of the new rally to breaks the ATH. Next resistance if we can breaks this region is the $13000.
Powiązane publikacje
Wyłączenie odpowiedzialności
Informacje i publikacje przygotowane przez TradingView lub jego użytkowników, prezentowane na tej stronie, nie stanowią rekomendacji ani porad handlowych, inwestycyjnych i finansowych i nie powinny być w ten sposób traktowane ani wykorzystywane. Więcej informacji na ten temat znajdziesz w naszym Regulaminie.