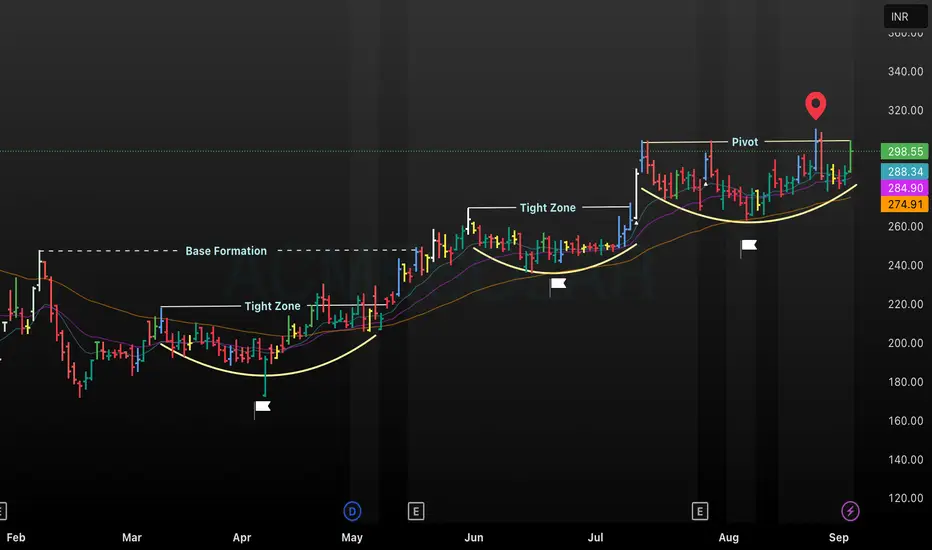
This chart of ACME shows price action over several months, highlighting key technical levels and zones. A clear base formation is established early, followed by successive tight zones indicating consolidation phases, which often precede breakouts. The pivot level mark signals a critical resistance point, with price action approaching and ultimately breaking out above it. Multiple moving averages are shown for trend context, and all major formations are annotated for quick identification, supporting both educational and trading analysis.
Wyłączenie odpowiedzialności
Informacje i publikacje przygotowane przez TradingView lub jego użytkowników, prezentowane na tej stronie, nie stanowią rekomendacji ani porad handlowych, inwestycyjnych i finansowych i nie powinny być w ten sposób traktowane ani wykorzystywane. Więcej informacji na ten temat znajdziesz w naszym Regulaminie.