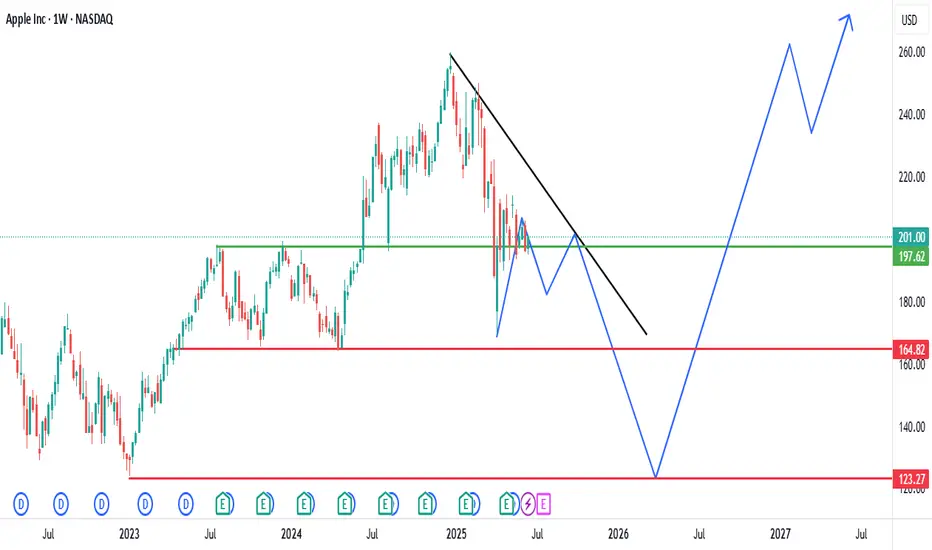
Historical Trend: The chart shows Apple Inc.'s stock price on a weekly timeframe from 2022 to mid-2025. The stock exhibited a strong upward trend from 2022 to early 2025, with notable growth followed by periods of consolidation and correction.
Key Levels:
Resistance: The $201.00-$197.62 range (green line) has acted as a significant resistance level. The price recently broke above this zone, suggesting potential bullish momentum.
Support: The $164.82 level (red line) has served as a major support zone. The stock tested this level during a recent decline and rebounded, indicating its strength.
Recent Price Action: After reaching a peak near $201.00, the stock entered a descending triangle pattern (black trendline). A breakout above the resistance at $201.00 is evident, accompanied by an upward projection (blue arrow), hinting at a possible continuation of the bullish trend.
Projected Movement: The upward projection suggests the stock could target levels around $240.00-$260.00 if the breakout holds. However, a failure to maintain above $201.00 might lead to a retest of the $164.82 support.
Volume and Indicators: The chart includes Bollinger Bands (O197.30 H201.70 L195.07 C201.00) with a -4.55 (-2.22%) change, indicating recent volatility. Specific volume data is not detailed, but the breakout suggests increasing buying pressure.
Outlook: The stock is currently in a bullish phase following the breakout above $201.00.
Maintaining above this level could drive further gains, while a drop below might signal a return to the $164.82 support. Close monitoring of price action around these levels is recommended.
Wyłączenie odpowiedzialności
Informacje i publikacje przygotowane przez TradingView lub jego użytkowników, prezentowane na tej stronie, nie stanowią rekomendacji ani porad handlowych, inwestycyjnych i finansowych i nie powinny być w ten sposób traktowane ani wykorzystywane. Więcej informacji na ten temat znajdziesz w naszym Regulaminie.