Apple Shares (AAPL) Fall After iPhone 17 Launch
Yesterday, Apple unveiled its new products, including the iPhone 17. The new model features a sleeker form factor, an improved display and battery, and a new processor. However, analysts believe the model lacks the breakthrough impact needed to drive the stock higher.
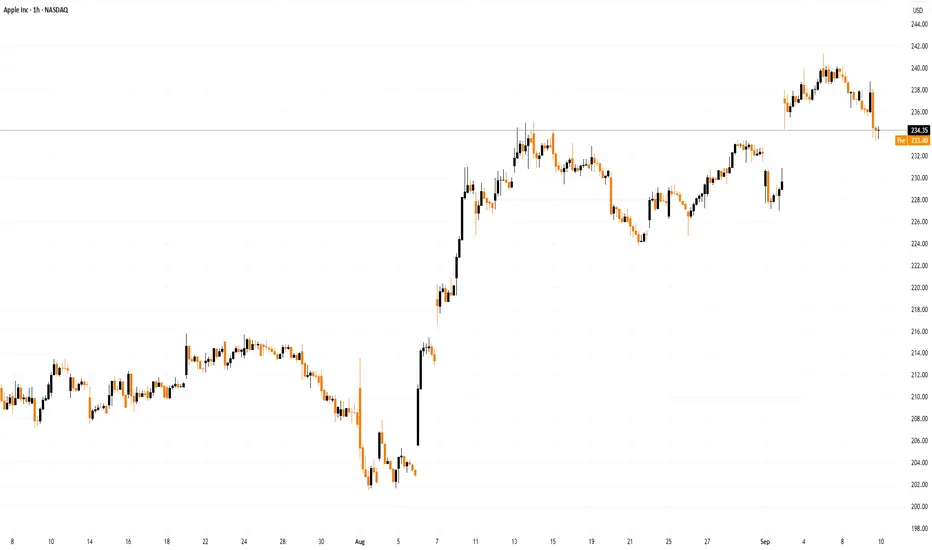
The charts confirm this: while the main stock indices rose yesterday, AAPL shares fell by around 1.5%.

Technical Analysis of Apple Shares (AAPL)
When analysing the chart six days ago, we:
→ confirmed the upward channel (shown in blue);
→ highlighted the $235 support level;
→ suggested that while AAPL stock could maintain upward momentum, disappointment over the new product launch might trigger a correction.
In addition to the AAPL price action we noted earlier, several bearish signals on the hourly chart support the correction scenario:
→ a long upper shadow (marked with an arrow);
→ aggressive price action when breaking the $235 support;
→ bearish divergences on the RSI indicator.
Bulls might find support at line S, which is part of a fan drawn from the starting point of the bullish impulse on 6 August.
However, if bearish sentiment persists, price action could unfold within the structure shown in red (potentially a bull flag pattern inside the prevailing bullish trend). Bearish pressure could aim to push AAPL shares down towards the median of the red channel.
In that case, bulls may find support in the area where several lines converge:
→ the lower rays of the fan (shown in orange);
→ the psychological $230 level (which has repeatedly switched roles between resistance and support since August);
→ the median of the blue channel;
→ the lower boundary of the bullish gap from 2 September.
This article represents the opinion of the Companies operating under the FXOpen brand only. It is not to be construed as an offer, solicitation, or recommendation with respect to products and services provided by the Companies operating under the FXOpen brand, nor is it to be considered financial advice.
Yesterday, Apple unveiled its new products, including the iPhone 17. The new model features a sleeker form factor, an improved display and battery, and a new processor. However, analysts believe the model lacks the breakthrough impact needed to drive the stock higher.
The charts confirm this: while the main stock indices rose yesterday, AAPL shares fell by around 1.5%.
Technical Analysis of Apple Shares (AAPL)
When analysing the chart six days ago, we:
→ confirmed the upward channel (shown in blue);
→ highlighted the $235 support level;
→ suggested that while AAPL stock could maintain upward momentum, disappointment over the new product launch might trigger a correction.
In addition to the AAPL price action we noted earlier, several bearish signals on the hourly chart support the correction scenario:
→ a long upper shadow (marked with an arrow);
→ aggressive price action when breaking the $235 support;
→ bearish divergences on the RSI indicator.
Bulls might find support at line S, which is part of a fan drawn from the starting point of the bullish impulse on 6 August.
However, if bearish sentiment persists, price action could unfold within the structure shown in red (potentially a bull flag pattern inside the prevailing bullish trend). Bearish pressure could aim to push AAPL shares down towards the median of the red channel.
In that case, bulls may find support in the area where several lines converge:
→ the lower rays of the fan (shown in orange);
→ the psychological $230 level (which has repeatedly switched roles between resistance and support since August);
→ the median of the blue channel;
→ the lower boundary of the bullish gap from 2 September.
This article represents the opinion of the Companies operating under the FXOpen brand only. It is not to be construed as an offer, solicitation, or recommendation with respect to products and services provided by the Companies operating under the FXOpen brand, nor is it to be considered financial advice.
Wyłączenie odpowiedzialności
Informacje i publikacje nie stanowią i nie powinny być traktowane jako porady finansowe, inwestycyjne, tradingowe ani jakiekolwiek inne rekomendacje dostarczane lub zatwierdzone przez TradingView. Więcej informacji znajduje się w Warunkach użytkowania.
Wyłączenie odpowiedzialności
Informacje i publikacje nie stanowią i nie powinny być traktowane jako porady finansowe, inwestycyjne, tradingowe ani jakiekolwiek inne rekomendacje dostarczane lub zatwierdzone przez TradingView. Więcej informacji znajduje się w Warunkach użytkowania.