Analysis:
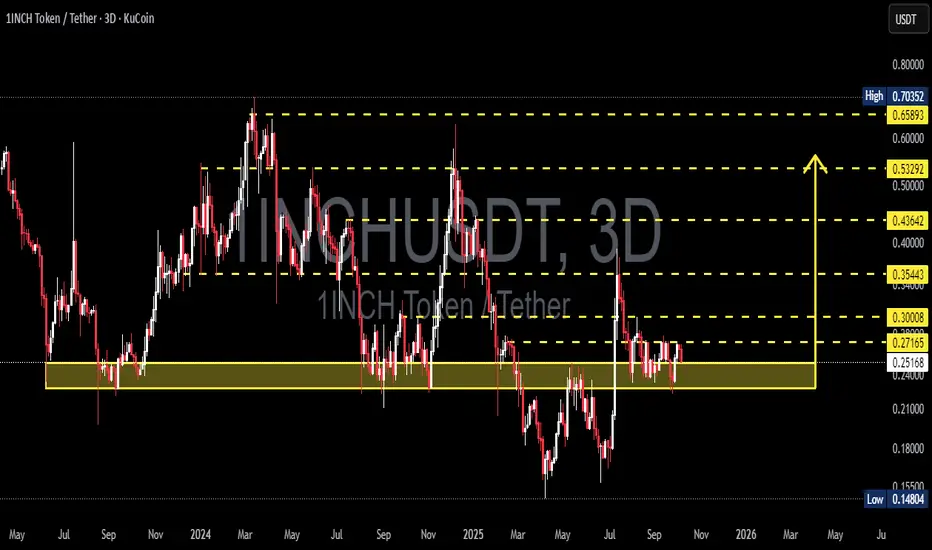
The 3-day chart shows 1INCH consolidating tightly within the 0.23–0.25 demand zone, an area that has acted as a critical base since mid-2024.
Every touch of this zone has triggered a strong bullish reaction, proving it’s a key defense area for buyers. However, repeated retests also weaken its strength — making this retest a make-or-break moment for the mid-term trend.
Price is currently moving sideways with declining volatility, suggesting the market is in a final consolidation phase before a major directional move.
This zone will decide whether we see a strong reversal rally or a structural breakdown into new lows.
---
Key Technical Structure
Demand Zone (Major Support): 0.23 – 0.25
Nearest Resistance: 0.27 – 0.30
Higher Resistances: 0.354 → 0.436 → 0.533 → 0.659
Major Support Below: 0.148
---
Price Structure & Pattern
1INCH has been forming a broad horizontal range with multiple retests at 0.23–0.25, signaling potential base accumulation.
However, the macro structure still shows a series of lower highs, keeping the overall trend bearish-to-neutral until a confirmed breakout occurs.
Long downside wicks around 0.23 indicate liquidity sweeps — a common sign of institutional accumulation before a major move.
---
Bullish Scenario
Confirmation:
A strong 3D candle close above 0.30 — confirming breakout from the range.
Implication:
Marks the end of accumulation and the beginning of a potential mid-term reversal structure.
Upside Targets:
TP1 → 0.354 (mid-range top)
TP2 → 0.436 (major supply)
TP3 → 0.533 (trend reversal confirmation)
TP4 → 0.659–0.703 (extended target)
Entry Strategy:
Conservative: wait for a 3D close above 0.30 and enter on retest.
Aggressive: enter near 0.23–0.25 upon bullish rejection, with a tight stop below 0.23.
Stop Loss: below 0.23 (breakdown invalidates setup).
---
Bearish Scenario
Confirmation:
A 3D close below 0.23 confirms structural breakdown from the base range.
Implication:
Signals a shift from accumulation to redistribution, resuming the broader downtrend.
Downside Targets:
0.20 → 0.18 (intermediate)
0.15 (major psychological and technical support)
Strategy:
Look for bearish rejection around 0.27–0.30 for short setups, or enter breakdown continuation trades below 0.23 with confirmation.
---
Conclusion
The 0.23–0.25 zone stands as the final equilibrium point between buyers and sellers — the golden demand zone that will dictate 1INCH’s next major trend.
A confirmed breakout above 0.30 could trigger a strong reversal toward 0.53–0.70, while a breakdown below 0.23 opens the door for a drop toward 0.15.
The market is silent — and this calmness often precedes a massive move.
---
#1INCH #CryptoAnalysis #TechnicalAnalysis #Altcoin #Breakout #PriceAction #CryptoTrading #SwingTrade #SupportResistance #MarketStructure #ReversalZone #CryptoMarket #ChartAnalysis
✅ Get Free Signals! Join Our Telegram Channel Here: t.me/TheCryptoNuclear
✅ Twitter: twitter.com/crypto_nuclear
✅ Join Bybit : partner.bybit.com/b/nuclearvip
✅ Benefits : Lifetime Trading Fee Discount -50%
✅ Twitter: twitter.com/crypto_nuclear
✅ Join Bybit : partner.bybit.com/b/nuclearvip
✅ Benefits : Lifetime Trading Fee Discount -50%
Wyłączenie odpowiedzialności
Informacje i publikacje przygotowane przez TradingView lub jego użytkowników, prezentowane na tej stronie, nie stanowią rekomendacji ani porad handlowych, inwestycyjnych i finansowych i nie powinny być w ten sposób traktowane ani wykorzystywane. Więcej informacji na ten temat znajdziesz w naszym Regulaminie.