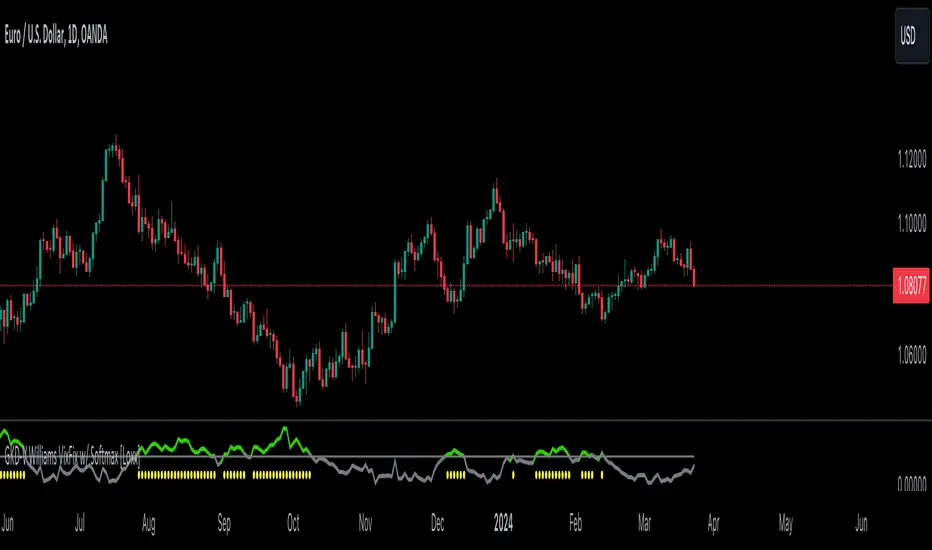
GKD-V Williams VixFix w/ Softmax [Loxx]The Giga Kaleidoscope GKD-V Williams VixFix w/ Softmax is a Volume/Volatility module included in Loxx's "Giga Kaleidoscope Modularized Trading System."
█ GKD-V Williams VixFix w/ Softmax
The Williams' Vix Fix indicator, a creation aimed at replicating the VIX (Volatility Index) for any asset, marks a significant advancement in volatility measurement, particularly for markets or instruments lacking options data. This indicator is designed to identify periods of extreme market stress or potential reversal points by measuring the distance between the highest past prices and current lows, reflecting panic or fear levels akin to those captured by the traditional VIX for the S&P 500. Enhanced with options for softmax normalization and a threshold-based signaling mechanism, the Vix Fix becomes a highly adaptable tool. Softmax normalization introduces a sophisticated method to normalize volatility signals, improving their interpretability and responsiveness to market changes. The threshold level option, on the other hand, provides a simpler, yet effective way to generate signals based on predefined volatility levels. This innovative approach to volatility analysis enables traders and analysts to leverage a more nuanced understanding of market dynamics, tailoring the indicator to their specific needs and strategies for navigating complex financial landscapes.
█ Giga Kaleidoscope Modularized Trading System
Core components of an NNFX algorithmic trading strategy
The NNFX algorithm is built on the principles of trend, momentum, and volatility. There are six core components in the NNFX trading algorithm:
1. Volatility - price volatility; e.g., Average True Range, True Range Double, Close-to-Close, etc.
2. Baseline - a moving average to identify price trend
3. Confirmation 1 - a technical indicator used to identify trends
4. Confirmation 2 - a technical indicator used to identify trends
5. Continuation - a technical indicator used to identify trends
6. Volatility/Volume - a technical indicator used to identify volatility/volume breakouts/breakdown
7. Exit - a technical indicator used to determine when a trend is exhausted
8. Metamorphosis - a technical indicator that produces a compound signal from the combination of other GKD indicators*
*(not part of the NNFX algorithm)
What is Volatility in the NNFX trading system?
In the NNFX (No Nonsense Forex) trading system, ATR (Average True Range) is typically used to measure the volatility of an asset. It is used as a part of the system to help determine the appropriate stop loss and take profit levels for a trade. ATR is calculated by taking the average of the true range values over a specified period.
True range is calculated as the maximum of the following values:
-Current high minus the current low
-Absolute value of the current high minus the previous close
-Absolute value of the current low minus the previous close
ATR is a dynamic indicator that changes with changes in volatility. As volatility increases, the value of ATR increases, and as volatility decreases, the value of ATR decreases. By using ATR in NNFX system, traders can adjust their stop loss and take profit levels according to the volatility of the asset being traded. This helps to ensure that the trade is given enough room to move, while also minimizing potential losses.
Other types of volatility include True Range Double (TRD), Close-to-Close, and Garman-Klass
What is a Baseline indicator?
The baseline is essentially a moving average, and is used to determine the overall direction of the market.
The baseline in the NNFX system is used to filter out trades that are not in line with the long-term trend of the market. The baseline is plotted on the chart along with other indicators, such as the Moving Average (MA), the Relative Strength Index (RSI), and the Average True Range (ATR).
Trades are only taken when the price is in the same direction as the baseline. For example, if the baseline is sloping upwards, only long trades are taken, and if the baseline is sloping downwards, only short trades are taken. This approach helps to ensure that trades are in line with the overall trend of the market, and reduces the risk of entering trades that are likely to fail.
By using a baseline in the NNFX system, traders can have a clear reference point for determining the overall trend of the market, and can make more informed trading decisions. The baseline helps to filter out noise and false signals, and ensures that trades are taken in the direction of the long-term trend.
What is a Confirmation indicator?
Confirmation indicators are technical indicators that are used to confirm the signals generated by primary indicators. Primary indicators are the core indicators used in the NNFX system, such as the Average True Range (ATR), the Moving Average (MA), and the Relative Strength Index (RSI).
The purpose of the confirmation indicators is to reduce false signals and improve the accuracy of the trading system. They are designed to confirm the signals generated by the primary indicators by providing additional information about the strength and direction of the trend.
Some examples of confirmation indicators that may be used in the NNFX system include the Bollinger Bands, the MACD (Moving Average Convergence Divergence), and the MACD Oscillator. These indicators can provide information about the volatility, momentum, and trend strength of the market, and can be used to confirm the signals generated by the primary indicators.
In the NNFX system, confirmation indicators are used in combination with primary indicators and other filters to create a trading system that is robust and reliable. By using multiple indicators to confirm trading signals, the system aims to reduce the risk of false signals and improve the overall profitability of the trades.
What is a Continuation indicator?
In the NNFX (No Nonsense Forex) trading system, a continuation indicator is a technical indicator that is used to confirm a current trend and predict that the trend is likely to continue in the same direction. A continuation indicator is typically used in conjunction with other indicators in the system, such as a baseline indicator, to provide a comprehensive trading strategy.
What is a Volatility/Volume indicator?
Volume indicators, such as the On Balance Volume (OBV), the Chaikin Money Flow (CMF), or the Volume Price Trend (VPT), are used to measure the amount of buying and selling activity in a market. They are based on the trading volume of the market, and can provide information about the strength of the trend. In the NNFX system, volume indicators are used to confirm trading signals generated by the Moving Average and the Relative Strength Index. Volatility indicators include Average Direction Index, Waddah Attar, and Volatility Ratio. In the NNFX trading system, volatility is a proxy for volume and vice versa.
By using volume indicators as confirmation tools, the NNFX trading system aims to reduce the risk of false signals and improve the overall profitability of trades. These indicators can provide additional information about the market that is not captured by the primary indicators, and can help traders to make more informed trading decisions. In addition, volume indicators can be used to identify potential changes in market trends and to confirm the strength of price movements.
What is an Exit indicator?
The exit indicator is used in conjunction with other indicators in the system, such as the Moving Average (MA), the Relative Strength Index (RSI), and the Average True Range (ATR), to provide a comprehensive trading strategy.
The exit indicator in the NNFX system can be any technical indicator that is deemed effective at identifying optimal exit points. Examples of exit indicators that are commonly used include the Parabolic SAR, and the Average Directional Index (ADX).
The purpose of the exit indicator is to identify when a trend is likely to reverse or when the market conditions have changed, signaling the need to exit a trade. By using an exit indicator, traders can manage their risk and prevent significant losses.
In the NNFX system, the exit indicator is used in conjunction with a stop loss and a take profit order to maximize profits and minimize losses. The stop loss order is used to limit the amount of loss that can be incurred if the trade goes against the trader, while the take profit order is used to lock in profits when the trade is moving in the trader's favor.
Overall, the use of an exit indicator in the NNFX trading system is an important component of a comprehensive trading strategy. It allows traders to manage their risk effectively and improve the profitability of their trades by exiting at the right time.
What is an Metamorphosis indicator?
The concept of a metamorphosis indicator involves the integration of two or more GKD indicators to generate a compound signal. This is achieved by evaluating the accuracy of each indicator and selecting the signal from the indicator with the highest accuracy. As an illustration, let's consider a scenario where we calculate the accuracy of 10 indicators and choose the signal from the indicator that demonstrates the highest accuracy.
The resulting output from the metamorphosis indicator can then be utilized in a GKD-BT backtest by occupying a slot that aligns with the purpose of the metamorphosis indicator. The slot can be a GKD-B, GKD-C, or GKD-E slot, depending on the specific requirements and objectives of the indicator. This allows for seamless integration and utilization of the compound signal within the GKD-BT framework.
How does Loxx's GKD (Giga Kaleidoscope Modularized Trading System) implement the NNFX algorithm outlined above?
Loxx's GKD v2.0 system has five types of modules (indicators/strategies). These modules are:
1. GKD-BT - Backtesting module (Volatility, Number 1 in the NNFX algorithm)
2. GKD-B - Baseline module (Baseline and Volatility/Volume, Numbers 1 and 2 in the NNFX algorithm)
3. GKD-C - Confirmation 1/2 and Continuation module (Confirmation 1/2 and Continuation, Numbers 3, 4, and 5 in the NNFX algorithm)
4. GKD-V - Volatility/Volume module (Confirmation 1/2, Number 6 in the NNFX algorithm)
5. GKD-E - Exit module (Exit, Number 7 in the NNFX algorithm)
6. GKD-M - Metamorphosis module (Metamorphosis, Number 8 in the NNFX algorithm, but not part of the NNFX algorithm)
(additional module types will added in future releases)
Each module interacts with every module by passing data to A backtest module wherein the various components of the GKD system are combined to create a trading signal.
That is, the Baseline indicator passes its data to Volatility/Volume. The Volatility/Volume indicator passes its values to the Confirmation 1 indicator. The Confirmation 1 indicator passes its values to the Confirmation 2 indicator. The Confirmation 2 indicator passes its values to the Continuation indicator. The Continuation indicator passes its values to the Exit indicator, and finally, the Exit indicator passes its values to the Backtest strategy.
This chaining of indicators requires that each module conform to Loxx's GKD protocol, therefore allowing for the testing of every possible combination of technical indicators that make up the six components of the NNFX algorithm.
What does the application of the GKD trading system look like?
Example trading system:
Backtest: Multi-Ticker CC Backtest
Baseline: Hull Moving Average
Volatility/Volume: Hurst Exponent
Confirmation 1: Advance Trend Pressure as shown on the chart above
Confirmation 2: uf2018
Continuation: Coppock Curve
Exit: Rex Oscillator
Metamorphosis: Baseline Optimizer
Each GKD indicator is denoted with a module identifier of either: GKD-BT, GKD-B, GKD-C, GKD-V, GKD-M, or GKD-E. This allows traders to understand to which module each indicator belongs and where each indicator fits into the GKD system.
█ Giga Kaleidoscope Modularized Trading System Signals
Standard Entry
1. GKD-C Confirmation gives signal
2. Baseline agrees
3. Price inside Goldie Locks Zone Minimum
4. Price inside Goldie Locks Zone Maximum
5. Confirmation 2 agrees
6. Volatility/Volume agrees
1-Candle Standard Entry
1a. GKD-C Confirmation gives signal
2a. Baseline agrees
3a. Price inside Goldie Locks Zone Minimum
4a. Price inside Goldie Locks Zone Maximum
Next Candle
1b. Price retraced
2b. Baseline agrees
3b. Confirmation 1 agrees
4b. Confirmation 2 agrees
5b. Volatility/Volume agrees
Baseline Entry
1. GKD-B Baseline gives signal
2. Confirmation 1 agrees
3. Price inside Goldie Locks Zone Minimum
4. Price inside Goldie Locks Zone Maximum
5. Confirmation 2 agrees
6. Volatility/Volume agrees
7. Confirmation 1 signal was less than 'Maximum Allowable PSBC Bars Back' prior
1-Candle Baseline Entry
1a. GKD-B Baseline gives signal
2a. Confirmation 1 agrees
3a. Price inside Goldie Locks Zone Minimum
4a. Price inside Goldie Locks Zone Maximum
5a. Confirmation 1 signal was less than 'Maximum Allowable PSBC Bars Back' prior
Next Candle
1b. Price retraced
2b. Baseline agrees
3b. Confirmation 1 agrees
4b. Confirmation 2 agrees
5b. Volatility/Volume agrees
Volatility/Volume Entry
1. GKD-V Volatility/Volume gives signal
2. Confirmation 1 agrees
3. Price inside Goldie Locks Zone Minimum
4. Price inside Goldie Locks Zone Maximum
5. Confirmation 2 agrees
6. Baseline agrees
7. Confirmation 1 signal was less than 7 candles prior
1-Candle Volatility/Volume Entry
1a. GKD-V Volatility/Volume gives signal
2a. Confirmation 1 agrees
3a. Price inside Goldie Locks Zone Minimum
4a. Price inside Goldie Locks Zone Maximum
5a. Confirmation 1 signal was less than 'Maximum Allowable PSVVC Bars Back' prior
Next Candle
1b. Price retraced
2b. Volatility/Volume agrees
3b. Confirmation 1 agrees
4b. Confirmation 2 agrees
5b. Baseline agrees
Confirmation 2 Entry
1. GKD-C Confirmation 2 gives signal
2. Confirmation 1 agrees
3. Price inside Goldie Locks Zone Minimum
4. Price inside Goldie Locks Zone Maximum
5. Volatility/Volume agrees
6. Baseline agrees
7. Confirmation 1 signal was less than 7 candles prior
1-Candle Confirmation 2 Entry
1a. GKD-C Confirmation 2 gives signal
2a. Confirmation 1 agrees
3a. Price inside Goldie Locks Zone Minimum
4a. Price inside Goldie Locks Zone Maximum
5a. Confirmation 1 signal was less than 'Maximum Allowable PSC2C Bars Back' prior
Next Candle
1b. Price retraced
2b. Confirmation 2 agrees
3b. Confirmation 1 agrees
4b. Volatility/Volume agrees
5b. Baseline agrees
PullBack Entry
1a. GKD-B Baseline gives signal
2a. Confirmation 1 agrees
3a. Price is beyond 1.0x Volatility of Baseline
Next Candle
1b. Price inside Goldie Locks Zone Minimum
2b. Price inside Goldie Locks Zone Maximum
3b. Confirmation 1 agrees
4b. Confirmation 2 agrees
5b. Volatility/Volume agrees
Continuation Entry
1. Standard Entry, 1-Candle Standard Entry, Baseline Entry, 1-Candle Baseline Entry, Volatility/Volume Entry, 1-Candle Volatility/Volume Entry, Confirmation 2 Entry, 1-Candle Confirmation 2 Entry, or Pullback entry triggered previously
2. Baseline hasn't crossed since entry signal trigger
4. Confirmation 1 agrees
5. Baseline agrees
6. Confirmation 2 agrees
Williamsvixfix
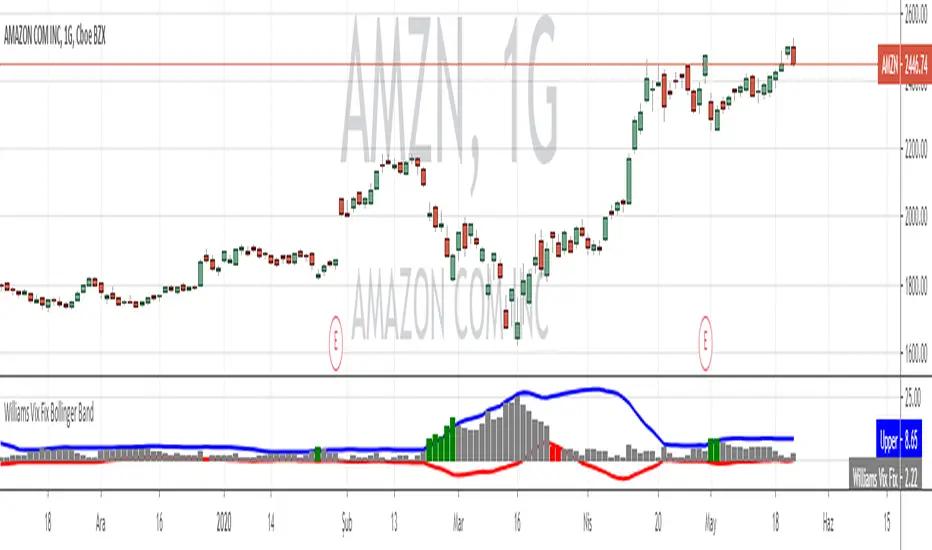
Williams Vix Fix + Inverse [Alorse]The VIX Fix measures how close the current market price is to the lowest price of the last X candles. When prices are in uptrends, the close is usually near the high. But prices close near the low in downtrends.
It works because it’s based on how traders behave. The calculation fixes some of the problems with the VIX.
This indicator is based on CM_Williams_Vix_Fix Finds Market Bottoms and its great difference is that it adds the inverse functionality, also showing the possible highest areas of the market.

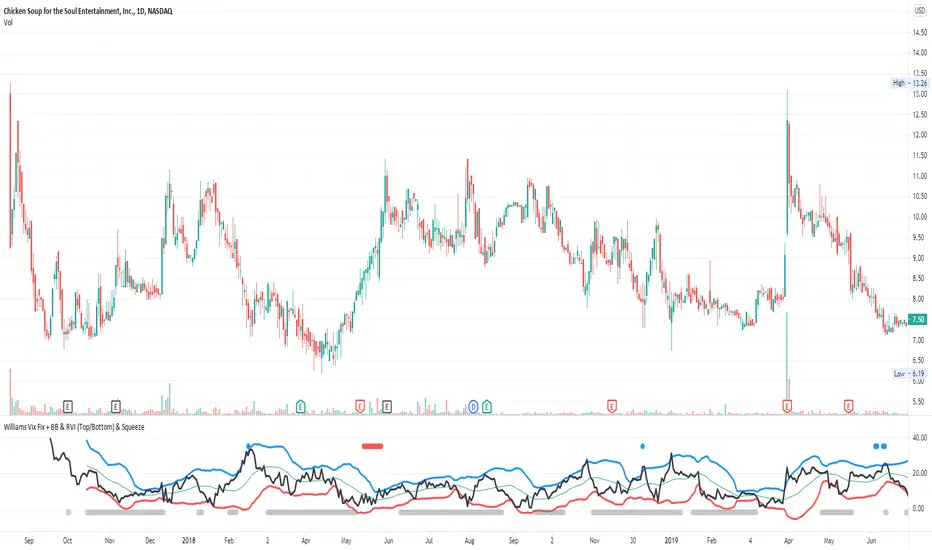
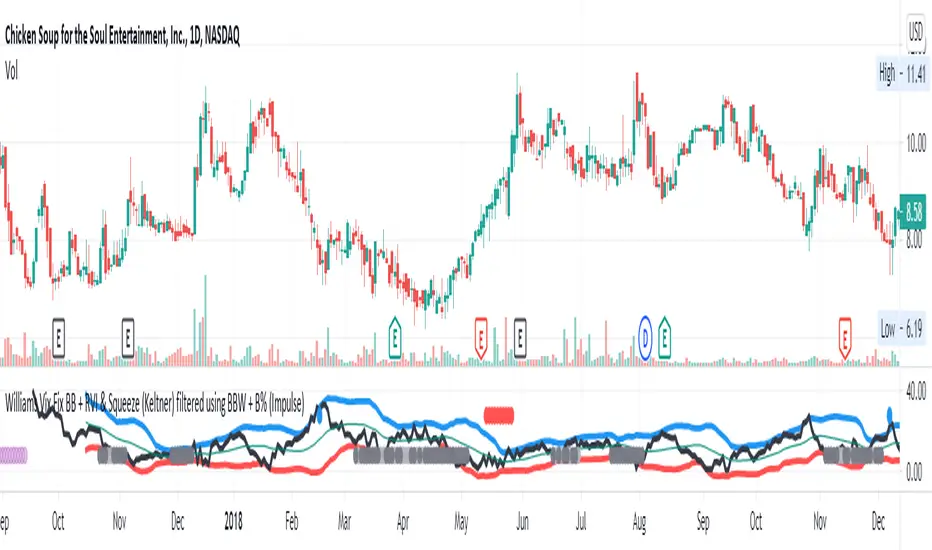
Williams Vix Fix BB + RVI + LinReg & Squeeze (Keltner) BBW + %BLegend:
Entery signal: When line color turns to lime (lighter green) after a blue dot appears
Exit signal: When line color turns to red (darker red) after a red dot appears
Note: it is more affective as an entry signal (Bottom is stronger)
- When line touches or crosses red band it is Top signal (Williams Vix Fix)
- When line touches or crosses blue band it is Bottom signal (Williams Vix Fix)
- Red dot at the top of indicator is a Top signal (Relative Volatility Index)
- Blue dot at the top of indicator is a Bottom signal (Relative Volatility Index)
- Gray dot at the bottom of indicator is a Keltner Squeeze signal (filtered by either BBW or %B)
- Silver dot at the bottom of indicator is a weaker Keltner Squeeze signal (Doesn't meet either BBW or %B filter)
- Purple is a 'Half Squeeze' only 1 Bollinger Band crossed the Keltner Channel
This is an attempt to make use of the main features of all 6 of these Volatility tools:
- Williams Vix Fix + Bollinger Bands
- Relative Volatility Index (RVI)
- Linear Regression (detects Vix Fix starts to rise or fall to a certain degree in order to help validate bottom/top)
Note : There is also added precision on Linear Regression entry by dividing WVF by square roots of basis.
- The crossing of Keltner Channel by the Bollinger Bands (Squeeze)
Conditions to Help Filter Keltner Squeeze:
- When the Bollinger Bands Width (BBW) value is lower than the lowest value within a period plus a margin of error (percentage)
- When the %B value goes up or down by the impulse value (threshold value in setting) detailed in LazyBears indicator. (www.tradingview.com)
If it meets one of these 2 filters and there is a Keltner Channel Squeeze than gray color or else if the squeeze doesn’t meet one of the 2 filters than silver color (weaker Squeeze).
The goal is to find the best tool to find bottoms and top relative to volatility and filter squeeze.
Note: You can also change the threshold for RVI top and bottom.
And this work builds on my last indicators:
- Williams Vix Fix + BB & RVI (Top/Bottom) & Squeeze ()
- Williams Vix Fix BB + RVI & Squeeze (Keltner) filtered BBW + %B ()
If you have ideas on this work or have ideas on potential combinations please message me, I always want to learn or get perspective on how it can be improved.
Sharing is how we get better (Parameter tuning, ideas, discussion)
I don’t reinvent the wheel, just trying to make the wheel better.
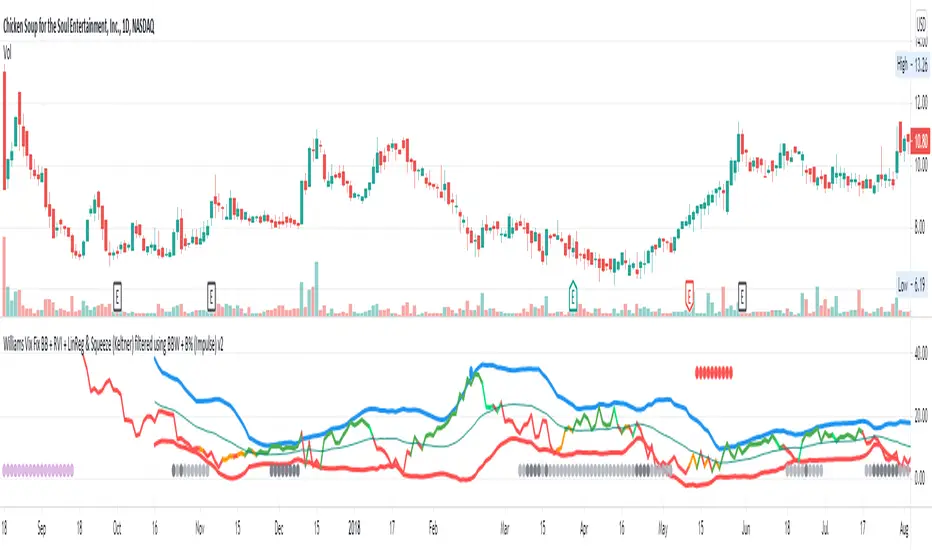
Williams Vix Fix BB + RVI & Squeeze (Keltner) filtered BBW + %BLegend:
- When line touches or crosses red band it is Top signal (Williams Vix Fix)
- When line touches or crosses blue band it is Bottom signal (Williams Vix Fix)
- Red dot at the top of indicator is a Top signal (Relative Volatility Index)
- Blue dot at the top of indicator is a Bottom signal (Relative Volatility Index)
- Gray dot at the bottom of indicator is a Keltner Squeeze signal (filtered by either BBW or %B)
- Silver dot at the bottom of indicator is a weaker Keltner Squeeze signal (Doesn't meet either BBW or %B filter)
- Purple is a 'Half Squeeze' only 1 Bollinger Band crossed the Keltner Channel
This is an attempt to make use of the main features of all 6 of these Volatility tools :
- Williams Vix Fix + Bollinger Bands
- Relative Volatility Index (RVI)
- The crossing of Keltner Channel by the Bollinger Bands (Squeeze)
Conditions to Help Filter Keltner Squeeze:
- When the Bollinger Bands Width (BBW) value is lower than the lowest value within a period plus a margin of error (percentage)
- When the %B value reaches the alert level detailed in LazyBears indicator. ()
If it meets one of these 2 filters and there is a Keltner Channel Squeeze than gray color or else if the squeeze doesn’t meet one of the 2 filters than silver color (weaker Squeeze).
The goal is to find the best tool to find bottoms and top relative to volatility and filter the squeeze.
The idea is that both Williams Vix Fix + Bollinger Bands and Relative Volatility Index both already give the main volatility bottom and top so combining them to compare and validate the signals makes sense. (Note: Bottom signal is more accurate than top). In addition, I added the squeeze to show the potential breakout pressure and to compliment bottom and top signals.
For ideas on how to continue this work :
I encourage ideas to combine the Williams Vix Fix and Relative Volatility Index for volatility top and bottom (with probability would be awesome)
And I encourage ideas to filter Keltner Channel Volatility Squeeze using both the BBW or %B or other volatility squeeze indicators or a combination of all of them.
Also, I encourage people to post their top parameters for the BBW and %B to filter the Keltner Squeeze in the comments or to send me them by chat relative to this indicator.
Half the battle is making the indicator, while the other half is tuning the parameters.
The current parameters are one of the least aggressive, and act as a mild filter.
Note: You can also change the threshold for RVI top and bottom.
And this work builds on my last indicator:
If you have ideas on this work or have ideas on potential combinations please message me, I always want to learn or get perspective on how it can be improved.
Sharing is how we get better (Parameter tuning, ideas, discussion)
I don’t reinvent the wheel, just trying to make the wheel better.
Williams Vix Fix + BB & RVI (Top/Bottom) & SqueezeLegend :
- When line touches or crosses red band it is Top signal (Williams Vix Fix)
- When line touches or crosses blue band it is Bottom signal (Williams Vix Fix)
- Red dot at the top of indicator is a Top signal (Relative Volatility Index)
- Blue dot at the top of indicator is a Bottom signal (Relative Volatility Index)
- Gray dot at the bottom of indicator is a Squeeze signal
This is an attempt to make use of the main features of all 4 of these very popular Volatility tools :
- Williams Vix Fix + Bollinger Bands (as per Larry Williams idea, link )
- Relative Volatility Index (RVI)
- The crossing of Keltner Channel by the Bollinger Bands (Squeeze)
The goal is to find the best tool to find bottoms and top relative to volatility . This is a simple combination, but I find it very useful personally
(no need to reinvent the wheel, just need to find what works best)
The idea is that Williams Vix Fix + Bollinger Bands already give the main volatility bottom and top (Bottom are more accurate).
So instead of trying to modify it, I chose to compliment it by mapping with points when the Relative Volatility Index (RVI) reached the
top/bottom thresholds (red dot means top and blue dot means bottom). That way we can easily see when both indicators find a top or bottom relative
to volatility (of course this needs to be then confirmed with a momentum indicator rally).
In addition, I added the squeeze because this quickly shows the potential breakouts.
For ideas on how to continue this work, it would be very interesting to be able to create a probability of a bottom and top relative to volatility using the
Williams Vix Fix + Bollinger Bands and "Relative Volatility Index" signals as both work well and give top or bottom the other doesn't see.