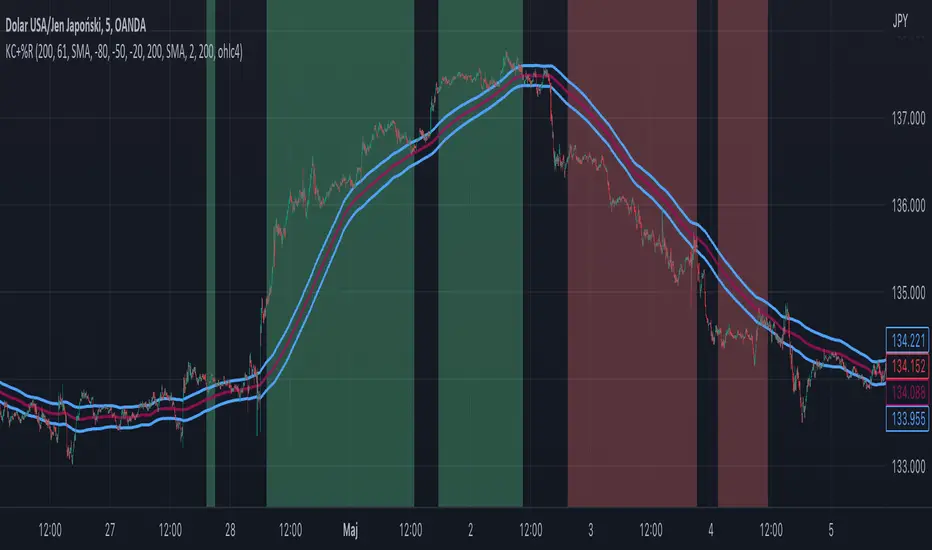
Williams %R + Keltner chanells - indicator (AS)1)INDICATOR ---This indicator is a combination of Keltner channels and Williams %R.
It measures trend using these two indicators.
When Williams %R is overbought(above upper line (default=-20)) and Keltner lower line is below price indicator shows uptrend (green).
When Williams %R is oversold(below lower line (default=-80)) and Keltner upper line is above price indicator shows downtrend (red) .
Can be turned into a strategy quickly.
2) CALCULATIONS:
Keltner basis is a choosen type of moving average and upper line is basis + (ATR*multiplier). Same with lower but minus instead of plus so basiss – (ATR*multiplier)
Second indicator
Williams %R reflects the level of the close relative to the highest high for the lookback period
3)PLS-HELP-----Looking for tips, ideas, sets of parameters, markets and timeframes, rules for strategy -------OVERALL -every advice you can have
4) SIGNALS-----buy signal is when price is above upper KC and Williams %R is above OVB(-20). Short is exactly the other way around
5) CUSTOMIZATION:
-%R-------LENGTH/SMOOTHING/TYPE SMOOTHING MA
-%R-------OVS/MID/OVB -(MID-no use for now)
-KC -------LENGTH/TYPE OF MAIN MA
-KC-------MULTIPLIER,ATR LENGTH
-OTHER--LENGTH/TYPE OF MA - (for signal filters, not used for now)
-OTHER--SOURCE -src of calculations
-OTHER--OVERLAY - plots %R values for debugging etc(ON by default)
6)WARNING - do not use this indicator on its own for trading
7)ENJOY
Oscylatory Williamsa
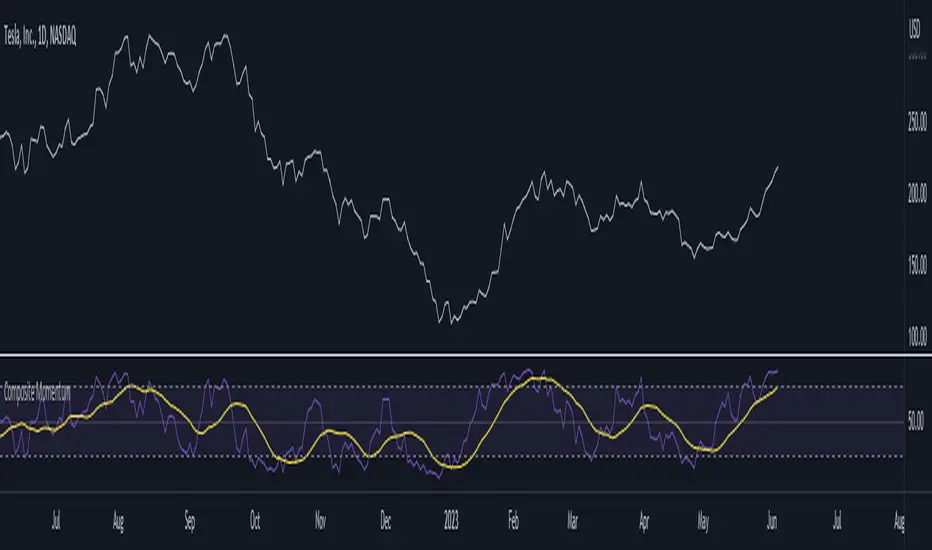
Composite MomentumComposite Momentum Indicator - Enhancing Trading Insights with RSI & Williams %R
The Composite Momentum Indicator is a powerful technical tool that combines the Relative Strength Index (RSI) and Williams %R indicators from TradingView. This unique composite indicator offers enhanced insights into market momentum and provides traders with a comprehensive perspective on price movements. By leveraging the strengths of both RSI and Williams %R, the Composite Momentum Indicator offers distinct advantages over a simple RSI calculation.
1. Comprehensive Momentum Analysis:
The Composite Momentum Indicator integrates the RSI and Williams %R indicators to provide a comprehensive analysis of market momentum. It takes into account both the strength of recent price gains and losses (RSI) and the relationship between the current closing price and the highest-high and lowest-low price range (Williams %R). By combining these two momentum indicators, traders gain a more holistic view of market conditions.
2. Increased Accuracy:
While the RSI is widely used for measuring overbought and oversold conditions, it can sometimes generate false signals in certain market environments. The Composite Momentum Indicator addresses this limitation by incorporating the Williams %R, which focuses on the price range and can offer more accurate signals in volatile market conditions. This combination enhances the accuracy of momentum analysis, allowing traders to make more informed trading decisions.
3. Improved Timing of Reversals:
One of the key advantages of the Composite Momentum Indicator is its ability to provide improved timing for trend reversals. By incorporating both RSI and Williams %R, traders can identify potential turning points more effectively. The Composite Momentum Indicator offers an early warning system for identifying overbought and oversold conditions and potential trend shifts, helping traders seize opportunities with better timing.
4. Enhanced Divergence Analysis:
Divergence analysis is a popular technique among traders, and the Composite Momentum Indicator strengthens this analysis further. By comparing the RSI and Williams %R within the composite calculation, traders can identify divergences between the two indicators more easily. Divergence between the RSI and Williams %R can signal potential trend reversals or the weakening of an existing trend, providing valuable insights for traders.
5. Customizable Moving Average:
The Composite Momentum Indicator also features a customizable moving average (MA), allowing traders to further fine-tune their analysis. By incorporating the MA, traders can smooth out the composite momentum line and identify longer-term trends. This additional layer of customization enhances the versatility of the indicator, catering to various trading styles and timeframes.
The Composite Momentum Indicator, developed using the popular TradingView indicators RSI and Williams %R, offers a powerful tool for comprehensive momentum analysis. By combining the strengths of both indicators, traders can gain deeper insights into market conditions, improve accuracy, enhance timing for reversals, and leverage divergence analysis. With the added customization of the moving average, the Composite Momentum Indicator provides traders with a versatile and effective tool to make more informed trading decisions.
[TTI] IBD's 3 (three) weeks tight close pattern––––HISTORY & CREDITS 🏦
The Three Weeks Tight Close pattern is a technical analysis pattern that occurs when a stock closes at nearly the same price for three consecutive weeks, suggesting a period of consolidation before the stock moves in a new direction. The concept of "line of least resistance" as mentioned by Jesse Livermore is closely related to this pattern. It indicates that there is a period of indecision in the market, with buyers and sellers fairly evenly matched. This pattern is often associated with stocks that have strong fundamentals and a solid business model. The pattern was first discovered by Investor's Business Daily founder William Bill O'Neill.
––––WHAT IT DOES 💡
The Three Weeks Tight Close pattern helps traders identify periods of consolidation in a stock's price movement. During these periods, the stock's closing price remains nearly unchanged for three consecutive weeks. This pattern can be a signal that the stock is under accumulation and potentially ready to make a significant move in either an upward or downward direction. By identifying these tight closes, traders can prepare to take advantage of the solid price run and make profitable trades.
The indicator plots 3 different dots/squares above the weekly bar on order to indicate which consecutive tight close wee have.
👉 Cyan color indicates 3 week tight closes
👉 Pink color indicates 4 week tight closes
👉 Red color indicates 5 week tight closes
––––HOW TO USE IT 🔧
• Focus on weekly charts for easier identification.
• Look for three consecutive weekly closes with nearly the same price, within 1-1.5% of each other. Using the indicator.
• Check for low volume during the tightening period.
• Once the pattern is confirmed, switch to the daily timeframe to find the exact buy point.
• Use other technical indicators to confirm a breakout before taking a position in the stock, such as breakouts, moving averages, and trend lines.
• Monitor the position regularly to ensure continued positive price movement.
• Be patient and wait for confirmation before buying in.
• Use stop-loss orders to limit losses if the stock does not move in the expected direction.
• Consider the overall market and its impact on individual stocks before making a trade.
• Keep in mind that not all three tight closes are created equal and use technical analysis to confirm your suspicions.
By following these steps, traders can use the Three Weeks Tight Close pattern to identify potential trading opportunities and increase their chances of making profitable trades.

Candle Combo ScreenerThe Candle Combo Screener allows you to see candlestick combinations for up to 5 different tickers at the same time . If one of the candle combination is detected the corresponding cell will be highlighted to alert you.
Candle Combinations Detected
Bullish Kicker
Bullish & Bearish Oops Reversals
Open Equals High / Low
Inside Day
Select any 5 tickers. Colors and table settings are fully customizable to fit your style.
Bullish Kicker
The opening price of the current candle gaps up above the body of the prior day's candle AND the prior day's candle close was less than the open.
Oops Reversals
Bullish: Price opens below the prior day’s low and closes above.
Bearish: Price opens above the prior day's high and closes below.
Open Equals High / Low
The current candles opening price is equal to either the high or low of the day.
Inside Day
The current candles high and low are contained within the prior day's high and low.

WillyCycle Oscillator&DoubleMa/ErkOzi/version 2This oscillator can be customized by adjusting the length of the Willy period, the length of Willy's EMA, and the upper and lower bands. The upper and lower bands help traders identify overbought and oversold conditions.
The WillyCycle Oscillator is a technical analysis tool used to measure the momentum of an asset and identify overbought and oversold conditions based on the price range of a specific period and calculating the percentage of the closing price in that range. The WillyCycle Oscillator consists of two main components: Willy and Willy's EMA. The Willy component is the percentage calculation of the asset's price range, and Willy's EMA is the exponential moving average of the Willy component. Willy's EMA is used to smooth out the Willy component and make it easier to identify trends.
*** When the oscillator is above the 80 level, it indicates that the asset is overbought, and when it is below the 20 level, it indicates that the asset is oversold. Traders can use these levels as a guide for buying and selling signals.
***Traders can also use the WillyCycle Oscillator to identify trend reversals. When the oscillator rises above the 50 level, it signals a potential uptrend, and when it falls below the 50 level, it signals a potential downtrend.
***I have added a smoothed line option to the WillyCycle Oscillator, which allows traders to see a more smoothed version of the oscillator. This option can be enabled by setting the 'smoothed' input to true. The default value for the smoothed line is 15.
***We have also changed the value range of the WillyCycle Oscillator from -100 to 100 to 0 to 100. This change was made to make the oscillator more user-friendly and easier to read.
In conclusion, the WillyCycle Oscillator is a versatile tool that can help traders identify potential trading opportunities and trend reversals. Traders can customize the oscillator to fit their trading style and preferences. Adding a smoothed line and changing the value range can enhance the user experience and make the oscillator easier to use.

WillyCycle Oscillator&DoubleMa/ErkOzi/"This code creates a technical analysis indicator used to calculate and visualize the WillyCycle oscillator and double moving average indicators on the price of a financial asset. The functionality can be summarized as follows:
*Calculate the WillyCycle oscillator: The WillyCycle is an oscillator calculated based on the highest and lowest values of an asset. This oscillator is used to measure overbought or oversold conditions of the asset.
*Calculate the double moving average: The double moving average helps determine trends by calculating the short-term and long-term moving averages of asset prices.
*Use the WillyCycle oscillator and double moving average indicators together: The WillyCycle oscillator is combined with the double moving averages to provide a clearer indication of overbought and oversold conditions.
*Visualize the indicator with color coding: The indicator is color-coded to show overbought and oversold conditions. Additionally, line and background colors are changed to make the indicator more readable.
Many parameters can be adjusted on the indicator: The indicator can be customized and modified by the user. For example, the period of the WillyCycle oscillator and the lengths of the double moving averages can be adjusted."
The strategy is based on two indicators - the WillyCycle oscillator and the double moving average. The WillyCycle oscillator measures overbought and oversold conditions of the asset based on its highest and lowest values. The double moving average calculates short-term and long-term moving averages of the asset's price, which can help identify trends.
The WillyCycle oscillator and the double moving average are combined in this strategy to provide a clearer indication of overbought and oversold conditions. When the WillyCycle oscillator indicates that the asset is oversold and the short-term moving average crosses above the long-term moving average, it may signal a buy opportunity. Conversely, when the WillyCycle oscillator indicates that the asset is overbought and the short-term moving average crosses below the long-term moving average, it may signal a sell opportunity.
To make it easier for traders to read and interpret the indicator, color-coding is used to indicate overbought and oversold conditions. The user can also customize the indicator by adjusting parameters such as the period of the WillyCycle oscillator and the lengths of the double moving averages.
*ıt provides successful buy and sell signals for price reversals.
*You can open counter trades in overbought and oversold areas by following the averages.

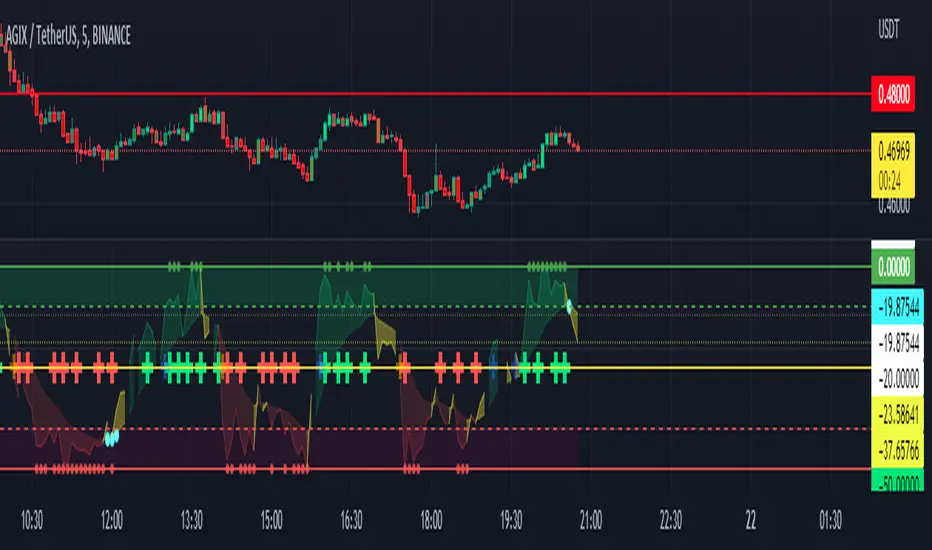
FOREX Master Pattern Trend Finder by nnamdertWhat does this Indicator do?
This indicator works by identifying Trends and "potential" shifts in trends before they happen. It is technically a momentum indicator that watches for specific Bullish or Bearish momentum (i.e. Bull Runs, and Crashes).
How does it do this?
It uses a custom script that takes into account extremes in price and certain moving averages and other accurate forward looking indicators. Once it finds a Bull run, signals are triggered in the form of PLUS signs. It does the same for strong Bearish trends. Based on how the script is configured, the Indicator is able to spot (in advance) unique movement in the trend that can predict a change in momentum prior to the change occurring.
These momentum changes can be configured as alerts.
As seen in the screenshot below the indicator triggers "early warning" signals when it detects a specific movement that is indicative of a potential change in momentum or trend. It does this IN ADVANCE of any change - it is ONLY A PREDICTION but allows the trader to look at the asset to determine if the potential change in trend is valid and gives the trader enough time to set up a trade and stop-loss.
As seen in the screenshot below color-coded candles allow the trader to visually SEE the change on the chart making it easier to get a quick glance at the current trend. In addition, Green and Red Crosses were added to the oscillator to help easily identify trends if the color coded candle feature is turned OFF. These Red and Green Crosses are not located at every highlighted bar location, rather, at the first bar that the alert was triggered on. If there was a gap in the trend, the alert triggers, and plots again when a new trend starts.
As seen in the screenshot below, when a strong trend is present in either direction, small red or green dots are plotted on the oscillator. This makes spotting past and current trends much easier. Even if the price is not moving up or down, this indicates strong underlying buying or selling pressure.
Some traders like using indicators as a reversal finder. Although this indicator is NOT A REVERSAL INDICATOR, I added a signal that can be used as a "potential" reversal finder. You can see this in the screenshot below.
These "reversal" signals typically appear prior to a move in the opposite direction (but not always). A stop-loss can be set at the high or low of the previous bar depending on direction.
At times, multiple "conflicting" warning signals appear back-to-back. This is indicative of a "crab" in the market. Basically, indecision is present in the market. These "early warning" signals are smaller and either BLUE or ORANGE . Once a trend is recognized, the signal will be either RED or GREEN and a bit larger.
Viewing a higher timeframe will allow Forex Master Pattern traders to easily spot contraction zones. I manually draw the lines in at these zones. These "Value Lines" are typically respected in the future. As shown in the screenshot below, the level acted as support in the future and a newer value line was created at a "higher level" - this indicates a Bullish momentum in price as buyers and sellers have agreed upon the higher price as a true value area.
As seen in the screenshot below, multiple potential reversal signals plotted on the chart indicate a "weakening' in the strength of the current trend. This allows the trader to strategically move their stop-loss or simply take some profits off the table at this level.
This Indicator does NOT overlay on the current chart but allows the trader to see color coded bars. Simply double clicking within the indicator will expand the indicator to full screen, and double clicking within the chart itself will hide the secondary pane but keep the candles visible on the chart.
Happy Trading and GOOD LUCK!
[TTI] IBD Power Trend🏛️ History & Credit
IBD Power Trend is an indicator created by TintinTrading inspired by the Investor's Business Daily and William O'Neil's investment philosophy. It is part of the Market School methodology.. It's built on the principle that the market's Power Trend is the best time to get aggressive.
💪 What it does
IBD Power Trend helps traders identify when the market's Power Trend starts and finishes. The indicator uses rules about the position of the price relative to the 21EMA and 50SMA, as well as the relationship between the two moving averages, to give traders an edge.
👨🏫 How to use it
IBD Power Trend can be used as an additional criteria to decide when to get more aggressive in the market. It can also be used to assess when to be a pig/tiger. With IBD Power Trend, traders can have more confidence in their trades and make better investment decisions.

AII - Average indicator of indicatorsThis Pine Script for TradingView is a technical analysis tool that visualizes the average of several popular indicators in the trading world. The indicators included are the RSI (Relative Strength Index), RVI (Relative Vigor Index), Stochastic RSI, Williams %R, relative MACD (ranging from 0 to 100), and Bollinger Bands price distance from 0 to 100. The script uses the "input" function to customize the length of the indicators and the "plot" function to display the results on the chart. In addition, options are included to turn off certain indicators and change the line colors if the user desires. All indicators can also be activated independently, allowing the user to see only the indicators they want. It is also mentioned that the script will be improved in the future to offer a better user experience. The calculated values are calculated with the default EMA of 14. Overall, this script is an excellent option for those looking for a combined view of several important indicators for making trading decisions.

CM_Williams_Vix_Fix - Market Top and Bottom with multi-timeframeThis is a modification of CM_Williams_Vix_Fix indicator to include both market tops and bottoms with multi-timeframe support. The original indicator only finds market bottoms.
All credits go to the original author ChrisMoody.
Original script link
Working:
The histogram above 0 signifies the trend of market going UP and the histogram below 0 signifies the trend of market going DOWN.
The histogram bar is calculated using "LookBack Period Standard Deviation High" number of candles. A threshold is calculated using bollinger bands and based on percentile of "Look Back Period Percentile High" number of candles.
If the histogram bar above 0 crosses the up threshold then we have market top which is signified by histogram bar having the color green. If the histogram bar below 0 crosses the down threshold then we have market bottom which is signified by histogram bar having the color red.
The market tops and bottoms can also be calculated across multiple timeframes.
Sample usage:
Suppose the market is in an uptrend and the indicator displays red market bottom bar, this might be an indication that the market has reached the end of a pullback. We can use additional indicators like stochastic or rsi to get additional confluence.
This indicator does not repaint but you need to wait for the candle to close.

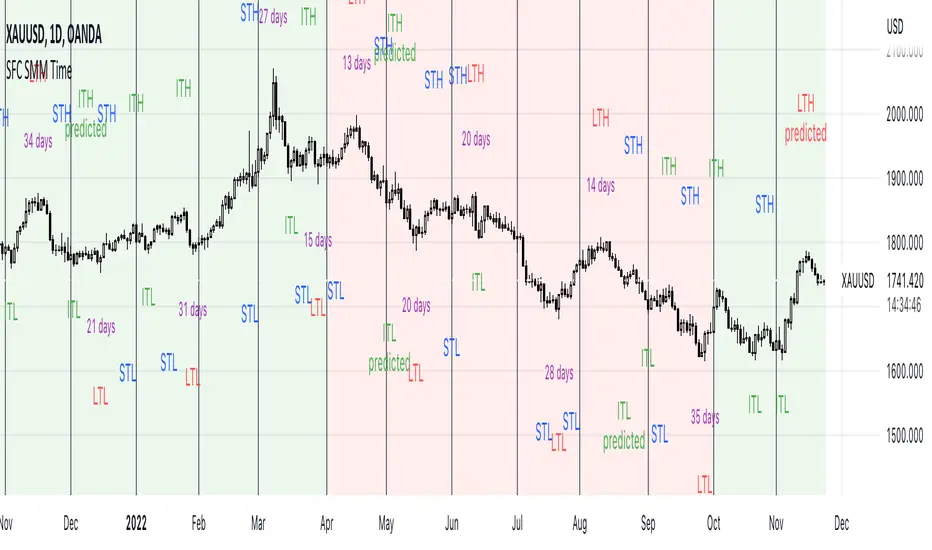
SFC Smart Money Manipulation - Time, Advanced Market StructureThis indicator shows the market structure in more advanced way and different time cycles.
Markets moves in cycles and swings. The indicator will help to determine these cycles and swings by time and price. These are the two columns of the market understanding. The third one is volume/ momentum, but it will not be discussed here.
Advanced Market Structure
According to ICT and Larry Williams Market Structure is not only Highs and Lows.
They present more advanced understanding of the MS:
-Short Term Highs/ Lows
-Intermediate Term Highs/ Lows
-Long Term Highs/ Lows
Rules of how to determine the Swing Points according to Larry Williams:
"A market has made a short-term low when we have a day (or bar if you are using different time periods) that has a higher low on both sides. By the same token a short-term high will be a day (or bar) that has lower bars on both sides of it."
"A short-term high with lower short-term highs on both sides is an intermediate- term high. By the same token, a short-term low with higher short-term lows on both sides is an intermediate-term low."
"An intermediate-term high with lower intermediate-term highs on both sides of it is just naturally a long-term high by our definition, thanks to understanding market structure.
An intermediate-term low with higher intermediate-term lows on both sides of it is just naturally a long-term low by our definition, thanks to understanding market structure."
If the Highs and Lows are labeled properly there is high probability to predict the next High or Low. In this way the trader will know how the current trend is changing and what kind of retracement is coming - deep or shallow.
Timing
Market moves in time cycles.
There is a theory that the swings are equal by time and length. This is not always the case, but very very often.
Indicator time features:
- Swing Trading days - how many time market needed to form a swing. Only Long term(main) Swings are measured. This will help trader to label T-formations.
" T Formations is cyclically related for formations that can be drawn to project the time frame of likely turning points. Basically T-formations are based on the concept that the time distance between the starting low/high of the cyclical wave and its peak is likely to be subsequently repeated between that peak and the final low/high of that cycle."
- Seasonality - theoretically an asset should go up or down in particular yearly quarter. Practically the direction not always match to quarters. Thats why the indicator shows the theoretical seasonal direction and historical real direction.
Seasonal direction is automatically displayed or XAUUSD, XAGUSD, EURUSD, AUDUSD, GBPUSD. There is a ways to set the seasonality manually.
- Earnings Season - This time is very important for Stocks and Indices. Most of the time the assets are in bullish trend during the Earnings Seasons.
- Monthly separator - Shows the monthly time cycle
- Gold bullish months - There are studies on Gold market. They shows that Gold is very bullish in particular months. These are displayed.
The indicator works only on Daily Time Frame.
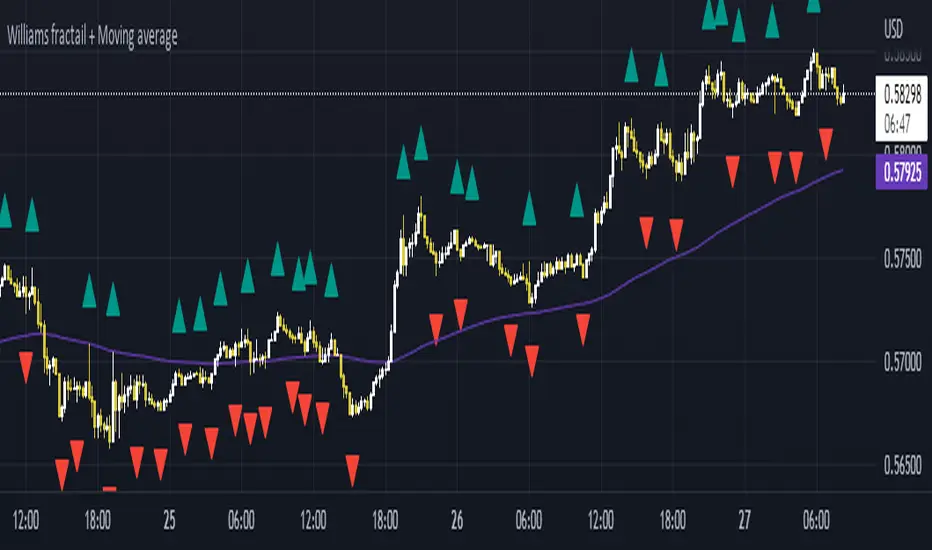
Williams Fractals + SMMAwilliams fractail + moving average. Is for educational . combined indicator of williams fractails and smmothed moving average
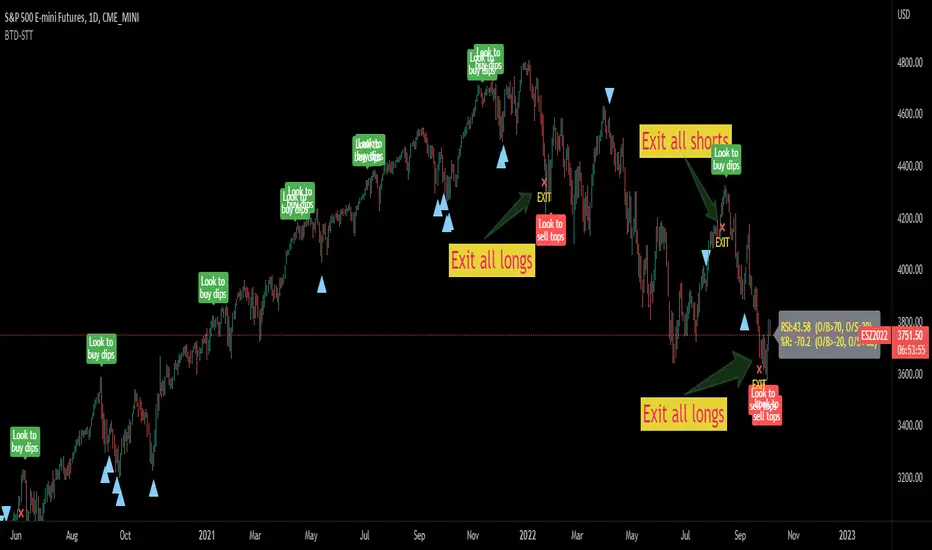
Buy the dips - sell the topsThis script is a merge of the RSI and the Williams %R.
I've observed that in strong uptrends, we go from RSI overbought to RSI overbought, but it hardly gets oversold. (the same in the opposite direction)
To find a better entry point, Williams %R is used to find oversold conditions in an uptrend or overbought in a downtrend.
=> When W%R returns from oversold/overbought to normal, a triangle will be plotted and this is the point of entry to add to your position. (there's an option to mark all candles in the overbought/oversold region, by default it is off)
=> When RSI goes from overbought back to normal it will tell you to buy the dip. In a downtrend it will tell you to sell the tops.
=> When the RSI gets oversold and the previous RSI was overbought, it will mark to exit the position
I did backtest this one with a risk to reward of 2 and exit when target is reached.
Trading EUR/USD on the daily would return 28% after 10 years of trading with a success ratio of 43%.
Trading BTC/USD on the daily would lose 12% after 7 years and a success rate of 28%.
Trading it this way is not the best idea ;-) 2 Interesting observations however:
- Once you get the entry right, in 80% of the cases, you do reach the next RSI oversold/overbought level. Keeping your position open until you reach that level can be an option to maximize profits.
- When a triangle is plotted and it is the low compared to the previous more or less 5 candles (same for the high), chances are high it will be taken out a few candles later, so don't take a trade yet.
Using classic technical analysis might improve more your entry and exit positions.
Feel free to comment your best strategy using this indicator ;-)
Happy trading!
Quick and Simple - WPR+RSI+CCITake a look.
Couple of confluencial reversal signals from popular indicators (W%R, RSI & CCI). I can only say this shows how random the "stanard tools" are and how the market makers "play" these kind of tools to their advantage.
That said. It's better tha average, but not top-class, so expect to have to take signals with other confluence. DON'T take the plots or signals as buy / sell signals, they are just confluencial movements from these indicators based on how they should be "traditionally" used. Instead, use it as a guide as to what other traders may be thinking, or as a pull-back identifier.
Included 100 period ema as basic trend filter.
Not my normal type of script + been away for some time so be kind, lol :)
You might find it useful however so sharing.
More stuff to follow :)

[TTI] IBD Eureka / Phoenix Thrusts––––History & Credit
The indicator was taught to me by an advanced IBD Masterclass that I attended about 8 years ago. When it happens it is noteworthy.
–––––What it does
It shows when there is a positive breadth thrust. It calculates, based on IBD's backtested criteria a strong breadth thrust in either direction. Up or down. The IBD guidelines is to use the NYSE market for this but I have made it so that you can choose between NYSE, AMEX, NASDAQ. The best signals happen within 2 weeks of Follow Through Day.
The indicator prints 2 signals only in a form of an arrow.
1. Eureka Thrust - this is the positive breadth thrust, prints under the bar pointing up
2. Phoenix Thrust - this is the negative breadth, prints over the bar pointing down
–––––How to use it
The arrows show positive or negative environment for trading. The results happen close to the turn of the trend. It should be used as part of the general market assessment.
I use the indicator on the S&P500 or NASDAQ Composite Daily timeframe. I take into consideration this indicator to determine my market exposure.

End-pointed SSA of Williams %R [Loxx]End-pointed SSA of Williams %R is an indicator that runes Williams %R SSA calculation through a Singular Spectrum Analysis (SSA) algorithm to derive a smoother final output. The reduction in noise from the traditional Williams %R is significant.
What is Williams %R?
Williams %R , also known as the Williams Percent Range, is a type of momentum indicator that moves between 0 and -100 and measures overbought and oversold levels. The Williams %R may be used to find entry and exit points in the market. The indicator is very similar to the Stochastic oscillator and is used in the same way. It was developed by Larry Williams and it compares a stock’s closing price to the high-low range over a specific period, typically 14 days or periods.
What is Singular Spectrum Analysis ( SSA )?
Singular spectrum analysis ( SSA ) is a technique of time series analysis and forecasting. It combines elements of classical time series analysis, multivariate statistics, multivariate geometry, dynamical systems and signal processing. SSA aims at decomposing the original series into a sum of a small number of interpretable components such as a slowly varying trend, oscillatory components and a ‘structureless’ noise. It is based on the singular value decomposition ( SVD ) of a specific matrix constructed upon the time series. Neither a parametric model nor stationarity-type conditions have to be assumed for the time series. This makes SSA a model-free method and hence enables SSA to have a very wide range of applicability.
For our purposes here, we are only concerned with the "Caterpillar" SSA . This methodology was developed in the former Soviet Union independently (the ‘iron curtain effect’) of the mainstream SSA . The main difference between the main-stream SSA and the "Caterpillar" SSA is not in the algorithmic details but rather in the assumptions and in the emphasis in the study of SSA properties. To apply the mainstream SSA , one often needs to assume some kind of stationarity of the time series and think in terms of the "signal plus noise" model (where the noise is often assumed to be ‘red’). In the "Caterpillar" SSA , the main methodological stress is on separability (of one component of the series from another one) and neither the assumption of stationarity nor the model in the form "signal plus noise" are required.
"Caterpillar" SSA
The basic "Caterpillar" SSA algorithm for analyzing one-dimensional time series consists of:
Transformation of the one-dimensional time series to the trajectory matrix by means of a delay procedure (this gives the name to the whole technique);
Singular Value Decomposition of the trajectory matrix;
Reconstruction of the original time series based on a number of selected eigenvectors.
This decomposition initializes forecasting procedures for both the original time series and its components. The method can be naturally extended to multidimensional time series and to image processing.
The method is a powerful and useful tool of time series analysis in meteorology, hydrology, geophysics, climatology and, according to our experience, in economics, biology, physics, medicine and other sciences; that is, where short and long, one-dimensional and multidimensional, stationary and non-stationary, almost deterministic and noisy time series are to be analyzed.
Included:
Bar coloring
[*Alerts
[*Signals
[*Loxx's Expanded Source Types
Related Williams %R Indicators
Williams %R on Chart w/ Dynamic Zones
Williams %R w/ Bollinger Bands
Intermediate Williams %R w/ Discontinued Signal Lines
Related SSA Indicators
End-pointed SSA of FDASMA
End-pointed SSA of Normalized Price Oscillator
[TTI] Fundamentals TableHISTORY AND CREDITS –––––––––––––––––––––––––––––––––––––––––––––––––––––––
I trade using TECHNICAL(70%) and FUNDAMENTAL(30%) Analysis. The table is inspired from my friend TED from BOOM traders who understands fundamentals very deeply. The structure and measures are inspired from the work of William O'Neil and Mark Minervini - recommending all their books.
WHAT IT DOES ––––––––––––––––––––––––––––––––––––––––––––––––––––––––––––––
The table is there to show the most important fundamentals we use for trading.
The indicator can be customised as to the position of the table and its coloring.
Measures:
Revenue
EPS
Net Profit Margin
IPO
Inventories
Receivable
All headers have tooltip to give idea how to use the indicator.
HOW TO USE IT –––––––––––––––––––––––––––––––––––––––––––––––––––––––––––––
Use the 3 dot system to determine if all things fall in place.
🟢 🟢 🟢 - this is the highest rating for a measure.
First dot = Increase from previous period
Second dot = Increase from 2 periods before
Third dot = Growth is accelerating.
EPS>20% = EPS have grown over 20% in last period
TDSG = Triple Digit Sales Growth
Code 33 = Mark Minervini rule
B/O EPS = Year with breakout of EPS
2Q AVG = 2 Quarters with growth over 20%
INV vs SAL = green means sales grow faster than inventories
REC vs SAL = green means sales grow faster than receivables
EST vs SAL = green means that estimates are higher than last period

Rsi/W%R/Stoch/Mfi: HTF overlay mini-plotsOverlay mini-plots for various indicators. Shows current timeframe; and option to plot 2x higher timeframes (i.e. 15min and 60min on the 5min chart above).
The idea is to de-clutter chart when you just want real-time snippets for an indicator.
Useful for gauging overbought/oversold, across timeframes, at a glance.
~~Indicators~~
~RSI: Relative strength index
~W%R: Williams percent range
~Stochastic
~MFI: Money flow index
~~Inputs~~
~indicator length (NB default is set to 12, NOT the standard 14)
~choose 2x HTFs, show/hide HTF plots
~choose number of bars to show (current timeframe only; HTF plots show only 6 bars)
~horizontal position: offset (bars); shift plots right or left. Can be negative
~vertical position: top/middle/bottom
~other formatting options (color, line thickness, show/hide labels, 70/30 lines, 80/20 lines)
~~tips~~
~should be relatively easy to add further indicators, so long as they are 0-100 based; by editing lines 9 and 11
~change the vertical compression of the plots by playing around with the numbers (+100, -400, etc) in lines 24 and 25

Williams % Range overlay mini plotPlots Williams Percent Range over bought/oversold indicator as a small overlay in top right corner.
De-clutter chart when all you're interested in is the real-time W%R to 'give permission' to enter a trade.
i.e. to remove the Williams %R lower pane from the above chart completely.
~~User Inputs~~
~W%R length
~Number of bars to show (default is last 6 bars)
~Plot offset (horizontal position of the plot; can be negative)
~Line color and thickness
~Show/hide plot title
~~tips~~
~in line 26, edit the multiplier (3*), to compress/expand the vertical size of the plot

Defu_RSIThis is a composite indicator, a collection of multiple indicators.
Includes:
1. in the simple RSI oversold and overbought area, I rewritten the RSI index of pine, which is more in line with the change of the relative intensity of rise and fall.
2. the red and green column line to the top is rewritten by William w% index. The red and green column indicates the top of the stage. When the column line disappears, it indicates the top of the stage. It is very reliable.
3. CCI green line: calculate CCI index through EMA weighting, smooth CCI curve and reflect trend change.
4. the j-link of KDJ variant indicates the real-time change of trend, which is used in conjunction with CCI index. Please observe carefully
5. the intra day fluctuation indicator is represented by a red orange column line below the 0 axis, and a simple filter is added to indicate the turning point of the trend.
I will continue to update when I have time
//==============The above is translated by Google , please pass the administrator
这是个复合指标,是多个指标的集合。
包含有 1. 简单RSI超卖超买区,我改写了pine自带的rsi指标,这个更加符合涨跌相对强度的变化。
2.到顶红绿柱线,由威廉W%指标改写,红绿柱表示阶段的顶部,当柱线消失时,表示阶段顶部,非常可靠。
3. CCI 绿色线,通过ema加权计算CCI指标,平滑CCI曲线,反应趋势变化。
4.用KDJ变种的J线连表示趋势的即时变化,这个配合CCI指标使用。请仔细观察
5.日内波动指示器,在0轴下方用红橙柱线表示,加了简单的过滤器,表示趋势的转折点。

Williams %R on Chart w/ Dynamic Zones [Loxx]Williams %R on Chart w/ Dynamic Zones is a Williams %R indicator but instead of being an oscillator it appears on chart. The WPR calculation used here leverages T3 moving average for its calculation. In addition, the WPR is bound by Dynamic Zones.
What is Williams %R?
Williams %R , also known as the Williams Percent Range, is a type of momentum indicator that moves between 0 and -100 and measures overbought and oversold levels. The Williams %R may be used to find entry and exit points in the market. The indicator is very similar to the Stochastic oscillator and is used in the same way. It was developed by Larry Williams and it compares a stock’s closing price to the high-low range over a specific period, typically 14 days or periods.
What is T3 moving average?
Developed by Tim Tillson, the T3 Moving Average is considered superior to traditional moving averages as it is smoother, more responsive and thus performs better in ranging market conditions as well.
What are Dynamic Zones?
As explained in "Stocks & Commodities V15:7 (306-310): Dynamic Zones by Leo Zamansky, Ph .D., and David Stendahl"
Most indicators use a fixed zone for buy and sell signals. Here’ s a concept based on zones that are responsive to past levels of the indicator.
One approach to active investing employs the use of oscillators to exploit tradable market trends. This investing style follows a very simple form of logic: Enter the market only when an oscillator has moved far above or below traditional trading lev- els. However, these oscillator- driven systems lack the ability to evolve with the market because they use fixed buy and sell zones. Traders typically use one set of buy and sell zones for a bull market and substantially different zones for a bear market. And therein lies the problem.
Once traders begin introducing their market opinions into trading equations, by changing the zones, they negate the system’s mechanical nature. The objective is to have a system automatically define its own buy and sell zones and thereby profitably trade in any market — bull or bear. Dynamic zones offer a solution to the problem of fixed buy and sell zones for any oscillator-driven system.
An indicator’s extreme levels can be quantified using statistical methods. These extreme levels are calculated for a certain period and serve as the buy and sell zones for a trading system. The repetition of this statistical process for every value of the indicator creates values that become the dynamic zones. The zones are calculated in such a way that the probability of the indicator value rising above, or falling below, the dynamic zones is equal to a given probability input set by the trader.
To better understand dynamic zones, let's first describe them mathematically and then explain their use. The dynamic zones definition:
Find V such that:
For dynamic zone buy: P{X <= V}=P1
For dynamic zone sell: P{X >= V}=P2
where P1 and P2 are the probabilities set by the trader, X is the value of the indicator for the selected period and V represents the value of the dynamic zone.
The probability input P1 and P2 can be adjusted by the trader to encompass as much or as little data as the trader would like. The smaller the probability, the fewer data values above and below the dynamic zones. This translates into a wider range between the buy and sell zones. If a 10% probability is used for P1 and P2, only those data values that make up the top 10% and bottom 10% for an indicator are used in the construction of the zones. Of the values, 80% will fall between the two extreme levels. Because dynamic zone levels are penetrated so infrequently, when this happens, traders know that the market has truly moved into overbought or oversold territory.
Calculating the Dynamic Zones
The algorithm for the dynamic zones is a series of steps. First, decide the value of the lookback period t. Next, decide the value of the probability Pbuy for buy zone and value of the probability Psell for the sell zone.
For i=1, to the last lookback period, build the distribution f(x) of the price during the lookback period i. Then find the value Vi1 such that the probability of the price less than or equal to Vi1 during the lookback period i is equal to Pbuy. Find the value Vi2 such that the probability of the price greater or equal to Vi2 during the lookback period i is equal to Psell. The sequence of Vi1 for all periods gives the buy zone. The sequence of Vi2 for all periods gives the sell zone.
In the algorithm description, we have: Build the distribution f(x) of the price during the lookback period i. The distribution here is empirical namely, how many times a given value of x appeared during the lookback period. The problem is to find such x that the probability of a price being greater or equal to x will be equal to a probability selected by the user. Probability is the area under the distribution curve. The task is to find such value of x that the area under the distribution curve to the right of x will be equal to the probability selected by the user. That x is the dynamic zone.
Included
Bar coloring
Channels fill
Loxx's Expanded Source Types
35+ moving average types

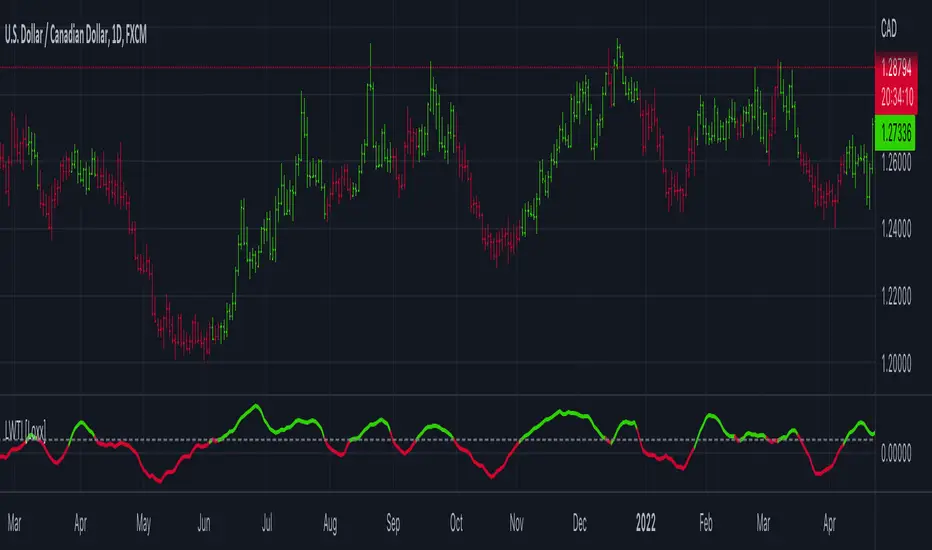
Larry Williams Large Trade Index (LWTI) [Loxx]Larry Williams Large Trade Index (LWTI) is an indicatory by Larry Williams as explained in his book "Trade Stocks and Commodities with the Insiders: Secrets of the COT Report". I've added optional smoothing if you wish to smooth the output.
What is the Larry Williams Large Trade Index (LWTI)?
The original concept was specifically based on Trader (or Market) Sentiment and predicting market reversals. It's calculated as follows:
MovingAvg(Close - Close , bars used in average)/MovingAvg(Range,bars used in average)*50 + 50
Included
Bar coloring
Signals
Alerts
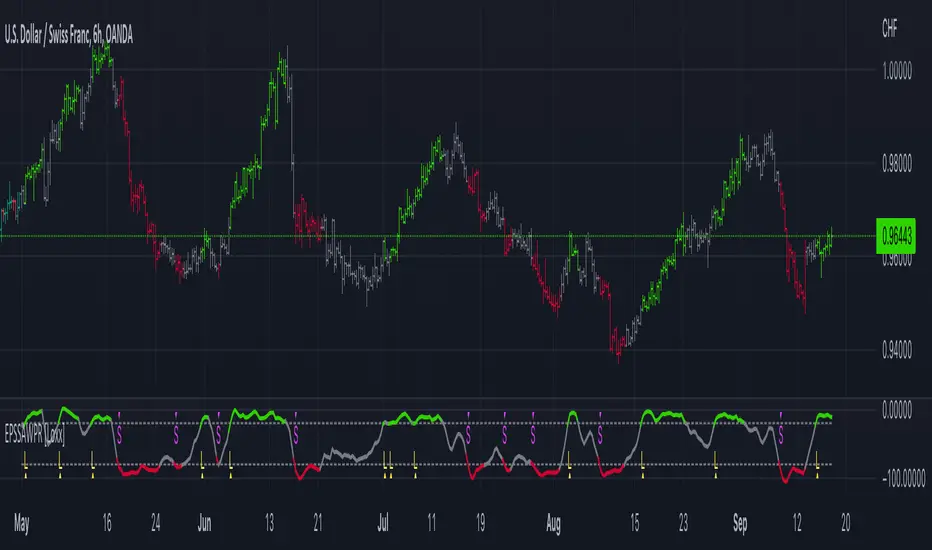
Larry Williams Proxy Index (LWPI) [Loxx]Larry Williams Proxy Index (LWPI) is an indicatory by Larry Williams as explained in his book "Trade Stocks and Commodities with the Insiders: Secrets of the COT Report", pages 129-135. This is an INVERSE indicator, so follow the signals and colors to understand what it's doing. I've added optional smoothing if you wish to smooth the output.
What is the Larry Williams Proxy Index (LWPI)?
The original concept was specifically based on Trader (or Market) Sentiment and predicting market reversals. It's calculated as follows:
MovingAvg(Open-Close, bars used in average)/MovingAvg(Range, bars used in average)*50+50
Included
Bar coloring
Signals
Alerts
