BTC World Price: Multi-Exchange VWAPBTC World Price: Multi-Exchange VWAP
__________________________
WHAT IT DOES
What you see above are not Bitmex candles, but this indicator's.
Bitcoin is listed on multiple exchanges. Many people have called for a single global index that would quote BTC price and volume across all exchanges: this script is such a virtual aggregate (formerly: Multi-Listed , Volume-Weighted Average Price ).
It will, independently for each tick, for any time-frame:
- Quote the price (O, H, L, C) and volume from Bitfinex (USD), Binance (USDT), bitFlyer (Yen), Bithumb (S. Korean Won), Coinbase (USD), Kraken (EUR) and even Bitmex (USD Contracts).
- Weight each price with the corresponding volume of the exchange.
- Quote the FOREX conversion rate in USD for each currency (USDJPY etc.)
- Finally return global average price (candles) in USD.
- Additionally provide (H+L)/2 etc. values.
No more "on Coinbase this" or "on Bitstamp that", you've now got a global overview!
See CoinMarketCap: Markets for reference. I've included alternative exchanges in the comments at the top of the script.
__________________________
HOW TO USE IT
Basically just add it to your chart and use the indicator's candles instead of the chart's main ticker.
By default, BTC World Price will display candles only, but you can also display OHLC & averages (in whichever style you want).
You may indeed want to hide the main symbol (top-left corner, click the 'eye' button next to its name), or switch it to something else than candles/bars (e.g. line).
Make sure "Scale Price Chart Only" is disabled if you want to use the auto-zoom feature. (if other indicators are messing your zoom, you can try to select "Line with Breaks" or "Area with Breaks" to allow these to overflow from the main window)
By clicking the triangle next to the indicator's name, you can select "Visual Order" (e.g "Bring to Front").
You can select regular Candles or Heikin-Ashi in Options.
In the Format > Inputs tab, you can select which exchanges to quote. By default, all of them are enabled.
The script also exposes the following typical values to the backend, which you can use as Price Source for other indicators: (e.g. MA, RSI, in their "Format > Input" tab)
Open Price (grey)
High Price (green)
Low Price (red)
Close Price (white)
(H + L)/2 (light blue)
(H + L + C)/3 (blue)
(O + H + L + C)/4 (purple)
They are all hidden by default (by means of maximum transparency).
In the Format > Style tab, you can change their color, transparency and style (line, area, etc), as well as uncheck Candles and Wicks to hide these.
If you are using "Indicator Last Value" and want to clear the clutter from all these values, simply uncheck them in Style. They will still be available as Price Source for other indicators.
You can also choose to scale it to the left, right (default) or "screen" (no scaling).
Once you're satisfied with your Style, you may click "Default"> "Save as default" in the botton-left. Everytime you load the indicator, it will look the same. ("Reset Settings" will reset to the script's defaults)
__________________________
Please leave feedback below in comments or pm me directly for bugs and suggestions.
Weighted

Elastic Volume Weighted Moving AverageElastic Volume Weighted Moving Average indicator script. This indicator was originally developed by Christian P. Fries (Technical Analysis of Stocks & Commodities, June 2001).

Sine Weighted Moving AverageSine Weighted Moving Average indicator.
The result is very similar to the Triangular Moving Average.

Volume Weighted Average Range Bands [DW]This is an experimental study designed to identify the underlying trend bias and volatility of an instrument over any custom interval TradingView supports.
First, reset points are established at points where the opening price of the interval changes.
Next, Volume Weighted Average Price (VWAP) is calculated. It is the cumulative sum of typical price times volume divided by the cumulative volume. The cumulation starts over upon each reset point.
After that, Volume Weighted Average Range (VWAR) is calculated. The formula structure is the same as VWAP, except using range rather than typical price.
Lastly, the bands are calculated by multiplying the VWAR by the specified multiplier (approximate Golden Ratio by default) and by 1 through 5, then adding to and subtracting from the VWAP.
Custom Bar Colors are included.

Stratus [DW]This is an experimental study designed to identify trend activity, and potential support and resistance areas.
First, Coefficient of Variation Weighted Moving Average (COVWMA) is calculated, and its intersection points are used as anchor values.
Next, a fast period COVWMA calculated for a signal line.
For the cloud, its mid level is calculated first by taking the median of the range between price and the last anchor value.
The upper and lower cloud values are calculated by slicing the range in half two more times on each side. The result looks similar to stratus clouds, hence the name.
Finally, the result is offset by half of the specified period.
Custom bar colors are included.

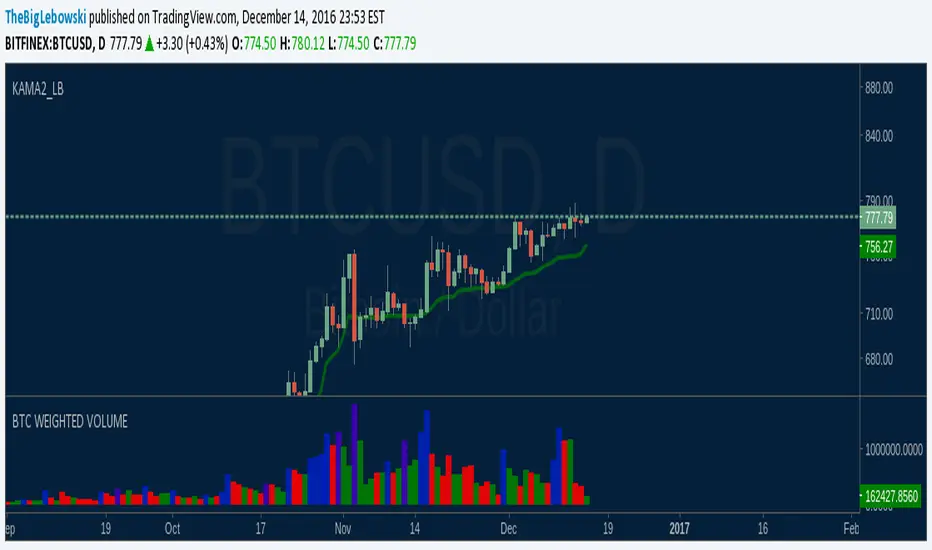
Aggregated BTC VOLUMEAggregated Volume from all major exchanges. Price must touch or drop below pivot but close above it. Volume must break SMA.
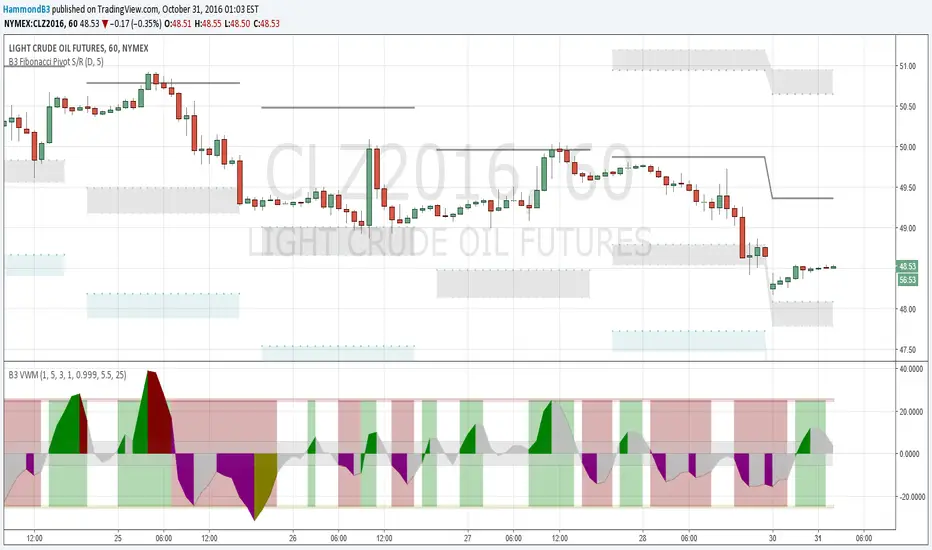
B3 Volume Weighted MomentumB3 VWM is a momentum indicator that responds to the change of price in relationship to volume. In the end the final formula is the classic physics test question of p=mv where p is momentum, m is mass and v is velocity. In this indicator mass is the amount of volume it took to move the price where it did, and velocity is the change in price expressed as a percentage of the bar range. Then, the indicator goes through some filtering to help display the line. Should appear with very little lag work it to find the perfect bar for reversals.
This can be thought of as directional volume times directional momentum index, but truly it is not these literally, as the script doesn't discern how many contracts flew to the bid or to the ask for separation. So with this momentum indicator you can hopefully get a feel of the volume flow, yet still use this like a traditional momentum oscillator. Look to hit the reversals at peaks, and use caution when trading longs when this indicator is negative, and vise versa. There can be divergence in this oscillator, and you can help remedy poor divergences by adjusting the smoothness or the flatness of the indicator to suit your chart. Also the dead zone and mid zone are likely in need of adjustments depending on volume flow and price changes for that symbol and resolution. Defaults are a great starting point for most charts 5m to day. Swing traders might enjoy a length of 8-10 to rid some quick changes of direction in the indicator. Love to have things like this up with pivot studies for level reversal entries, like the few on the shared oil chart.
Enjoy, and I hope you like some of my other proprieties too. Feel free to comment! ~B3
Volume Price Spread Analysis 2With the same idea of the VPSA i make the VPSA2 to make Heiken Ashi style synthetic graph of the price and the volume effect, its easy to see the volume trends. Each instrument have a more clear time frame to see the volume patterns.
I see very useful like a secondary analysis layer. in the graph show the same RSI with price and VPSA2 like source.
Can use others indicators over the VPSA, only write in CAPITAL letters open, high, low, close or hl2 at inputs section.
Ideas, corrections & comments.
They are always welcome.

Volume Price Spread AnalysisWith the same idea of the VSA i make the VPSA to make synthetic graph of the price and the volume effect, its easy to see the volume trends. Each instrument have a more clear time frame to see the volume patterns.
Can use others indicators over the VPSA, only write in CAPITAL letters open, high, low, close or hl2 at inputs section.

Indicator420double hull moving average crossover
hull moving average / volume weighted moving average crossover
Red dot = SELL
Green dot = BUY
or
Longest MA color change to green = BUY
Longest MA color change to red = SELL
by SeaSide420

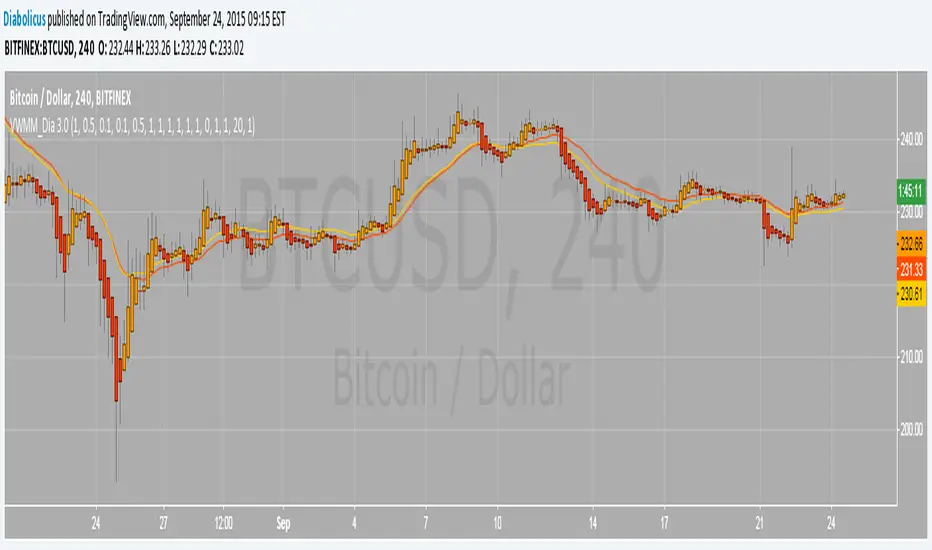
Volume Weighted Market Mean 3.0 [Dia]150924 - v3.0
This script is a complete rewrite of the previous version here .
It gathers market data from up to 8 different Bitcoin exchange pairs (8 is maximum due to script limitations).The influence of each single exchange can be customized individually, default is 50% for 0-fee exchanges, 10% for futures and 100% for all others. For each single exchange a standard deviation from the composite mean price and a average price range are determined. To make data from exchanges with different liquidity comparable, all single exchange price ranges are normalized to the range of the composite mean price. To make data from exchanges with different fee structure (= exchanges that constantly trade at a premium / discount) comparable, all single exchange prices are corrected by their respective standard deviations. To account for trade volume, all price data is weighted by the current candles volume.
- optional Heikin Ashi candle display
- optional EMAs
- lots of switches to play around with ;-)
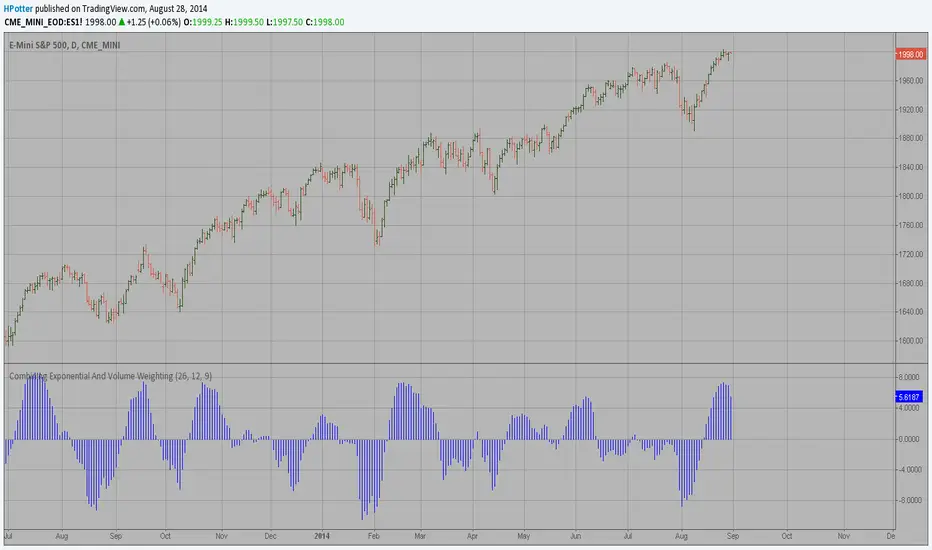
The Volume-Weighted MACD HistogramThe related article is copyrighted material from Stocks & Commodities 2009 Oct