Basic WatermarkBasic Watermark is a lightweight, high-visibility utility designed to provide a clean and professional identification of the symbol and timeframe directly on the chart. Built specifically for Pine Script v6, it is optimized for performance and aesthetics, especially on dark-mode layouts.
Features
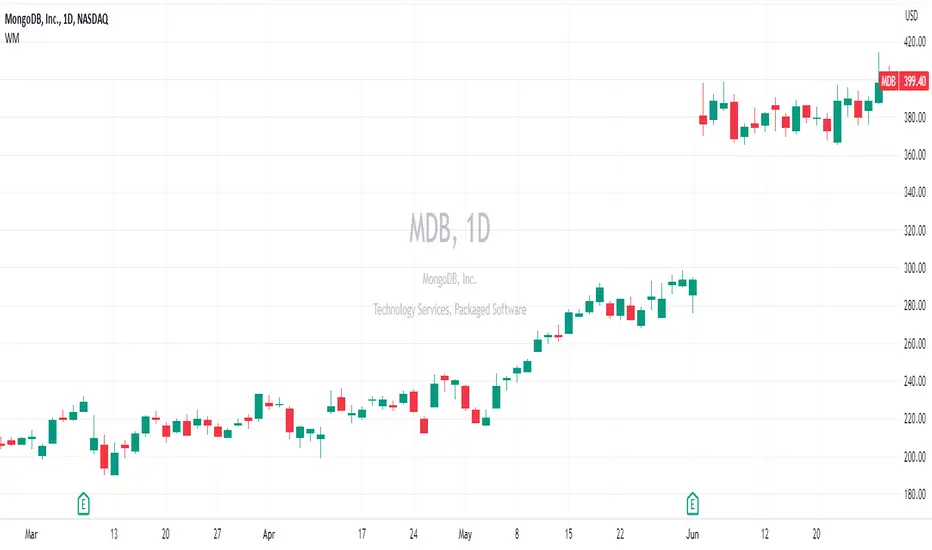
Symbol Focus: Displays the ticker and timeframe in a "Huge" font size by default for instant recognition during fast-paced trading or while recording content.
High-Contrast Blue: Defaulted to a vibrant electric blue to ensure the text pops against dark backgrounds.
Drop Shadow Engine: Includes a logic-driven shadow layer that maintains legibility even when price action or complex indicators overlap with the watermark.
Optional Mantras: Includes a toggleable section for trading reminders (Title/Subtitle) if you wish to display your trading rules or brand.
Settings
Show Symbol Info: Toggle the main ticker on or off.
Vertical/Horizontal Position: Easily move the watermark to any corner or the center of your chart.
Enable Text Shadow: Turn the background depth on or off to suit your visual preference.
Color & Transparency: Fully customizable colors to match your specific chart theme.
Wskaźnik Pine Script®