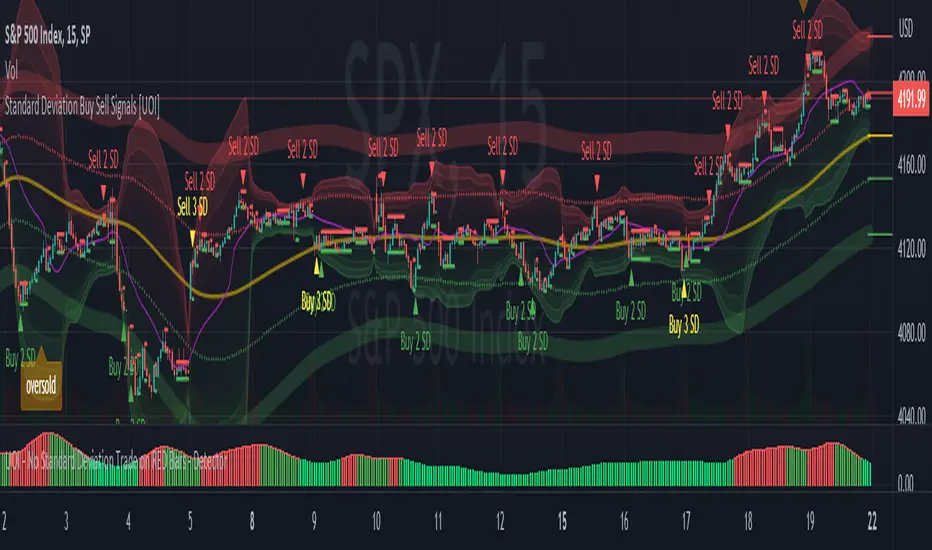
Standard Deviation Buy Sell Signals [UOI]The "Standard Deviation Buy Sell Signals" which is a Mean and VWAP Deviation Super Pack that includes many additional features is an advanced technical analysis tool designed to assist traders in making well-informed decisions in the financial markets. It incorporates various functions and calculations to provide a comprehensive analysis of price movements, trends, and potential trading opportunities in different timeframes. The Super Pack combines elements of volume-weighted average price (VWAP), mean calculation on multiple time frames, standard deviation signals and bands, overbought and oversold signals, measures of central tendency, and multiple time frame calculations of mean reversion. A truly unique indicator.
Here is the details of the supper pack and what is included:
1. VWAP (Volume-Weighted Average Price): The Mean and VWAP Deviation Super Pack includes VWAP, which calculates the average price of a security weighted by its trading volume. This helps traders identify the average price at which a significant amount of trading activity has occurred and can serve as a reference point for determining whether the current price is overvalued or undervalued.
2. Standard Deviation Signals and Bands: The Super Pack incorporates standard deviation signals and bands to measure the volatility of price movements. By calculating the standard deviation of price data, it identifies price levels that deviate significantly from the average, indicating potential overbought or oversold conditions. The standard deviation bands provide visual boundaries that help traders assess the likelihood of a price reversal or continuation. The bands are hidden to avoid too many lines but you can enable them in the setting. See image below:
3. Overbought and Oversold Signals: Using the standard deviation calculations, the Mean and VWAP Deviation Super Pack generates overbought and oversold signals. These signals indicate when a security's price has moved to an extreme level, suggesting a potential reversal or correction in the near future. Traders can use these signals to time their entries or exits in the market. You can change the RSI number in the setting to get more or less signals.
4. Measures of Central Tendency: The Super Pack incorporates measures of central tendency, such as the mean, median, or mode, to provide a sense of the average or typical price behavior. These measures help traders identify the prevailing trend or price direction and assess the likelihood of a trend continuation or reversal. This provide reassurance of whether price is too far from center in multiple time frames.
5. Multiple Time Frame Calculation of Mean Reversion: The Mean and VWAP Deviation Super Pack employs multiple time frame calculations to identify mean reversion opportunities. It compares the current price with the historical average price over different time periods, allowing traders to identify situations where the price has deviated significantly from its mean and is likely to revert back to its average value. This can be useful for swing trading or short-term trading strategies.
By combining these various functions, the Mean and VWAP Deviation Super Pack provides traders with a comprehensive analysis of price dynamics, trend strength, potential reversals, and mean reversion opportunities. It aids in making more informed trading decisions and improving overall trading performance.
Why is this super pack indicator an essential trading strategy for every trader:
Standard deviation and mean reversion are valuable tools for traders, especially when the market is in a ranging phase. A ranging market is characterized by price movements that oscillate between defined support and resistance levels, with no clear trend in either direction. In such market conditions, standard deviation and mean reversion strategies can be particularly effective. Here's why:
1. Standard Deviation: Standard deviation is a statistical measure that quantifies the volatility or dispersion of price data around its average. In a ranging market, where prices tend to fluctuate within a certain range, standard deviation can help identify overbought and oversold levels. When the price reaches the upper end of the range, the standard deviation bands widen, indicating higher volatility and a potential selling opportunity. Conversely, when the price reaches the lower end of the range, the bands narrow, suggesting lower volatility and a potential buying opportunity. Traders can use these signals to anticipate price reversals and take advantage of the predictable nature of ranging markets.
2. Mean Reversion: Mean reversion is a concept that suggests prices tend to move back toward their average or mean over time. In a ranging market, where prices repeatedly move between support and resistance levels, mean reversion strategies can be highly effective. By identifying when the price has deviated significantly from its mean, traders can anticipate a potential reversal back toward the average. When the price reaches extreme levels, indicating overbought or oversold conditions, traders can enter positions in the opposite direction, expecting the price to revert to its mean. Mean reversion strategies can be implemented using various indicators, including Bollinger Bands, moving averages, or standard deviation bands.
3. Range Boundaries: In a ranging market, the upper and lower boundaries of the price range serve as reliable reference points for traders. Standard deviation and mean reversion strategies capitalize on the repetitive nature of price movements within these boundaries. Traders can set their entry and exit points based on the standard deviation bands or mean reversion signals to take advantage of price reversals near the range boundaries. By properly identifying and reacting to these levels, traders can profit from the price oscillations within the range.
4. Risk Management: Standard deviation and mean reversion strategies provide traders with clear entry and exit points, allowing for effective risk management. By placing stop-loss orders beyond the range boundaries or the standard deviation bands, traders can limit their potential losses if the price continues to move against their positions. Additionally, by taking profits near the opposite range boundary or when the price reverts back to the mean, traders can secure their gains and maintain a disciplined approach to trading.
Standard deviation and mean reversion strategies offer traders a systematic approach to capitalize on ranging markets. But the cherry on top is the overbought and oversold signals:
The concept of overbought and oversold levels is widely used in technical analysis to identify potential reversals in price trends. Typically, indicators like the Relative Strength Index (RSI) are employed to determine when an asset may be overbought or oversold. However, you have developed a unique approach by incorporating an interactive variable with RSI and Average True Range (ATR) to create a distinct overbought and oversold signal. Here's why this approach stands out:
1. Divergence: Your approach introduces a divergence concept by combining RSI and ATR. Traditionally, overbought and oversold signals rely solely on RSI readings. However, by considering the interaction between RSI and ATR, you bring a new dimension to these signals. The divergence occurs when the RSI indicates overbought conditions while simultaneously ATR crosses over into bearish territory, or when the RSI signals oversold conditions along with ATR crossing over into bullish territory. This divergence adds an extra layer of confirmation to the overbought and oversold signals.
2. Reduced False Signals: The incorporation of ATR in conjunction with RSI helps filter out false signals that may occur during trending market conditions or short squeezes. Trend days or periods of increased volatility can cause RSI to remain in overbought or oversold territory for an extended period, generating numerous signals that may not be reliable. By considering the crossing of ATR into bearish or bullish territory, your approach adds a dynamic element to the signal generation process. This interactive variable helps ensure that the overbought and oversold signals are not solely based on RSI getting hot, reducing the likelihood of false signals during trending or volatile periods.
3. Improved Timing: The interaction between RSI and ATR provides a more nuanced approach to timing overbought and oversold signals. By waiting for the ATR to confirm the RSI signal, you introduce an additional condition that enhances the precision of the timing. The bearish or bullish crossover of ATR serves as a confirmation that market conditions align with the overbought or oversold signal indicated by RSI. This combined approach allows for more accurate entry or exit points, increasing the potential profitability of trades.
4. Customization and Adaptability: By creating this interactive variable with RSI and ATR, you have developed a customizable approach that can be adapted to different trading styles and preferences. Traders can adjust the sensitivity of the signals by modifying the parameters of the RSI and ATR. This flexibility allows for a personalized trading experience and enables traders to align the signals with their specific risk tolerance and market conditions.
This approach to overbought and oversold signals utilizing RSI and ATR introduces a unique perspective to technical analysis. By incorporating divergence and interactive variables, you enhance the reliability of these signals while reducing false readings. This approach provides improved timing and adaptability, making it a valuable tool for traders seeking to identify potential reversals in price trends with greater accuracy and confidence.
HOW to avoid fake signals?
When it comes to trading with standard deviation as a strategy, it's important to note that on extreme trend days, this indicator may generate false signals. This occurs because standard deviation is primarily designed to measure volatility and deviations from the mean in a range-bound market. During strong trending periods, the price tends to move in one direction with minimal deviations, rendering the standard deviation less effective.
To avoid trading based solely on standard deviation during extreme trend days, it is advisable to incorporate additional indicators that can provide insights into the stock's trend or squeeze conditions. These indicators can help determine whether the market is experiencing a strong trend or a squeeze, allowing you to avoid false signals generated by standard deviation.
By utilizing complementary indicators such as trend-following indicators (e.g., moving averages, trendlines) or volatility indicators (e.g., Bollinger Bands), you can gain a more comprehensive understanding of the market environment. These indicators can help confirm whether the stock is in a trending phase or experiencing a squeeze, helping you avoid entering trades solely based on standard deviation during these extreme trend days.
In summary, while standard deviation is a valuable tool in range-bound markets, it may produce unreliable signals on extreme trend days. By incorporating other indicators that provide insights into the stock's trend or squeeze conditions, traders can better assess the market environment and avoid false signals generated by standard deviation during these periods. This approach enhances the overall effectiveness and accuracy of trading strategies, leading to more informed and profitable decision-making.
UOI
VWAP Xing D, Prv.D, W, Q, M, & Y + SD [UOI]Introducing the "VWAP Xing D, Prv.D, W, Q, M, & Y + SD" Indicator: A Comprehensive, Multi-Timeframe Trading Tool for the Modern Trader
In today's dynamic and fast-paced financial markets, traders require versatile and powerful tools that can help them navigate the complex world of trading. The "VWAP Xing D, Prv.D, W, Q, M, & Y + SD" indicator is designed to be the ultimate, all-in-one solution for traders seeking a comprehensive and robust trading indicator. This cutting-edge tool combines the power of an extensive VWAP library with the versatility of Bollinger Bands, Donchian Channels, standard deviation multi-timeframe analysis, and an auto boxed range identifier, all to provide traders with the crucial insights needed to identify reversals, breakdowns, and breakups.
Offering the magnetic daily, previous day, weekly, monthly, quarterly, and even yearly VWAP levels, this comprehensive library caters to traders with varying time horizons and strategies. Coupled with the precision of Bollinger Bands and Donchian Channels, the indicator allows for accurate tracking of price volatility, enabling traders to make more informed decisions in response to changing market conditions. The integration of multi-timeframe standard deviation analysis further bolsters the indicator's ability to identify potential trading opportunities, ensuring that users can stay ahead of the curve.
Finally, the auto boxed range identifier serves as the cherry on top, automatically detecting critical price levels where reversals, breakdowns, and breakups are most likely to occur. This powerful feature not only helps traders confirm potential entry and exit points but also allows for more effective risk management.
Overall, the "VWAP Xing D, Prv.D, W, Q, M, & Y + SD" indicator is a comprehensive, multi-timeframe trading tool that empowers traders with unparalleled insights, precision, and adaptability. Whether you're a seasoned professional or a novice trader, this powerful indicator is a must-have tool for anyone looking to excel in today's competitive financial markets.
Multi-timeframe Volume Weighted Average
First let's define Volume Weighted Average Price (VWAP):
Volume Weighted Average Price (VWAP) is a widely-used technical analysis indicator that calculates the average price of a security, taking into account both price and trading volume. In essence, it represents the average price at which a security has been traded throughout a specified time period, giving more weight to transactions with higher volume.
The VWAP is often used by traders and investors to assess the market's trend and gauge the relative value of a security. It serves as a benchmark for institutional investors, who often use it to evaluate their trading performance and determine whether they are buying or selling at favorable prices.
The formula for calculating VWAP is:
VWAP = (Sum of (Price * Volume)) / Total Volume
By incorporating volume into the calculation, the VWAP provides a more accurate representation of a security's true average price, as it takes into consideration the impact of larger trades on the price. This makes it a valuable tool for traders seeking to make more informed decisions in the market and avoid getting caught in unfavorable trading positions.
VWAP is a crucial indicator that provides insights into the average price at which a financial asset, such as a stock or cryptocurrency, has been traded throughout a specific period. It takes into consideration the volume of trades executed at each price level during that period. The VWAP lines included in the " VWAP Xing D, Prv. D, W, Q, M, & Y" indicator offer various timeframe perspectives, allowing traders to analyze different levels of market trends and behaviors.
Here's a detailed explanation of the VWAP lines and their significance:
1. Daily VWAP (D): The daily VWAP line represents the average price at which the asset has been traded throughout the current trading day. It resets at the beginning of each trading session. Traders often use the daily VWAP as a reference point to gauge the fairness of their trade executions relative to the prevailing market prices. Price deviations from the daily VWAP can indicate shifts in market sentiment and potential trading opportunities.
2. Previous Day VWAP (Prv.D): The previous day VWAP line reflects the average price at which the asset was traded during the preceding trading day. It helps traders assess the continuity or deviation of the current day's price action relative to the previous day's trading activity. Traders often observe the previous day VWAP for insights into potential support or resistance levels and to identify whether the current day's price is trading above or below the previous day's average price.
3. Weekly VWAP (W): The weekly VWAP line calculates the average price of the asset over the entire week, taking into account the volume traded at each price level. Traders use the weekly VWAP to gain a broader perspective on the asset's price movement and potential trend directions. It can act as a significant support or resistance level, especially when the price interacts with the weekly VWAP.
4. Monthly VWAP (M): The monthly VWAP line provides a longer-term perspective by averaging the asset's price and volume data over the entire month. It helps traders identify key price levels that are significant within the monthly timeframe. Traders often observe the monthly VWAP to assess the overall trend and to determine whether the current price is trading above or below the monthly average.
5. Quarterly VWAP (Q): The quarterly VWAP line calculates the average price and volume data over a three-month period, representing a longer-term view of market activity. Traders use the quarterly VWAP to identify significant price levels and to analyze the broader trend within the quarterly timeframe. Deviations from the quarterly VWAP can indicate potential shifts in market sentiment and trading opportunities.
6. Yearly VWAP (Y): The yearly VWAP line represents the average price and volume data over the course of a year. It offers a comprehensive long-term perspective on the asset's price behavior and trend. Traders often consider the yearly VWAP as a key reference point for assessing the asset's overall performance and identifying major support or resistance levels.
By observing the VWAP lines, traders can gain insights into the prevailing market sentiment, potential support or resistance levels, and deviations from average prices. These deviations can be useful for identifying potential trading opportunities, such as when the price significantly deviates from the VWAP lines, suggesting potential overbought or oversold conditions. Additionally, VWAP can serve as a benchmark for evaluating trade executions and assessing the fair value of an asset.
It's important to note that while VWAP is a valuable tool, it should be used in conjunction with other technical analysis indicators and strategies to make informed trading decisions. Traders should consider factors like market context, trend analysis, and risk management principles to validate signals and confirm potential trading opportunities.
Bollinger Bands and Donchian Channels
In addition to VWAP this indicator also has combined the power of Bollinger Bands and Donchian Channels to produce a solid framework. The time frame by default is set to 30 min which is good for intraday trading but you can also change that in the setting to always use chart time frame intervals which works better on longer time frames.
IMPORTANT: You can change the time frame to always use chart or keep the default on 30 min or change it to another timeframe manually. If you allow the chart to always provide the intervals then the default 30 min will be ineffective and it automatically adjust to chart timeframe. Personally I think a fixed timeframe work better so keep in that way if you trade on 30 min or lower time frame.
Bollinger Bands and Donchian Channels are two popular technical analysis tools that provide valuable insights into price volatility, potential breakout levels, and support/resistance areas. When used in combination, they offer a comprehensive framework for analyzing market conditions and identifying trading opportunities.
Bollinger Bands: Bollinger Bands consist of two lines plotted above and below a moving average, typically a simple moving average (SMA). The upper band is calculated by adding the standard deviation of price multiplied by a customizable standard deviation factor to the SMA. The lower band is calculated by subtracting the standard deviation multiplied by the same factor from the SMA. The key features of Bollinger Bands are as follows:
1. Volatility Measurement: Bollinger Bands expand and contract based on market volatility. When the bands widen, it indicates higher volatility, and when they narrow, it suggests lower volatility. Traders can observe the width of the bands to gauge the potential for price movements and volatility expansions.
2. Overbought/Oversold Levels: Bollinger Bands can help identify overbought and oversold conditions in the market. When the price reaches or exceeds the upper band, it may indicate that the asset is overbought and due for a potential reversal or pullback. Conversely, when the price reaches or falls below the lower band, it may suggest oversold conditions and a possible bounce or reversal.
Donchian Channels: Donchian Channels consist of two lines representing the highest high and lowest low within a specified period. The key characteristics of Donchian Channels are as follows:
1. Breakout Levels: The upper line of the Donchian Channel represents the highest high within the specified period, while the lower line represents the lowest low. Traders often use Donchian Channels to identify potential breakout levels. When the price breaks above the upper channel line, it may indicate a bullish breakout and the potential for further upward momentum. Conversely, a break below the lower channel line suggests a bearish breakout and the possibility of downward momentum.
2. Support/Resistance Areas: Donchian Channels also act as dynamic support and resistance levels. The upper channel line can act as a resistance level where the price may encounter selling pressure. The lower channel line can act as a support level where the price may find buying interest. Traders can monitor price interactions with these levels to make informed trading decisions.
Advantages of Using Bollinger Bands and Donchian Channels Together: By combining Bollinger Bands and Donchian Channels, traders can gain a more comprehensive view of market conditions and potential trading opportunities. Here are some advantages of using them together:
1. Volatility Confirmation: Bollinger Bands help identify periods of high or low volatility, while Donchian Channels confirm breakouts and potential trend changes. When the bands widen and a breakout occurs above or below the Donchian Channels, it can provide confirmation of increased volatility and the start of a new trend.
2. Price Extremes and Breakouts: Bollinger Bands assist in identifying overbought and oversold conditions, while Donchian Channels help pinpoint breakout levels. When price reaches an extreme level according to Bollinger Bands and coincides with a breakout from the Donchian Channels, it can signal a significant trading opportunity.
3. Support/Resistance Validation: Donchian Channels act as dynamic support and resistance levels, and Bollinger Bands can validate these levels. When price bounces off the upper or lower Bollinger Band near a Donchian Channel level, it provides additional confirmation of the support or resistance area.
4. Risk Management: The combination of Bollinger Bands and Donchian Channels enables traders to set more precise stop-loss levels and define risk. They can place stop-loss orders beyond the support or resistance levels identified.
Standard Deviation
Standard deviation bands by default are disabled but you can easily enable them in the setting. The 1 standard deviation bands are made invisible by default to avoid a crowded space. You can reduce the transparency to view them.
In intraday trading, the Daily VWAP (Volume Weighted Average Price) with 3 standard deviations is a powerful tool that helps traders gauge price movements and potential trading opportunities. Here's how it works and why it is useful:
1. Calculation of Daily VWAP: The Daily VWAP is the average price at which a security has traded throughout the trading day, weighted by the volume of each trade. It provides a measure of the average price that traders have paid for the asset during the day.
2. Standard Deviation: Standard deviation is a statistical measure that quantifies the dispersion or variability of prices around the Daily VWAP. It gives an indication of how much prices deviate from the average. A higher standard deviation suggests greater price volatility.
3. Three Standard Deviations: By adding and subtracting three times the standard deviation from the Daily VWAP, you create bands that represent the potential price range within which the majority of intraday trading activity is expected to occur. These bands act as potential support and resistance levels and help traders identify price extremes.
4. Price Reversals: When the intraday price extends beyond the upper or lower band (three standard deviations), it suggests an overextended move or potential price reversal. Traders interpret this as an opportunity to enter or exit trades. If the price moves beyond the upper band, it may indicate overbought conditions and a possible reversal to the downside. Conversely, if the price moves below the lower band, it may signal oversold conditions and a potential reversal to the upside.
5. Volatility and Breakouts: Intraday traders often look for volatility and breakout opportunities. The three standard deviation bands on the Daily VWAP provide valuable information about price volatility. When the price breaks out of the bands, it suggests a significant increase in volatility and potential opportunities for intraday traders to take advantage of strong momentum moves.
6. Risk Management: The three standard deviation bands help traders define their risk and set stop-loss orders. By placing stop-loss orders outside the bands, traders can protect their positions in case the price moves beyond the expected range. This risk management technique allows traders to limit their potential losses and preserve capital.
7. Confirmation with Other Indicators: Intraday traders often use the three standard deviation bands on the Daily VWAP in conjunction with other technical indicators or chart patterns to strengthen their trading decisions. The bands can validate other signals or provide additional confirmation before entering or exiting a trade.
Overall, the Daily VWAP with three standard deviations is a valuable tool for intraday traders as it helps identify price extremes, potential reversals, volatility, and breakout opportunities. By incorporating this indicator into their trading strategies, traders can make more informed decisions and enhance their intraday trading performance.
Auto Boxed Range Detector
The true innovation in the "VWAP Xing D, Prv.D, W, Q, M, & Y + SD" indicator lies in the integration of the sophisticated 'Auto Boxed Range Detector.' This feature serves as the cornerstone of the tool's enhanced functionality, shedding light on critical price ranges to give traders a distinct advantage when identifying potential breakouts or breakdowns.
Meticulously designed with the needs of traders in mind, the Auto Boxed Range Detector automates the process of pinpointing trading ranges, resulting in increased precision and swiftness in your decision-making. By automating this crucial aspect of technical analysis, traders can now focus on other essential factors, ultimately maximizing their trading efficiency.
Furthermore, the Auto Boxed Range Detector helps traders avoid falling prey to false breakouts. By identifying the top of the boxed range in relation to resistance levels, users can more accurately predict the likelihood of a breakout. For instance, if the top of the boxed range is situated near a resistance line, the chances of a breakout are diminished unless the market is experiencing a trend day.
In essence, the Auto Boxed Range Detector not only streamlines the identification of trading ranges but also provides invaluable insights into the validity of potential breakouts or breakdowns. This innovative feature makes the "VWAP Xing D, Prv.D, W, Q, M, & Y + SD" indicator an indispensable tool for traders seeking to capitalize on opportunities while minimizing risk in today's fast-paced financial markets.
Once you get used to this tool it will be an integral part of your trading.
