Volume Imbalances & Gann's Square IndicatorVolume Imbalances & Gann's Square Indicator:
This script is a comprehensive trading toolkit designed to help intraday and swing traders identify high-probability trade setups by combining the strengths of Gann's Theory, price-volume analysis, and multi-indicator signal confirmation in one indicator.
Key Features and Their Roles:
Gann’s S/R Levels:
Calculates main and auxiliary support/resistance lines using Gann’s “odd square” approach based on the current price. Levels are projected historically and into the future to clearly visualize critical zones for potential reversals and breakouts.
Volume*Price (VP) Spike Table:
Detects and displays real-time buy and sell volume spikes above a configurable threshold, highlighting large market transactions. The on-chart table summarizes recent major spikes with time and price for context, resetting every session.
Multi-EMA & VWAP Logic:
Integrates three customizable EMAs, VWAP, and Supertrend. Users can toggle signals from EMA crossovers, price-VWAP positioning, or Supertrend direction to match their preferred trading style and filter signals for trend or mean-reversion strategies.
Buy/Sell Labels and Signal Source Control:
Clearly plots buy/sell marker labels with customizable text, color, and size, based on the chosen signal source (EMA cross, VWAP, Supertrend). Labels offset from candles for easy visibility.
First Candle Range & Session Tools:
Plots the initial range (high, low, and midpoint) of a user-defined session, helping visualize and trade session breakouts or range retests. Session logic ensures all statistical tables and levels reset at session start.
Automated Risk/Reward Table:
Instantly calculates capital allocation, stop-loss, potential quantity, and two profit targets for both long and short trades. Helps traders plan size and risk per trade in compliance with risk management principles.
Highest/Lowest VP Markers:
Highlights the day’s peak and trough volume*price values for context on institutional buying or selling pressure.
Previous Day Range Plotter:
Draws previous session’s high/low levels for reliable reference zones and potential trade targets.
Integration Rationale:
All components are thoughtfully integrated to provide a holistic decision-making workflow:
Volume/price spikes act as momentum or liquidity signals.
Gann levels define the “where” for reaction or breakout trades.
Signal logics (EMA/VWAP/Supertrend) answer the “when,” enabling higher-confidence entries only when multiple conditions align.
How to Use:
Select your preferred inputs for EMAs, VWAP, and risk settings in the panel.
Analyze the chart for signals where buy/sell labels align with fresh VP spikes near Gann or previous day support/resistance.
Use the risk/reward table for strict money management.
Reference spike tables and session range for contextual confirmation.
Visuals and Chart Guidance:
The script displays only essential tables, lines, and labels described above.
All chart elements are explained in this description—no external scripts needed for interpretation.
Each table and marker is linked to actionable trading logic, eliminating clutter.
Closed-source Explanation:
The indicator uses session-based calculations, real-time data arrays, and proprietary math to unify Gann theory logic, large transaction detection, and multi-indicator confirmation. All major trade conditions have alert signals for ready integration with TradingView’s alert system.
Trendidentification

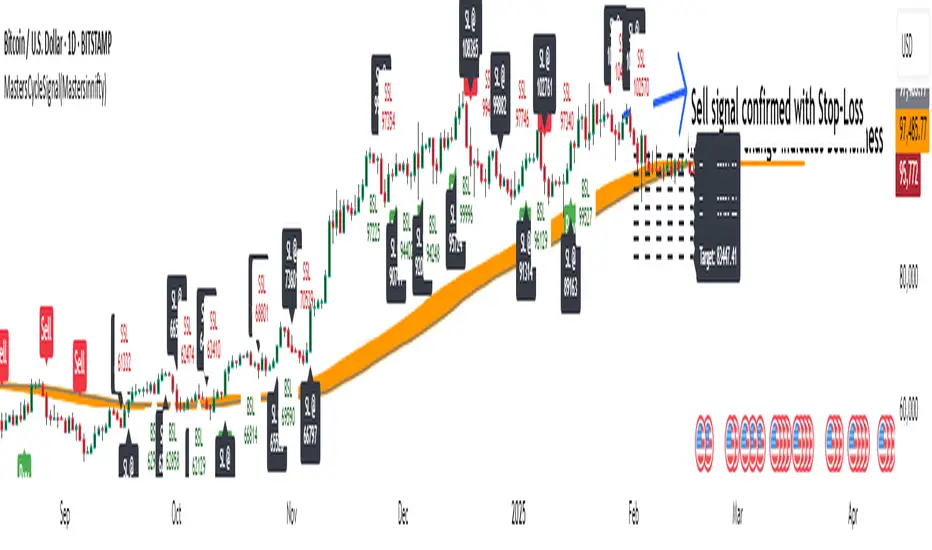
MastersCycleSignal(Mastersinnifty)Overview
MastersCycleSignal is a high-precision market timing and projection indicator for trend-following and swing traders.
It combines an adaptive cycle detection algorithm, forward-looking sine wave projections, dynamic momentum confirmation, and Gann Square of 9-based geometric targets into a complete structured trading framework.
The script continuously analyzes price oscillations to detect dominant cycles, projects expected price behavior with future-facing sine approximations, and generates buy/sell signals once confirmed by adaptive momentum filtering.
Upon confirmation, it calculates mathematically consistent Gann-based target levels and risk-managed stop-loss suggestions.
Users also benefit from auto-extending targets as price action unfolds — helping traders anticipate rather than react to market shifts.
---
Uniqueness
MastersCycleSignal stands apart through a unique fusion of techniques:
- Dynamic Cycle Detection
- Detects dominant cycles using a cosine correlation maximization method between detrended price (close minus SMA) and theoretical cosine curves, dynamically recalibrated across a sliding window.
- Sine Wave Future Projection
- Smooths and projects future price paths by approximating a forward sine wave based on the real-time detected dominant cycle.
- Adaptive Momentum Filtering
- Volatility is scaled by divergence between normalized returns and a 5-period EMA, further adjusted by an RSI(2) factor.
- This makes buy/sell signal confirmation robust against noise and false breakouts.
- Gann-Based Target Computation
- Uses a square-root transformation of price, incremented by selectable Gann Square of 9 degrees, for calculating progressive and dynamically expanding price targets.
- Auto-Extending Targets
- As price achieves a projected target, the system automatically draws subsequent new targets based on the prior target differential — providing continuous guidance in trending conditions.
---
Usefulness
MastersCycleSignal is built to help traders:
- Identify early trend reversals through cycle shifts.
- Forecast probable price paths in advance.
- Plan systematic target and stop-loss zones with geometric accuracy.
- Reduce guesswork in trend-following and swing trading.
- Maintain structured discipline across intraday, swing, and positional strategies.
It works seamlessly across stocks, indices, forex, commodities, and crypto markets — on any timeframe.
---
How to Use
- Attach the indicator to your desired chart.
- When a Buy Signal or Sell Signal appears (green or red markers):
- Use the attached stop-loss labels to manage risk.
- Monitor the automatically plotted target lines for partial exits or full profits.
- The orange projected sine wave illustrates the expected future market path.
- Customization Options:
- Cycle Detection Length — adjust to fine-tune cycle sensitivity.
- Projection Length — modify the forward distance of sine wave forecast.
- Gann Square of 9 Degrees — personalize target increments.
- Toggle Signals and Target visibility as needed.
---
Disclaimer
- MastersCycleSignal uses no future data or lookahead bias.
- All projections are based on geometric extrapolations from historical price action — not guaranteed predictions.
- Trading involves risks, and historical cycle behavior may differ in future conditions.
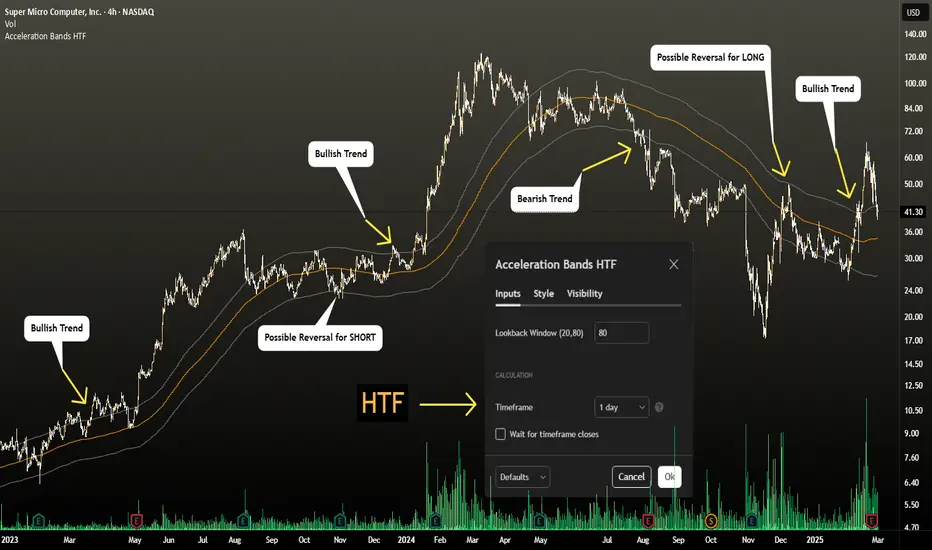
Acceleration Bands HTF
This version gives you the ability to see the indicator from the HIGHER timeframes when you are on the timeframes. Please note that this is not the original formula, but a factored one that I found effective for identifying market trends. Thanks to @capissimo who provided the base open-code.
Acceleration Bands are designed to capture potential price breakouts or reversals in an asset. They are calculated based on a stock's price movements over a specified period, typically using the high, low, and closing prices. The idea is to identify moments when the price is accelerating (hence the name) beyond its normal range, which might indicate the beginning of a new trend.
Calculation
Acceleration Bands consist of three lines:
Upper Band (AB Upper): This is calculated by adding a certain percentage of the simple moving average (SMA) to the highest high over a given period.
Middle Band: This is typically the SMA of the stock's price.
Lower Band (AB Lower): This is calculated by subtracting the same percentage of the SMA from the lowest low over a given period.
Mathematically :
AB Upper = SMA + (Highest High * Percentage)
AB Lower = SMA - (Lowest Low * Percentage)
OR
Upper Band = SMA x (1 + (High - Low) / SMA)
Lower Band = SMA x (1 - (High - Low) / SMA)
Interpretation
The bands are used to identify periods when the price of a security is accelerating or decelerating:
Breakout Above Upper Band: This is usually considered a bullish signal, suggesting that the price is accelerating upwards and a new uptrend may be starting.
Breakdown Below Lower Band: This is usually considered a bearish signal, suggesting that the price is accelerating downwards and a new downtrend may be starting.
Reversal Between Bands: When the price re-enters the region between the bands after breaking out, it can be seen as a potential reversal signal.
Trading Strategy
Entry Signals:
Buy when the price breaks above the upper band.
Sell or short when the price breaks below the lower band.
Exit Signals:
Close a long position when the price falls back into the area between the bands.
Close a short position when the price rises back into the area between the bands.
Advantages
Helps capture early trends.
Can be used across various time frames and assets.
Provides clear entry and exit signals.
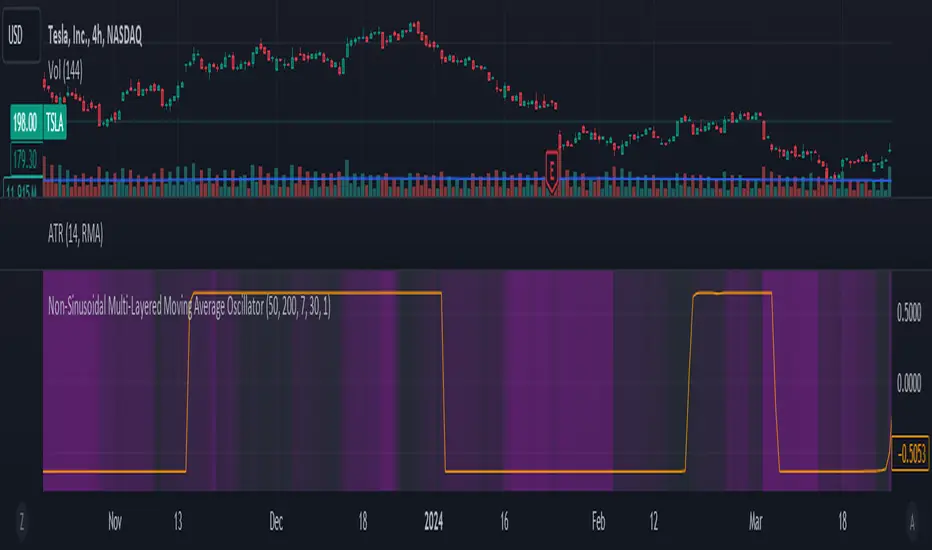
Non-Sinusoidal Multi-Layered Moving Average OscillatorThis indicator utilizes multiple moving averages (MAs) of different lengths their difference and its rate of change to provide a comprehensive view of both short-term and long-term market trends. The output signal is characterized by its non-sinusoidal nature, offering distinct advantages in trend analysis and market forecasting.
Combining the difference between two moving averages with the ROC allows to assess not only the direction and strength of the trend but also the momentum behind it. Transforming these signal in to non-sinusoidal output enhances its utility.
The indicator allows traders to select any one or more of seven moving average options. Larger timeframes (e.g., MA89/MA144) provide a broader identification of the overall trend, helping to understand the general market direction. Smaller timeframes (e.g., MA5/MA8) are more sensitive to price changes and can indicate better entry and exit points, aiding in the identification of retracements and pullbacks. By combining multiple timeframes, traders can get a comprehensive view of the market, enabling more precise and informed trading decisions.
Key Features:
Multiple Moving Averages:
The indicator calculates several exponential moving averages (EMAs) based on different lengths: MA5, MA8, MA13, MA21, MA34, MA55, MA89, and MA144.
These MAs are further smoothed using a secondary exponential moving average, with the smoothing length customizable by the user.
Percentage Differences:
The indicator computes the percentage differences between successive MAs (e.g., (MA5 - MA8) / MA8 * 100). These differences highlight the relative movement of prices over different periods, providing insights into market momentum and trend strength.
Short-term MA differences (e.g., MA5/MA8) are more sensitive to recent price changes, making them useful for detecting quick market movements.
Long-term MA differences (e.g., MA89/MA144) smooth out short-term fluctuations, helping to identify major trends.
Rate of Change (ROC):
The indicator applies the Rate of Change (ROC) to the percentage differences of the MAs. ROC measures the speed at which the percentage differences are changing over time, providing an additional layer of trend analysis.
ROC helps in understanding the acceleration or deceleration of market trends, indicating the strength and potential reversals.
Transformations:
The percentage differences undergo a series of mathematical transformations (either inverse hyperbolic sine transformation or inverse fisher transformation) to refine the signal and enhance its interpretability. These transformations include adjustments to stabilize the values and highlight significant movements.
checkbox allows users to select which mathematical transformations to use.
Non-Sinusoidal Nature:
The output signal of this indicator is non-sinusoidal, characterized by abrupt changes and distinct patterns rather than smooth, wave-like oscillations.
The non-sinusoidal signal provides clearer demarcations of trend changes and is more responsive to sudden market shifts.
This nature reduces the lag typically associated with sinusoidal indicators, allowing for more timely and accurate trading decisions.
Customizable Options:
Users can select which MA pairs to include in the analysis using checkboxes. This flexibility allows the indicator to adapt to different trading strategies, whether focused on short-term movements or long-term trends.
Visual Representation:
The indicator plots the transformed values on a separate panel, making it easy for traders to visualize the trends and potential entry or exit points.
Usage Scenarios:
Short-Term Trading: By focusing on shorter MAs (e.g., MA5/MA8), traders can capture quick market movements and identify short-term trends.
Long-Term Analysis: Utilizing longer MAs (e.g., MA89/MA144) helps in identifying major market trends.
Combination of MAs: The ability to mix different MA lengths provides a balanced view, helping traders make decisions based on both immediate price actions and overall market direction.
Practical Benefits:
Early Signal Detection: The sensitivity of short-term MAs provides early signals for potential trend changes, assisting traders in timely decision-making.
Trend Confirmation: Long-term MAs offer stable trend confirmation, reducing the likelihood of false signals in volatile markets.
Noise Reduction: The mathematical transformations and ROC applied to the percentage differences help in filtering out market noise, focusing on meaningful price movements.
Improved Responsiveness: The non-sinusoidal nature of the signal allows the indicator to react more quickly to market changes, providing more accurate and timely trading signals.
Clearer Trend Demarcations: Non-sinusoidal signals make it easier to identify distinct phases of market trends, aiding in better interpretation and decision-making.