Analizy Trendu
Twisted Forex's Doji + Area StrategyTitle
Twisted Forex’s Doji + Area Strategy
Description
What this strategy does
This strategy looks for doji candles forming inside or near supply/demand areas . Areas are built from swing pivots and sized with ATR, then tracked for retests (“confirmations”). When a doji prints close to an area and quality checks pass, the strategy places a trade with the stop beyond the doji and a configurable R:R target.
How areas (zones) are built
• Swings are detected with a user-set pivot length.
• Each swing spawns a horizontal area centered at the pivot price with half-height = zoneHalfATR × ATR .
• Duplicates are de-duplicated by center distance (ATR-scaled).
• Areas fade when broken beyond a buffer or after an optional age (expiry).
• Retests are recorded when price touches and then bounces away from the area; repeated reactions increase the zone’s “strength”.
Signal logic (summary)
Doji detection: strict or loose body criteria with optional minimum wick fractions and ATR-scaled minimum range.
Proximity: price must be inside/near a supply or demand area (proxATR × ATR).
Side resolution: overlap is resolved by (a) which side price penetrates more, (b) fast/slow EMA trend, or (c) nearest distance. Optional “previous candle flip” can bias long after a bearish candle and short after a bullish one.
Optional 1-bar confirmation: the bar after the doji must close away from the area by confirmATR × ATR .
Quality filter (Off/Soft/Strict): four checks—(i) wick rejection past the edge, (ii) doji closes in an edge “band” of the area, (iii) fresh touch (cooldown), (iv) approach impulse over a short lookback. In Strict , thresholds auto-tighten.
Orders & exits
• Long: stop below doji low minus buffer; Short: above doji high plus buffer.
• Target = rrMultiple × risk distance .
• Pyramiding is off by default.
Position sizing
You can size from the script or from Strategy Properties:
• Script-driven (default): set Position sizing = “Risk % of equity” and choose riskPercent (e.g., 1.0%). The script applies safe floors/rounding (FX micro-lots by default) so quantity never rounds to zero.
• Properties-driven : toggle Use TV Properties → Order size ON, then pick “Percent of equity” in Properties (e.g., 1%). The header includes safe defaults so trades still place.
Key inputs to explore
• Zone building : pivotLen, zoneHalfATR, minDepartureATR, expiryBars, breakATR, leftBars, dedupeATR.
• Doji & proximity : strictDoji, dojiBodyFrac, minWickFrac, minRangeATR, proxATR, minBarsBetween.
• Overlap resolution : usePenetration, useTrend (EMA 21/55), “previous candle flip”, needNextBarConf & confirmATR.
• Quality : qualityMode (Off/Soft/Strict), minQualPass/kStrict, wickPenATR, edgeBandFrac, approachLookback, approachMinATR, freshTouchBars.
• Zone strength gating : minStrengthSoft / minStrengthStrict.
• HTF confluence (optional) : useHTFTrend (HTF EMA 34/89) and/or useHTFZoneProx (HTF swing bands).
Tips to make it cleaner / higher quality
• Turn needNextBarConf ON and use confirmATR = 0.10–0.15 .
• Increase approachMinATR (e.g., 0.35–0.45) to require a stronger pre-touch impulse.
• Raise minStrengthSoft/Strict (e.g., 4–6) so only well-reacted zones can signal.
• Use signalsOnlyConfirmed ON if you prefer trades only from zones with retests (the script falls back gracefully when none exist yet).
• Nudge proxATR to 0.5–0.6 to demand tighter proximity to the level.
• Optional: enable useHTFTrend to filter counter-trend setups.
Default settings used in this publication
• Initial capital: 100,000 (illustrative).
• Slippage: 1 tick; Commission: 0% (you can raise commission if you prefer—spread is partly modeled by slippage).
• Sizing: Risk % of equity via inputs; riskPercent = 1.0% ; FX uses micro-lot floors by default.
• Quality: Off by default (Soft/Strict available).
• HTF trend gate: Off by default.
Backtesting notes
For a meaningful sample size, test on liquid symbols/timeframes that yield 100+ trades (e.g., majors on 5–15m over 1–2 years). Backtests are modelled and broker costs/spread vary—validate on your feed and forward-test.
How to read the chart
Shaded bands are supply (above) and demand (below). Brighter bands are the nearest K per side (visual aid). BUY/SELL labels mark entries; colored dots show entry/SL/TP levels. You can hide zones or unconfirmed zones for a cleaner view.
Disclaimer
This is educational material, not financial advice. Trading involves risk. Always test and size responsibly.

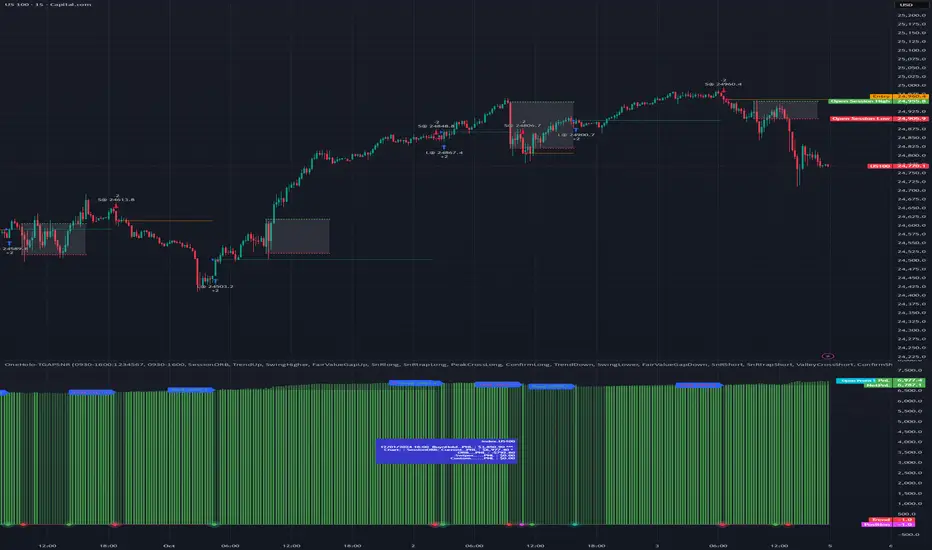
OneHolo-TGAPSNRTGAPSNR: Multi time frame - Trend Gap Stop And Reverse strategy/Study PnL. This script outlines a systematic approach to generating buy and sell signals by combining Fair Value Gaps (FVGs), specific market structures, and three different trend direction methods (Swing, Gravity, and FVG Inverse direction). The strategy incorporates multiple entry modes, such as Hyper Mode, Swiper Mode, and a Custom mode, allowing users to tailor signal conditions, alongside extensive logic for trade management, higher time frame analysis, and various visual indicators for plotting trend, pivots, and profit and loss information.
I. Core Trend Direction Consensus (The Three-Pillar System)
The primary method for determining market bias is a three-pillar consensus model, requiring all directional methods to align before the overall Trend Direction is established (up or down). This ensures high conviction for trend signals.
• Pillar 1: Swing Direction: Determines market direction based on classic price action, specifically checking for continuous higher highs and higher lows for an upward bias, or lower lows and lower highs for a downward bias.
• Pillar 2: Gravity Direction (Peak and Valley): This uses specific market structure pivots. Direction is set based on whether the close price successfully crosses the established recent Peak High (indicating upward momentum) or crosses under the recent Valley Low (indicating downward pressure).
• Pillar 3: FVG Inverse Direction: This relies on Fair Value Gaps (FVGs), defined as a gap between the current bar's price and the price two bars prior. Direction shifts occur when the Close price crosses the midpoint of the last relevant FVG. For instance, crossing above the midpoint of the last FVG Down signals a potential inverse long trade.
II. Flexible Signal Generation Modes
The strategy offers several pre-configured and highly detailed entry modes, plus a powerful Custom Mode:
• Session Open Range Break (ORB) Mode: Uses the high/low of the session's first bar to generate initial signals, then defaults to the Three-Pillar Trend Direction after the ORB session concludes.
• Swiper Mode: Designed to identify continuations, combining a confirmed Trend Direction with a Stop and Reverse signal (SnR) while actively avoiding confirmed pivot breaks.
• Hyper/Aggressive Modes: These modes use broad combinations of signals, allowing for earlier entry based on momentum and structural breaks (like PeakCrossLong, SnRtrapLong, or FVG signals).
• Custom Query Mode (The Seven-Slot Logic): This non-redundant system allows the user to define complex, tailored entry conditions by selecting any combination of 14 core patterns across seven distinct slots.
◦ AND/OR Combination: For each of the seven slots, the user determines if the chosen pattern must be met (AND component) or if it can serve as an alternative trigger (OR component).
◦ The final signal requires that all configured AND conditions are true and then integrates the result of the OR conditions, allowing for highly specific "hook queries" (e.g., "Condition A AND Condition B, OR Condition C").
III. Advanced PnL and Mobile App Diagnostics
A key proprietary element is the implementation of a dual PnL system and customized visualization features:
• Dual PnL Display (Strategy PnL vs. Study PnL): Users can choose to view either the native platform's strategy performance data or the script's internal, proprietary Study PnL. The Study PnL calculates profits/losses based strictly on the close price and tracks performance using Pine Script® arrays, providing a transparent, diagnostic view of performance independent of broker/platform simulation biases.
• Lower Panel Visualization: Both PnL types are displayed on the lower panel using detailed bar plots (style=plot.style_columns), which color according to profitability, and include labels that show current open profit and total net profit.
• Detailed Trade Labels: The script generates detailed, customizable labels on both the chart (above/below bars) and the lower PnL panel, providing historical PnL, number of trades, and real-time profit information for each entry or exit.
IV. Higher Time Frame (HTF) Context and Lookahead Prevention
The strategy integrates multi-time frame analysis using strict methodology to prevent lookahead bias:
• HTF Bias Filtering: When enabled, the strategy uses the position calculated on a user-defined higher time frame (HTF) as a mandatory filter. A long signal on the current chart is only executed if the HTF is also in a long position, and vice-versa.
• Lookahead Prevention: To maintain integrity, all HTF data requests use a mandatory lookback index (often ) to ensure the script only accesses confirmed data from the prior completed bar on the higher timeframe.
• HTF Visual Mode: The user can opt to display key structural elements—such as the Gravity Pivots and the Trend Direction blocks—as calculated on the HTF, overlaying this higher-level context onto the current chart for visual analysis.
The TGAPSNR: Multi time frame - Trend Gap Stop And Reverse strategy/Study PnL script, despite its complexity, intentionally excludes realistic considerations such as fees, slippage, and explicit risk management settings (like fixed stop-loss or take-profit rules) from its primary logic.
Here is an explanation of why these elements are omitted in the strategy's current implementation and why they must be applied by the user for real-world application, drawing on the context of the sources:
1. Absence of Realistic Fees, Commissions, and Slippage
The primary function of the TGAPSNR script is to execute intricate signal generation and diagnostic PnL calculation based on its three-pillar trend system and Custom Mode logic.
However, the strategy's backtesting results, particularly those displayed by the internal Study PnL feature, are based purely on price difference (e.g., (close - lse) * syminfo.pointvalue * IUnits).
• Strategy Result Requirements: TradingView explicitly states that strategies published publicly should strive to use realistic commission AND slippage when calculating backtesting results to avoid misleading traders.
• User Responsibility: Since the script currently focuses on signal integrity and uses a fixed contract size (IUnits = 1) without configurable commission/slippage inputs shown in the source, the user must manually configure these fees within the Pine Script® Strategy Tester settings (Properties tab) to ensure the strategy results are reflective of actual trading costs.
2. Omission of Built-in Risk Management (Stop-Loss and Take-Profit)
The TGAPSNR strategy's core focuses on entry signals and trend confirmation. Exits are primarily governed by:
• Reversal signals (BuyStop or SellStop).
• End-of-Day (EOD) session closures (EODStop).
• HTF bias opposition.
What is Missing: The script does not include explicit, hard-coded risk management parameters for traditional stop-loss (SL) or take-profit (TP) levels (e.g., risk percentage or ATR-based exits).
• Viable Risk: TradingView guidelines stipulate that strategies should generally risk sustainable amounts of equity, usually not exceeding 5-10% on a single trade, and trade size must be appropriate.
• User Application: To ensure the strategy operates within realistic risk boundaries, users must apply their own risk management rules. This includes:
◦ Implementing realistic stops and profit targets, which can be added via Pine Script® code or manually managed during live trading.
◦ Sizing trades to only risk sustainable amounts of equity. The current default unit size (IUnits = 1) is unrealistic for risk assessment unless the symbol is micro-sized.
3. Execution Quality (Fills)
The strategy is set to fill_orders_on_standard_ohlc = true and operates on confirmed bar closes (barstate.isconfirmed).
• Fill Assumption: This suggests the strategy primarily uses close price or the HTF close price (EntryPrice = HTFClose) for execution.
• Real-World Limitation: In volatile markets, obtaining a fill price equal to the close of the bar is rare. The user must be aware that the simulated fill price shown in backtesting may differ significantly from actual execution prices due to market action and chosen order type, reinforcing the importance of applying slippage settings.
In summary, while the script provides highly detailed and unique signal generation and internal PnL diagnostics, users must exercise caution and apply their own realistic parameters for fees, slippage, and explicit risk controls to prevent misleading performance results and ensure viable trading
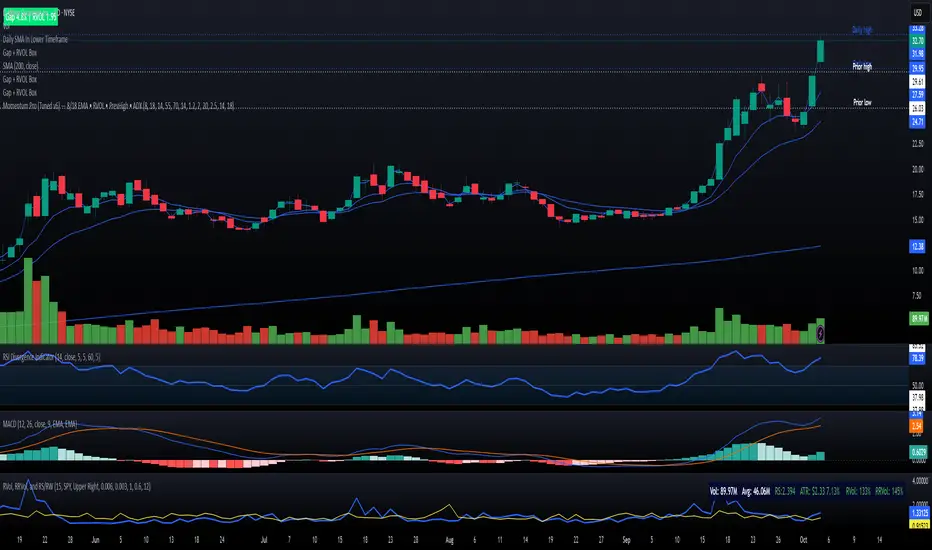
Momentum Pro (Tuned v6) — 8/18 EMA • RVOL • PrevHigh • ADXMomentum strategy with signals (VWAP + 9/20 EMA alignment, MACD hist > 0, RSI 55–70, RVOL filter, ATR stop, 2R target
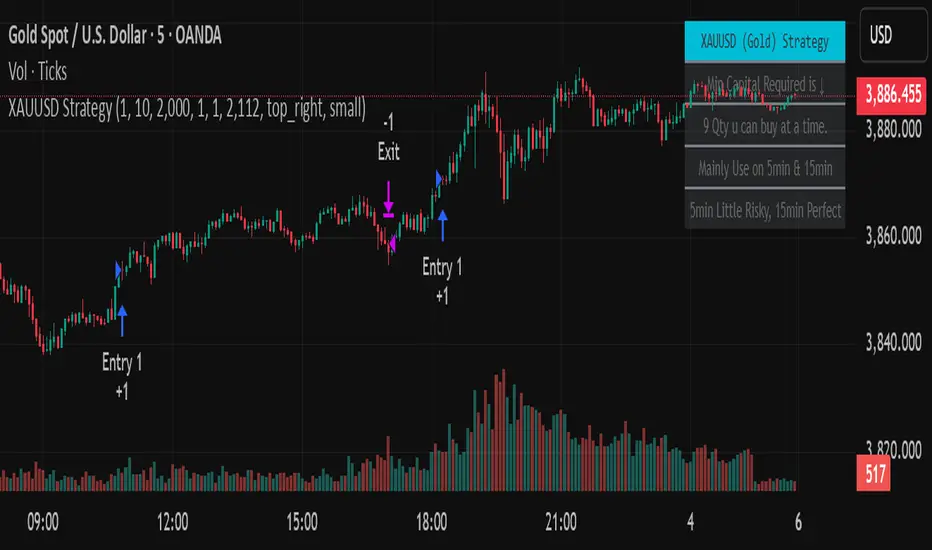
Golden StrategyTitle: XAUUSD (Gold) Smart Entry Strategy with Dynamic Scaling
Description:
This is a precision-based entry strategy for XAUUSD (Gold), optimized for lower timeframes like the 5-minute and 15-minute charts. It uses a custom logic engine to detect potential reversals and applies dynamic scaling (pyramiding) to build positions strategically based on price behavior.
🔍 Key Features:
✅ Smart entry logic for trend shifts
✅ Configurable position scaling up to 7 level
✅ Built-in capital efficiency for smaller accounts
✅ Backtest window control for historical testing
✅ Compact on-screen table for user guidance
Timeframes Recommended:
🔸 15-minute: Best balance of risk and consistency
🔸 5-minute: More frequent signals, slightly higher risk
⚠️ Important Disclaimer
This script is for educational and informational purposes only. It is not financial advice or a signal service. Trading carries risk, and past performance does not guarantee future results. Use at your own discretion and always manage risk appropriately.
Trend-Following & Breakout — Index Quant Strategy (NASDAQ)📈 Trend-Following & Breakout — Index Quant Strategy (NASDAQ & S&P 500)
Type: Invite-only strategy
Markets: NASDAQ 100 (NAS100 / US100 / NQ), S&P 500 (US500 / SPX), and other major equity indices.
🧠 Concept: Continuous trend model combining EWMAC (trend-following) and Donchian (breakout) signals, scaled by forecast strength and portfolio risk.
⚙️ Execution: Rebalances only on decision-bar closes, using hysteresis and a no-trade band to reduce churn.
📊 Default bias: Long-only — aligned with equity index drift.
🧩 How it works
• EWMAC Trend: Difference between fast and slow EMAs, normalized by an EWMA of absolute returns.
• Donchian Breakout: Distance beyond a 200-bar channel (Strict mode) or relative z-score position within it.
• Forecast combination: Weighted sum of trend and breakout points, clamped to ± capPoints.
• Hysteresis: Prevents quick sign flips near zero forecast.
• Risk scaling: Maps forecast strength to position size using equity × risk budget × ATR-based stop distance.
• Rebalance: Executes only if the required quantity change exceeds the Δqty threshold; can optionally block increases on Sundays (for CFDs).
⚙️ Default parameters
Deployed on NQ / US100 / NAS100 on Daily Timeframe
• Decision timeframe = 360 min (other options from 1 min to 1 week).
• Trend (EWMAC): Fast = 64, Slow = 256, Vol Norm = 32, Weight = 0.8.
• Breakout (Donchian): Length = 200, Mode = Strict, Weight = 0.2.
• Forecast scaling: ptsPerSigma = 1.0, capPoints = 10.
• Risk % per rebalance = 4 % of equity.
• ATR stop: ATR(14) × 1.0.
• No-trade band (Δqty) = 4 units.
• Hysteresis = 2 forecast points.
• Bias = Long-only (Neutral / Long-bias 50 % optional).
• Skip Sunday increases = false (default).
📋 Backtest properties (documented)
• Initial capital = 100 000 USD.
• Commission = 0.20 % per trade.
• Pyramiding = 10.
• Calc on every tick = false.
• Point value = 1 (for NAS100 CFD).
• No financing or slippage modeled.
• If using CFDs, account for overnight funding.
• On futures (NQ / ES), carry is implicit.
📊 Typical behaviour
• Many small scratches, a few large winners.
• Performs best during multi-week / multi-month trends.
• Underperforms in tight or volatile ranges.
• Average hold ≈ 30 – 90 days in historical tests.
💡 Risk and performance guide (illustrative)
Sharpe ≈ 1.25
Sortino ≈ 1.10 – 1.30
Max drawdown ≈ –18 % to –25 %
Annual volatility ≈ 24 – 28 %
CAGR ≈ 50 – 60 % (at 4 % risk)
Edge ratio ≈ 5 (MFE / MAE)
Historical backtests only — past performance does not guarantee future results.
🌍 Intended markets and timeframes
Optimized for NASDAQ 100 and S&P 500; also effective on similar indices (DAX, Dow Jones, FTSE).
Best on Daily or higher timeframes.
Aligns with long-term index drift — suitable for long-bias systematic trend portfolios.
⚠️ Limitations
• Backtests exclude CFD funding costs.
• Trend models will have losing streaks in range-bound markets.
• Designed for experienced traders seeking systematic exposure.
🔑 Requesting access
Send a private TradingView message to with the text:
“Request access to Trend-Following & Breakout — Index Quant Strategy.”
Access is granted only on explicit request.
For further information, see my TradingView Signature.
🆕 Release notes (v1.0)
• Initial release (360 min TF): EWMAC 64/256 + Donchian 200 Strict.
• Risk 4 %, ATR × 1.0, Long-only bias, hysteresis 2 pts, Δqty ≥ 4.
• Developed for NASDAQ 100 and S&P 500 indices.
• Implements continuous risk-scaled positioning and no-trade band logic.
🧾 Originality statement
This strategy is original work built entirely from TradingView built-ins (EMA, ATR, Highest, Lowest).
It does not reuse open-source invite-only code.
Any future reuse of open scripts will be done with explicit permission and credit.

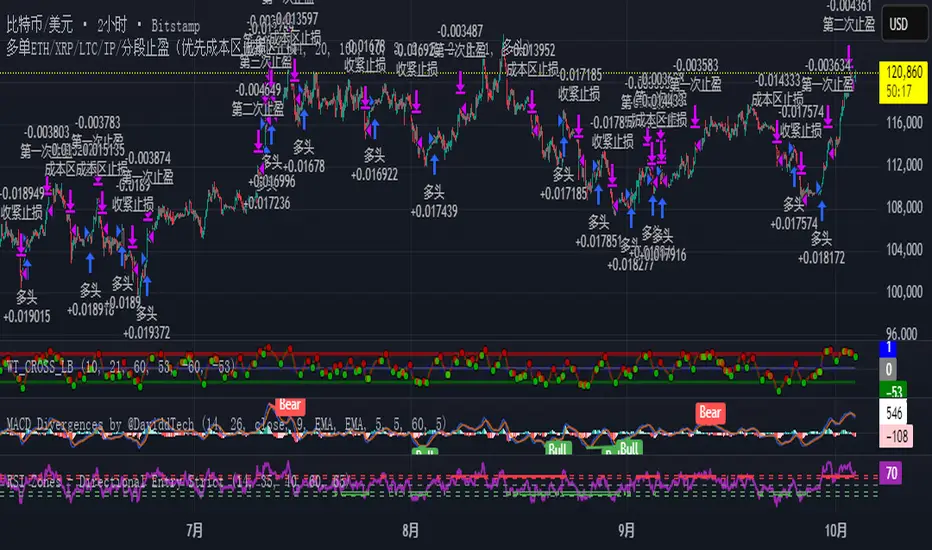
多单ETH/XRP/LTC/IP/分段止盈(优先成本区止损)Experience the backtesting of a 30x leverage If you need a long-term strategy, please send me a message.

多单ETH/XRP/LTC/IP/分段止盈(优先成本区止损)Feel the 30x leverage effect on the entire historical BTC data. Release your hands and take off!
Macro Momentum – 4-Theme, Vol Target, RebalanceMacro Momentum — 4-Theme, Vol Target, Rebalance
Purpose. A macro-aware strategy that blends four economic “themes”—Business Cycle, Trade/USD, Monetary Policy, and Risk Sentiment—into a single, smoothed Composite signal. It then:
gates entries/exits with hysteresis bands,
enforces optional regime filters (200-day bias), and
sizes the position via volatility targeting with caps for long/short exposure.
It’s designed to run on any chart (index, ETF, futures, single stocks) while reading external macro proxies on a chosen Signal Timeframe.
How it works (high level)
Build four theme signals from robust macro proxies:
Business Cycle: XLI/XLU and Copper/Gold momentum, confirmed by the chart’s price vs a long SMA (default 200D).
Trade / USD: DXY momentum (sign-flipped so a rising USD is bearish for risk assets).
Monetary Policy: 10Y–2Y curve slope momentum and 10Y yield trend (steepening & falling 10Y = risk-on; rising 10Y = risk-off).
Risk Sentiment: VIX momentum (bearish if higher) and HYG/IEF momentum (bullish if credit outperforms duration).
Normalize & de-noise.
Optional Winsorization (MAD or stdev) clamps outliers over a lookback window.
Optional Z-score → tanh mapping compresses to ~ for stable weighting.
Theme lines are SMA-smoothed; the final Composite is LSMA-smoothed (linreg).
Decide direction with hysteresis.
Enter/hold long when Composite ≥ Entry Band; enter/hold short when Composite ≤ −Entry Band.
Exit bands are tighter than entry bands to avoid whipsaws.
Apply regime & direction constraints.
Optional Long-only above 200MA (chart symbol) and/or Short-only below 200MA.
Global Direction control (Long / Short / Both) and Invert switch.
Size via volatility targeting.
Realized close-to-close vol is annualized (choose 9-5 or 24/7 market profile).
Target exposure = TargetVol / RealizedVol, capped by Max Long/Max Short multipliers.
Quantity is computed from equity; futures are rounded to whole contracts.
Rebalance cadence & execution.
Trades are placed on Weekly / Monthly / Quarterly rebalance bars or when the sign of exposure flips.
Optional ATR stop/TP for single-stock style risk management.
Inputs you’ll actually tweak
General
Signal Timeframe: Where macro is sampled (e.g., D/W).
Rebalance Frequency: Weekly / Monthly / Quarterly.
ROC & SMA lengths: Defaults for theme momentum and the 200D regime filter.
Normalization: Z-score (tanh) on/off.
Winsorization
Toggle, lookback, multiplier, MAD vs Stdev.
Risk / Sizing
Target Annualized Vol & Realized Vol Lookback.
Direction (Long/Short/Both) and Invert.
Max long/short exposure caps.
Advanced Thresholds
Theme/Composite smoothing lengths.
Entry/Exit bands (hysteresis).
Regime / Execution
Long-only above 200MA, Short-only below 200MA.
Stops/TP (optional)
ATR length and SL/TP multiples.
Theme Weights
Per-theme scalars so you can push/pull emphasis (e.g., overweight Policy during rate cycles).
Macro Proxies
Symbols for each theme (XLI, XLU, HG1!, GC1!, DXY, US10Y, US02Y, VIX, HYG, IEF). Swap to alternatives as needed (e.g., UUP for DXY).
Signals & logic (under the hood)
Business Cycle = ½ ROC(XLI/XLU) + ½ ROC(Copper/Gold), then confirmed by (price > 200SMA ? +1 : −1).
Trade / USD = −ROC(DXY).
Monetary Policy = 0.6·ROC(10Y–2Y) − 0.4·ROC(10Y).
Risk Sentiment = −0.6·ROC(VIX) + 0.4·ROC(HYG/IEF).
Each theme → (optional Winsor) → (robust z or scaled ROC) → tanh → SMA smoothing.
Composite = weighted average → LSMA smoothing → compare to bands → dir ∈ {−1,0,+1}.
Rebalance & flips. Orders fire on your chosen cadence or when the sign of exposure changes.
Position size. exposure = clamp(TargetVol / realizedVol, maxLong/Short) × dir.
Note: The script also exposes Gross Exposure (% equity) and Signed Exposure (× equity) as diagnostics. These can help you audit how vol-targeting and caps translate into sizing over time.
Visuals & alerts
Composite line + columns (color/intensity reflect direction & strength).
Entry/Exit bands with green/red fills for quick polarity reads.
Hidden plots for each Theme if you want to show them.
Optional rebalance labels (direction, gross & signed exposure, σ).
Background heatmap keyed to Composite.
Alerts
Enter/Inc LONG when Composite crosses up (and on rebalance bars).
Enter/Inc SHORT when Composite crosses down (and on rebalance bars).
Exit to FLAT when Composite returns toward neutral (and on rebalance bars).
Practical tips
Start higher timeframes. Daily signals with Monthly rebalance are a good baseline; weekly signals with quarterly rebalances are even cleaner.
Tune Entry/Exit bands before anything else. Wider bands = fewer trades and less noise.
Weights reflect regime. If policy dominates markets, raise Monetary Policy weight; if credit stress drives moves, raise Risk Sentiment.
Proxies are swappable. Use UUP for USD, or futures-continuous symbols that match your data plan.
Futures vs ETFs. Quantity auto-rounds for futures; ETFs accept fractional shares. Check contract multipliers when interpreting exposure.
Caveats
Macro proxies can repaint at the selected signal timeframe as higher-TF bars form; that’s intentional for macro sampling, but test live.
Vol targeting assumes reasonably stationary realized vol over the lookback; if markets regime-shift, revisit volLook and targetVol.
If you disable normalization/winsorization, themes can become spikier; expect more hysteresis band crossings.
What to change first (quick start)
Set Signal Timeframe = D, Rebalance = Monthly, Z-score on, Winsor on (MAD).
Entry/Exit bands: 0.25 / 0.12 (defaults), then nudge until trade count and turnover feel right.
TargetVol: try 10% for diversified indices; lower for single stocks, higher for vol-sell strategies.
Leave weights = 1.0 until you’ve inspected the four theme lines; then tilt deliberately.

Universal Breakout Strategy [KedArc Quant]Description:
A flexible breakout framework where you can test different logics (Prev Day, Bollinger, Volume, ATR, EMA Trend, RSI Confirm, Candle Confirm, Time Filter) under one system.
Choose your breakout mode, and the strategy will handle entries, exits, and optional risk management (ATR stops, take-profits, daily loss guard, cooldowns).
An on-chart info table shows live mode values (like Prev High/Low, Bollinger levels, RSI, etc.) plus P&L stats for quick analysis.
Use it to compare which breakout style works best on your instrument and timeframe, whether intraday, swing, or positional trading
🔑 Why it’s useful
* Flexibility: Switch between breakout strategies without loading different indicators.
* Clarity: On-chart info table displays current mode, relevant indicator levels, and live strategy P&L stats.
* Testing efficiency: Quickly A/B test different breakout styles under the same backtest environment.
* Transparency: Every trade is rule-based and displayed with entry/exit markers.
🚀 How it helps traders
* Lets you experiment with breakout strategies quickly without loading multiple scripts.
* Helps identify which breakout method fits your instrument & timeframe.
* Gives clear on-chart visual + statistical feedback for confident decision-making.
⚙️ Input Configuration
* Breakout Mode → choose which strategy to test:
* *Prev Day* → breakouts of yesterday’s High/Low.
* *Bollinger* → Upper/Lower BB pierce.
* *Volume* → Breakout confirmed with volume above average.
* *ATR Stop* → Wide range breakout using ATR filter.
* *Time Filter* → Breakouts inside defined session hours.
* *EMA Trend* → Breakouts only in EMA fast > slow alignment.
* *RSI Confirm* → Breakouts with RSI confirmation (e.g. >55 for longs).
* *Candle Confirm* → Breakouts validated by bullish/bearish candle.
* Lookback / ATR / Bollinger inputs → adjust sensitivity.
* Intrabar mode → option to evaluate breakouts using bar highs/lows instead of closes.
* Table options → show/hide info table, show/hide P&L stats, choose corner placement.
📈 Entry & Exit Logic
* Entry → occurs when breakout condition of chosen mode is met.
* Exit → default exits via opposite signals or optional stop/target if enabled.
* Session filter → optional auto-flat at session end.
* P&L management → optional daily loss guard, cooldown between trades, and ATR-based stop/take profit.
❓ FAQ — Choosing the best setup
Q: Which strategy should I use for which chart?
* *Prev Day Breakouts*: Best on indices, FX, and liquid futures with strong daily levels.
* *Bollinger*: Works well in range-bound environments, or crypto pairs with volatility compression.
* *Volume*: Good on equities where breakout strength is tied to volume spikes.
* *ATR Stop*: Suits volatile instruments (commodities, crypto).
* *EMA Trend*: Useful in trending markets (stocks, indices).
* *RSI Confirm*: Adds momentum filter, better for swing trades.
* *Candle Confirm*: Ideal for scalpers needing visual confirmation.
* *Time Filter*: For intraday traders who want signals only in high-liquidity sessions.
Q: What timeframe should I use?
* Intraday traders → 5m to 15m (Time Filter, Candle Confirm).
* Swing traders → 1H to 4H (EMA Trend, RSI Confirm, ATR Stop).
* Position traders → Daily (Prev Day, Bollinger).
* Breakout
A trade entry condition triggered when price crosses above a resistance level (for longs) or below a support level (for shorts).
* Prev Day High/Low
Formula:
Prev High = High of (Day )
Prev Low = Low of (Day )
* Bollinger Bands
Formula:
Basis = SMA(Close, Length)
Upper Band = Basis + (Multiplier × StdDev(Close, Length))
Lower Band = Basis – (Multiplier × StdDev(Close, Length))
* Volume Confirmation
A breakout is only valid if:
Volume > SMA(Volume, Length)
* ATR (Average True Range)
Measures volatility.
Formula:
ATR = SMA(True Range, Length)
where True Range = max(High–Low, |High–Close |, |Low–Close |)
* EMA (Exponential Moving Average)
Weighted moving average giving more weight to recent prices.
Formula:
EMA = (Price × α) + (EMA × (1–α))
with α = 2 / (Length + 1)
* RSI (Relative Strength Index)
Momentum oscillator scaled 0–100.
Formula:
RSI = 100 – (100 / (1 + RS))
where RS = Avg(Gain, Length) ÷ Avg(Loss, Length)
* Candle Confirmation
Bullish candle: Close > Open AND Close > Close
Bearish candle: Close < Open AND Close < Close
Win Rate (%)
Formula:
Win Rate = (Winning Trades ÷ Total Trades) × 100
* Average Trade P&L
Formula:
Avg Trade = Net Profit ÷ Total Trades
📊 Performance Notes
The Universal Breakout Strategy is designed as a framework rather than a single-asset optimized system. Results will vary depending on the chart, timeframe, and asset chosen.
On the current defaults (15-minute, INR-denominated example), the backtest produced 132 trades over the selected period. This provides a statistically sufficient sample size.
Win rate (~35%) is relatively low, but this is balanced by a positive reward-to-risk ratio (~1.8). In practice, a lower win rate with larger wins versus smaller losses is sustainable.
The average P&L per trade is close to breakeven under default settings. This is expected, as the strategy is not tuned for a single symbol but offered as a universal breakout framework.
Commissions (0.1%) and slippage (1 tick) are included in the simulation, ensuring realistic conditions.
Risk management is conservative, with order sizing set at 1 unit per trade. This avoids over-leveraging and keeps exposure well under the 5-10% equity risk guideline.
👉 Traders are encouraged to:
Experiment with inputs such as ATR period, breakout length, or Bollinger parameters.
Test across different timeframes and instruments (equities, futures, forex, crypto) to find optimal setups.
Combine with filters (trend direction, volatility regimes, or volume conditions) for further refinement.
⚠️ Disclaimer This script is provided for educational purposes only.
Past performance does not guarantee future results.
Trading involves risk, and users should exercise caution and use proper risk management when applying this strategy.

AstraAlgo BacktesterOVERVIEW
The AstraAlgo Backtester allows traders to simulate and evaluate trading strategies directly on TradingView. By simulating trades across different timeframes and markets, it provides valuable insights into win rates, drawdowns, and overall strategy effectiveness.
SIGNAL MODES
Signal Modes generate proprietary trade signals based on live price data. Users can choose between Off, Basic, Advanced, or Custom modes to evaluate strategies under different conditions and refine their trading approach.
ADJUSTABLE BACKTESTING
Parameters for historical simulations can be customized to test different market conditions and trading scenarios. This allows traders to measure strategy performance, including win rate, profit/loss, and risk/reward ratios, helping refine and optimize strategies before live execution.
BAR COLORING
Bar Coloring highlights bullish and bearish bars on historical charts, allowing traders to visually assess trend direction and trade outcomes during backtesting. This makes it easier to analyze momentum and strategy effectiveness at a glance.
ASTRA CLOUD
Astra Cloud overlays dynamic support and resistance levels on live price data. These zones adapt automatically to past market movements, helping traders identify areas where trades would have reacted, aiding strategy evaluation and optimization.

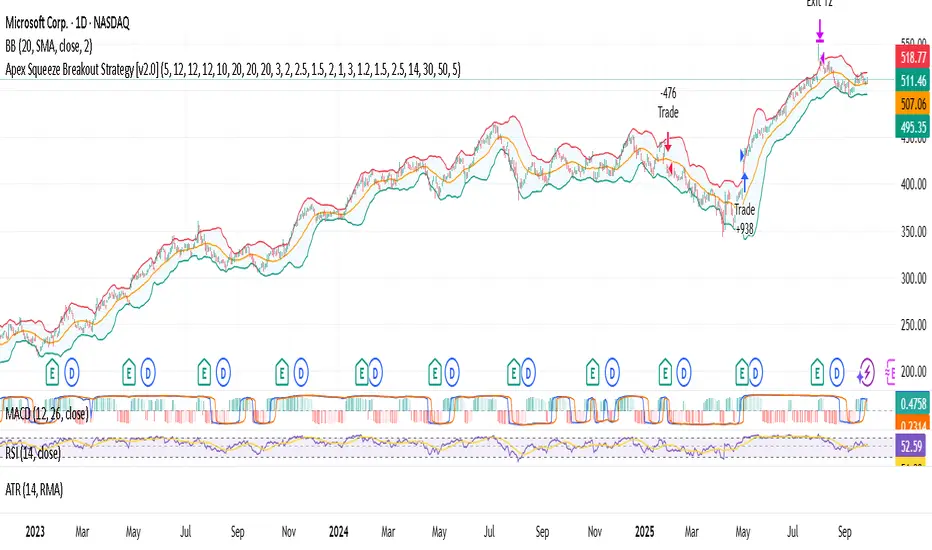
Apex Squeeze Breakout Strategy [by SKC]This is the official strategy version of the Apex Squeeze Breakout Trading System (v2.5 by SKC) indicator.
🔍 This script replicates the exact logic and trade behavior of the indicator, including:
Multi-factor scoring system (volume spike, squeeze, RSI recovery, momentum breakout, gap)
Supertrend-based trend bias and override logic
ATR-based dynamic SL/TP
Breakeven stop-loss shift after T1 hit
Trade logic works for both swing and day trading styles via a toggle
📈 Settings:
Use isDayTrading = true for 5m/15m charts
Use isDayTrading = false for 1H–Daily swing setups
⚠️ This strategy does not use repainting or offset entries. Backtest results are directly aligned with real-time signals from the original indicator.
✅ Use this strategy to backtest ticker performance, identify high-confidence symbols, and create forward trade plans based on proven edge.

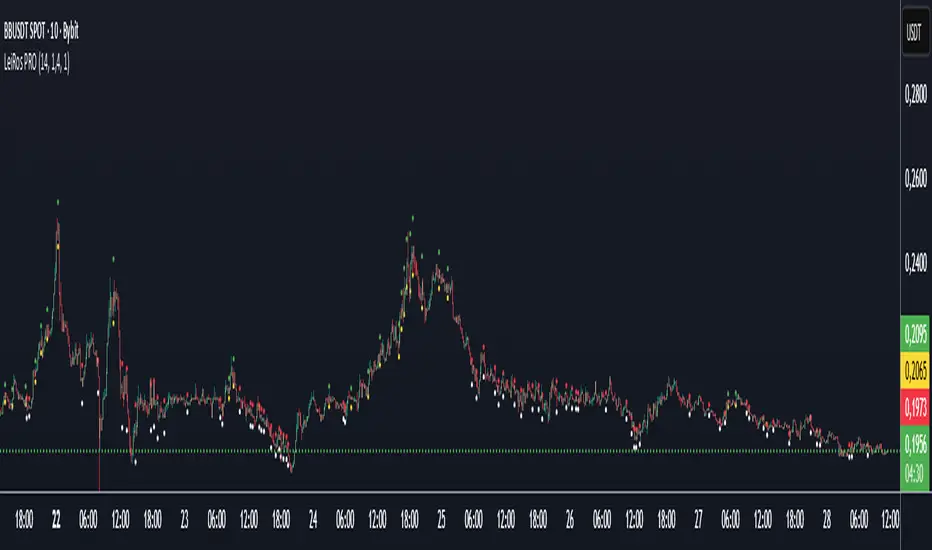
LeiRos PRO — Smart Entry & Target System⚡ Short Description
LeiRos PRO is more than an indicator.
It is an intelligent next-generation analytical tool designed to visualize the true trajectory of market movement.
It reveals the hidden mechanics of price — the attraction points where liquidity is collected and extremes are updated before reversal.
🟢 During bullish phases, the market often reaches for previous highs.
Green points of LeiRos PRO highlight the levels price is most likely to reach before completing the impulse.
⚪ In bearish phases, the market tends to sweep uncollected lows.
White points indicate where stop hunts and local reversals commonly occur.
Built upon the interaction of EMA20 / EMA50 / EMA200, volatility analysis and momentum strength,
LeiRos PRO doesn’t just mark levels — it displays realistic targets price is drawn to with high probability.
📈 The higher the timeframe, the clearer and more stable the picture becomes.
On H1 and above, the plotted points act as reference zones for those seeking structured, logical price behavior rather than noise.
💡 The main advantage of LeiRos PRO is clarity — it removes guessing.
You see where price tends to move and where impulses are likely to end.
This is not theory — it’s market behavior visualized.
📘 Full Description
LeiRos PRO is a proprietary analytical tool created to precisely visualize directional bias, target zones, and protective stop areas.
It combines trend structure, volatility, and price action logic — helping traders see the key areas where the market’s intent becomes clear.
📈 Core Features:
Automatic trend detection: analyzes direction using EMA20, EMA50, and EMA200 to define the dominant side of the market.
Target visualization (Take-Profit): marks potential liquidity-grab zones where price often completes its move.
Protective stop zones (Stop-Loss): highlights areas where logical stops can be placed based on current structure.
Adaptive to timeframe: higher timeframes provide cleaner and more reliable reference points, suitable for short-, medium-, and long-term analysis.
⚙️ Recommended Use:
As a visual analytical tool for confirming trade direction.
On lower TFs — for identifying intraday entry points and potential objectives.
On higher TFs (H1 and above) — for building overall market context and defining major targets.
Marked points are not entry signals,
but contextual reference zones showing potential areas of liquidity collection or impulse completion.
⚠️ Disclaimer:
LeiRos PRO is an analytical and visualization tool, not a trading signal or guarantee of results.
All trading decisions, entries, exits, and risk management remain solely the responsibility of the user.
✳️ Note:
This indicator is part of the LeiRos Project, which develops intelligent systems for advanced market analysis and visualization.
Displayed levels adapt dynamically to volatility and timeframe, providing a flexible view of current market structure.
Apex Squeeze Breakout Strategy (v1.0 by SKC)The Apex Squeeze Breakout Strategy is a powerful momentum-based system designed to capture explosive price moves following periods of low volatility compression (squeeze). It combines five key conditions to validate high-probability breakouts:
🔵 TTM Squeeze Detection using Bollinger Bands and Keltner Channels
🔊 Volume Spike Confirmation relative to a moving average
📈 Breakout Trigger above/below a recent high/low range
💪 Momentum Acceleration using percentage change over time
♻️ RSI Recovery / Overbought Logic to confirm shift in strength
The strategy includes:
Configurable swing/day trading modes
Dynamic ATR-based Stop Loss and TP1/TP2 system
Modular input structure for easy customization
Clear entry/exit visual markers and trade zones
It’s designed for disciplined traders who want to catch high-energy moves after consolidation, suitable for both intraday and swing setups.
Diamond-Triangle Strategy - Dynamic Trailing v3added more options of edits and lower high higher low exit logic, with .09 ema cloud rather then .1 sep for chop

KD The ScalperWe have to take the trade when all three EMAs are pointing in the same direction (no criss-cross, no up/down, sideways). All 3 EMAs should be cleanly separated from each other with strong spacing between them; they are not tangled, sideways, or messy. This is our first filter before entering the trade. Are the EMAs stacked neatly, and is the price outside of the 25 EMA? If price pulls back and closes near or below the 25 or 50 EMA and breaks the 100 EMA, we don't trade. Use the 100 EMA as a safety net and refrain from trading if the price touches or falls below the 100 EMA.
1. Confirm the trend- All 3 EMAs must align, and they must spread
2. Watch price pull back to the 25th or the 50 EMA
3. Wait for the price to bounce - And re-approach the 25 EMA
Why is this powerful?
Removes 80% of the low-probability Trades
It keeps you out of choppy markets
Avoids Reversal Traps
Anchors us to momentum
We take the entry when the price moves up again and touches the 25 EMA from below, and then when it breaks above the 25 EMA, or even better, when a lovely green bullish candle forms. A bullish candle indicates good momentum. When a bullish candle closes in green, it means the momentum has increased significantly. This is when we enter a long trade, with the stop-loss just below the 50 EMA and the profit target being 1.5 times the stop-loss.
The same rule applies to the bearish trade.

Liquidity+FVG+OB Strategy (v6)How the strategy works (summary)
Entry Long when a Bullish FVG is detected (optionally requires a recent Bullish OB).
Entry Short when a Bearish FVG is detected (optionally requires a recent Bearish OB).
Stop Loss and Take Profit are placed using ATR multiples (configurable).
Position sizing is fixed contract/lot size (configurable).
You can require OB confirmation (within ob_confirm_window bars).
Alerts still exist and visuals are preserved.

Diamond-Triangle Strategy - Dynamic Trailing v2This had an adaptive exit strategy added with diamond entries not working well

TrendIsYourFriend Strategy (SPY,IWM,VYM,XLK,SPXL,BTC,GOLD,VT...)Personal disclaimer
Don’t trust this strategy. Don’t trust any other model either just because of its author or a backtest curve. Overfitting is an easy trap, and beginners often fall into it. This script isn’t meant to impress you. It’s meant to survive reality. If it does, maybe it will raise questions and you’ll remember it.
Legal disclaimer
Educational purposes only. Not financial advice. Past performance is not indicative of future results.
Strategy description
Long-only, trend-based logic with two entry types (trend continuation or excess-move reversion), dynamic stop-losses, and a VIX filter to avoid turbulent markets.
Minimal number of parameters with enough trades to support robustness.
For backtest, each trade is sized at $10,000 flat (no compounding, to focus on raw model quality and the regularity of its results over time).
Fees = $0 (neutral choice, as brokers differ).
Slippage = $0, deliberate choice: most entries occur on higher timeframes, and some assets start their history on charts at very low prices, which would otherwise distort results.
What makes this script original
Beyond a classical trend calculation, both excess-move entries and dynamic stop-loss exits also rely on trend logic. Except for the VIX filter, everything comes from trend functions, with very few parameters.
Pre-configurations are fixed in the code, allowing sincere performance tracking across a dozen cases over the medium to long term.
Allowed
SPY (ARCA) — 2-hour chart: S&P 500 ETF, most liquid equity benchmark
IWM (ARCA) — Daily chart: Russell 2000 ETF, US small caps
VYM (ARCA) — Daily chart: Vanguard High Dividend Yield ETF
XLK (ARCA) — Daily chart: Technology Select Sector SPDR
SPXL (ARCA) — Daily chart: 3× leveraged S&P 500 ETF
BTCUSD (COINBASE) — 4-hour chart: Bitcoin vs USD
GOLD (TVC) — Daily chart: Gold spot price
VT (ARCA) — Daily chart: Vanguard Total World Stock ETF
PG (NYSE) — Daily chart: Procter & Gamble Co.
CQQQ (ARCA) — Daily chart: Invesco China Technology ETF
EWC (ARCA) — Daily chart: iShares MSCI Canada ETF
EWJ (ARCA) — Daily chart: iShares MSCI Japan ETF
How to use and form an opinion on it
Works only on the pairs above.
Feel free to modify the input parameters (slippage, fees, order size, margins, …) to see how the model behaves under your own conditions
Compare it with a simple Buy & Hold (requires an order size of 100% equity).
You may also want to look at its time-in-market — the share of time your capital is actually at risk.
Finally, let me INSIST on this : let it run live for months before forming an opinion!
Share your thoughts in the comments 🚀 if you’d like to discuss its live performance.

💎🔺⚫ Diamond-Triangle-Circle StrategyUpgrade the high low low high strat to cut out signal noise and flat markets dont take the black circles they eat profits

TradeMastersAlgoOur strategy is a long only algorithm that has produced repeatable positive results in both back testing and live testing. The code is our proprietary IP. Users may have a 30 free trial to experiment with our strategy.
Results are not guaranteed.
This strategy was created for automated day trading a fully funded margin account. Please exercise caution and discipline when using any strategy. We've had the most positive results with heavy diversification (40 tickers trading 5% equity each).
Ticker selection, timeframe, and chart type ( we use standard candles ) are up to the user.
We encourage you to keep your own method to your self to prevent the dilution of your strategy.
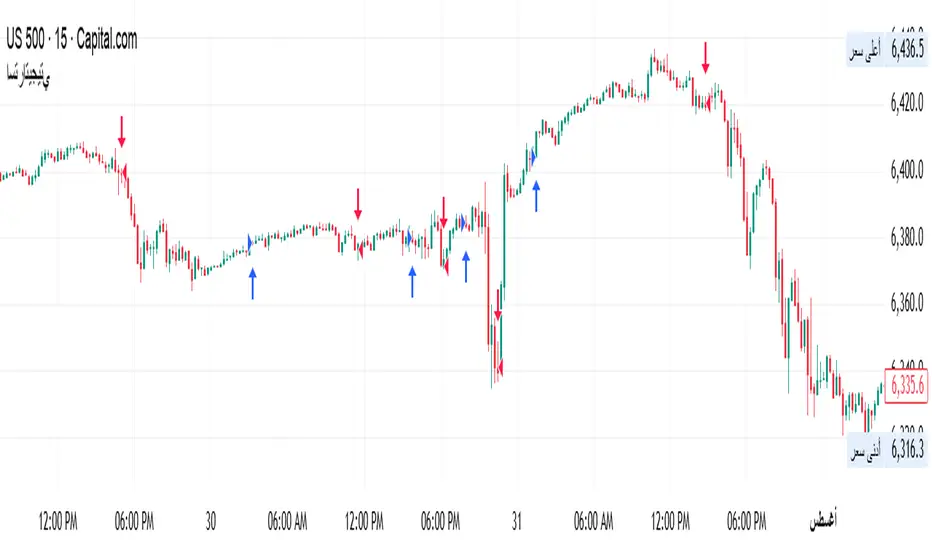
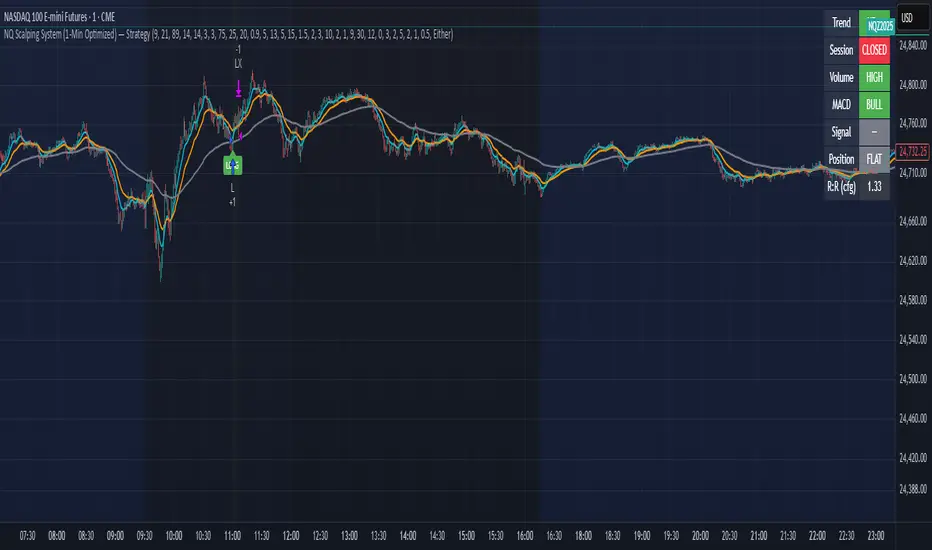
NQ Scalping System (1-Min Optimized) — StrategyNQ Scalping System — What this does (in plain English)
You’re buying pullbacks in an uptrend and selling pullbacks in a downtrend.
Trend = EMA89. Entries lean on EMA8/EMA21 touches + a StochRSI reset & cross so you’re not chasing candles. Optional Volume and MACD filters keep you out of weak moves. A time window avoids dead markets and the first noisy minute.
Long setup
Price above EMA89 (trend up)
Price pulls back to EMA8 (or EMA21 if fallback is on) by at least your Min Pullback (NQ points)
StochRSI resets to oversold and %K crosses up %D
(Optional) Volume thrust and MACD momentum confirm
Within your session window
Short = mirror image.
Exits you control
Stop/Target: ATR-based (adaptive) or fixed scalp points
Trailing stop: only arms after price moves your way by X points, then trails by your offset
Early exit options: StochRSI fade, EMA break, trend break, or opposite divergence
Quick scalp: grab a few points or bail after X bars if nothing happens
Reality check
This is a rules → orders system. It will not match eyeballed indicator labels. Fills, gaps, and trail behavior are real. That’s the point.
How I’d run it (defaults that won’t waste your time)
Use ATR stops/targets by default
EMA21 fallback = ON (you’ll miss fewer good pullbacks)
MACD filter = ON when choppy; OFF when trends are clean
Volume multiplier: start modest, bump it up if you get chopped
Session: keep RTH (e.g., 09:30–15:45 ET) and skip the first minute
Quick presets for higher timeframes
Use these as starting points and then nudge to taste.
5-Minute (intraday swings)
OB/OS: 80 / 20
Volume Multiplier: 1.3
MACD: 8 / 21 / 5
ATR Stop× / Target×: 1.8–2.2 / 2.5–3.0
Min Pullback: 1.0–1.5 pts
Quick Scalp: 6–10 pts, Bars: 12–20
Trailing: Activation 6–8 pts, Offset 3–4 pts
Divergence: Hidden ON, MTF OFF
15-Minute (session legs)
OB/OS: 85 / 15
Volume Multiplier: 1.4
MACD: 8 / 21 / 5
ATR Stop× / Target×: 2.0–2.5 / 3.0–4.0
Min Pullback: 1.5–2.5 pts
Quick Scalp: 12–18 pts, Bars: 16–30
Trailing: Activation 10–14 pts, Offset 5–6 pts
Divergence: Hidden ON, MTF ON (LTF = 5m)
30-Minute (bigger intraday trends)
OB/OS: 88 / 12
Volume Multiplier: 1.5
MACD: 12 / 26 / 9 (or 8 / 21 / 5 if you want faster)
ATR Stop× / Target×: 2.2–2.8 / 3.5–5.0
Min Pullback: 2.5–4.0 pts
Quick Scalp: 18–28 pts, Bars: 20–40
Trailing: Activation 16–24 pts, Offset 6–8 pts
Divergence: Hidden ON, MTF ON (LTF = 5m or 15m)
1-Hour (multi-hour swings)
OB/OS: 90 / 10
Volume Multiplier: 1.6–1.8
MACD: 12 / 26 / 9
ATR Stop× / Target×: 2.5–3.5 / 4.0–6.0
Min Pullback: 4–7 pts
Quick Scalp: 30–50 pts, Bars: 24–60
Trailing: Activation 28–40 pts, Offset 10–15 pts
Divergence: Hidden ON, MTF ON (LTF = 15m)
Tuning tips (read this)
Getting chopped? Raise Min Pullback, raise Volume Multiplier, leave MACD ON, and narrow your session.
Missing moves? Turn EMA21 fallback ON, lower Volume Multiplier, relax OB/OS (e.g., 75/25 on 5m).
Flat days? Use Quick Scalp and a tighter Trail Activation to lock gains.
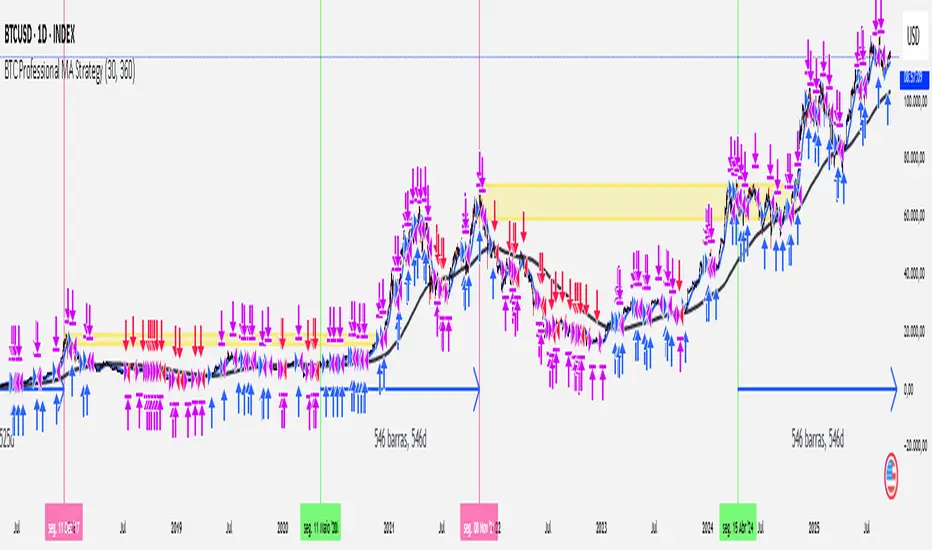
[Outperforms Bitcoin Since 2011] Professional MA StrategyThis Strategy OUTPEFORMS Bitcoin since 2011.
Timeframe: Daily
MA used (Fast and Slow): WMA (Weighted Moving Average)
Fast MA Length: 30 days (Reflects the Monthly Trend - Short Term Perspective)
Slow MA Length: 360 days (Reflects the Annual Trend - Long Term Perspective)
Position Size: 100% of equity
Margin for Long = 10% of equity
Margin for Short = 10% of equity
Open Long = Typical Price Crosses Above its Fast MA and Price is above its Slow MA
Open Short = Typical Price Crosses Below its Fast MA and Price is below its Slow MA
Close Long = Typical Price Crosses Below its Fast MA
Close Short = Typical Price Crosses Below its Fast MA
note: Typical Price = (high + low + close) / 3