Hyper SAR Reactor Trend StrategyHyperSAR Reactor Adaptive PSAR Strategy
Summary
Adaptive Parabolic SAR strategy for liquid stocks, ETFs, futures, and crypto across intraday to daily timeframes. It acts only when an adaptive trail flips and confirmation gates agree. Originality comes from a logistic boost of the SAR acceleration using drift versus ATR, plus ATR hysteresis, inertia on the trail, and a bear-only gate for shorts. Add to a clean chart and run on bar close for conservative alerts.
Scope and intent
• Markets: large cap equities and ETFs, index futures, major FX, liquid crypto
• Timeframes: one minute to daily
• Default demo: BTC on 60 minute
• Purpose: faster yet calmer PSAR that resists chop and improves short discipline
• Limits: this is a strategy that places simulated orders on standard candles
Originality and usefulness
• Novel fusion: PSAR AF is boosted by a logistic function of normalized drift, trail is monotone with inertia, entries use ATR buffers and optional cooldown, shorts are allowed only in a bear bias
• Addresses false flips in low volatility and weak downtrends
• All controls are exposed in Inputs for testability
• Yardstick: ATR normalizes drift so settings port across symbols
• Open source. No links. No solicitation
Method overview
Components
• Adaptive AF: base step plus boost factor times logistic strength
• Trail inertia: one sided blend that keeps the SAR monotone
• Flip hysteresis: price must clear SAR by a buffer times ATR
• Volatility gate: ATR over its mean must exceed a ratio
• Bear bias for shorts: price below EMA of length 91 with negative slope window 54
• Cooldown bars optional after any entry
• Visual SAR smoothing is cosmetic and does not drive orders
Fusion rule
Entry requires the internal flip plus all enabled gates. No weighted scores.
Signal rule
• Long when trend flips up and close is above SAR plus buffer times ATR and gates pass
• Short when trend flips down and close is below SAR minus buffer times ATR and gates pass
• Exit uses SAR as stop and optional ATR take profit per side
Inputs with guidance
Reactor Engine
• Start AF 0.02. Lower slows new trends. Higher reacts quicker
• Max AF 1. Typical 0.2 to 1. Caps acceleration
• Base step 0.04. Typical 0.01 to 0.08. Raises speed in trends
• Strength window 18. Typical 10 to 40. Drift estimation window
• ATR length 16. Typical 10 to 30. Volatility unit
• Strength gain 4.5. Typical 2 to 6. Steepness of logistic
• Strength center 0.45. Typical 0.3 to 0.8. Midpoint of logistic
• Boost factor 0.03. Typical 0.01 to 0.08. Adds to step when strength rises
• AF smoothing 0.50. Typical 0.2 to 0.7. Adds inertia to AF growth
• Trail smoothing 0.35. Typical 0.15 to 0.45. Adds inertia to the trail
• Allow Long, Allow Short toggles
Trade Filters
• Flip confirm buffer ATR 0.50. Typical 0.2 to 0.8. Raise to cut flips
• Cooldown bars after entry 0. Typical 0 to 8. Blocks re entry for N bars
• Vol gate length 30 and Vol gate ratio 1. Raise ratio to trade only in active regimes
• Gate shorts by bear regime ON. Bear bias window 54 and Bias MA length 91 tune strictness
Risk
• TP long ATR 1.0. Set to zero to disable
• TP short ATR 0.0. Set to 0.8 to 1.2 for quicker shorts
Usage recipes
Intraday trend focus
Confirm buffer 0.35 to 0.5. Cooldown 2 to 4. Vol gate ratio 1.1. Shorts gated by bear regime.
Intraday mean reversion focus
Confirm buffer 0.6 to 0.8. Cooldown 4 to 6. Lower boost factor. Leave shorts gated.
Swing continuation
Strength window 24 to 34. ATR length 20 to 30. Confirm buffer 0.4 to 0.6. Use daily or four hour charts.
Properties visible in this publication
Initial capital 10000. Base currency USD. Order size Percent of equity 3. Pyramiding 0. Commission 0.05 percent. Slippage 5 ticks. Process orders on close OFF. Bar magnifier OFF. Recalculate after order filled OFF. Calc on every tick OFF. No security calls.
Realism and responsible publication
No performance claims. Past results never guarantee future outcomes. Shapes can move while a bar forms and settle on close. Strategies execute only on standard candles.
Honest limitations and failure modes
High impact events and thin books can void assumptions. Gap heavy symbols may prefer longer ATR. Very quiet regimes can reduce contrast and invite false flips.
Open source reuse and credits
Public domain building blocks used: PSAR concept and ATR. Implementation and fusion are original. No borrowed code from other authors.
Strategy notice
Orders are simulated on standard candles. No lookahead.
Entries and exits
Long: flip up plus ATR buffer and all gates true
Short: flip down plus ATR buffer and gates true with bear bias when enabled
Exit: SAR stop per side, optional ATR take profit, optional cooldown after entry
Tie handling: stop first if both stop and target could fill in one bar
Analizy Trendu

ICT Liquidity Sweep Asia/London 1 Trade per High & Low🧠 ICT Liquidity Sweep Asia/London — 1 Trade per High & Low
This strategy is inspired by the ICT (Inner Circle Trader) concepts of liquidity sweeps and market structure, focusing on the Asia and London sessions.
It automatically identifies liquidity grabs (sweeps) above or below key session highs/lows and enters trades with a fixed risk/reward ratio (RR).
----------------------------------------------------------------------------------
----------------------------------------------------------------------------------
⚙️ Core Logic
-Asia Session: 8:00 PM – 11:59 PM (New York time)
-London Session: 2:00 AM – 5:00 AM (New York time)
-The script marks the Asia High/Low and London High/Low ranges for each day.
-When the market sweeps above a session high → potential Short setup
-When the market sweeps below a session low → potential Long setup
-A trade is triggered when the confirmation candle closes in the opposite direction of the sweep (bearish after a high sweep, bullish after a low sweep).
-Only one trade per sweep type (1 per High, 1 per Low) is allowed per session.
----------------------------------------------------------------------------------
----------------------------------------------------------------------------------
📈 Risk Management
-Configurable Risk/Reward Target (default = 2:1)
-Configurable Position Size (number of contracts)
-Each trade uses a fixed Stop Loss (beyond the wick of the sweep) and a Take Profit calculated from the RR setting.
-All trades are automatically logged in the Strategy Tester with performance metrics.
----------------------------------------------------------------------------------
----------------------------------------------------------------------------------
💡 Features
✅ Visual session highlighting (Asia = Aqua, London = Orange)
✅ Automatic liquidity line plotting (session highs/lows)
✅ Entry & exit labels (optional visual display)
✅ Customizable RR and contract size
✅ Works on any instrument (ideal for indices, futures, or forex)
✅ Compatible with all timeframes (optimized for 1M–15M)
----------------------------------------------------------------------------------
----------------------------------------------------------------------------------
⚠️ Notes
-Best used on New York time-based charts.
-Designed for educational and backtesting purposes — not financial advice.
-Use as a foundation for further optimization (e.g., SMT confirmation, FVG filter, or time-based restrictions).
----------------------------------------------------------------------------------
----------------------------------------------------------------------------------
🧩 Recommended Use
Pair this with:
-ICT’s concepts like CISD (Change in State of Delivery) and FVGs (Fair Value Gaps)
-Higher timeframe liquidity maps
-Session bias or daily narrative filters
----------------------------------------------------------------------------------
----------------------------------------------------------------------------------
Author: jygirouard
Strategy Version: 1.3
Type: ICT Liquidity Sweep Automation
Timezone: America/New_York

HermesHERMES STRATEGY - TRADINGVIEW DESCRIPTION
OVERVIEW
Hermes is an adaptive trend-following strategy that uses dual ALMA (Arnaud Legoux Moving Average) filters to identify high-quality entry and exit points. It's designed for swing and position traders who want smooth, low-lag signals with minimal whipsaws.
Unlike traditional moving averages that operate on price, Hermes analyzes price returns (percentage changes) to create signals that work consistently across any asset class and price range.
HOW IT WORKS
DUAL ALMA SYSTEM
The strategy uses two ALMA lines applied to price returns:
• Fast ALMA (Blue Line): Short-term trend signal (default: 80 periods)
• Slow ALMA (Black Line): Long-term baseline trend (default: 250 periods)
ALMA is superior to simple or exponential moving averages because it provides:
• Smoother curves with less noise
• Significantly reduced lag
• Natural resistance to outliers and flash crashes
TRADING LOGIC
BUY SIGNAL:
• Fast ALMA crosses above Slow ALMA (bullish regime)
• Price makes new N-bar high (momentum confirmation)
• Optional: Price above 200 EMA (macro trend filter)
• Optional: ALMA lines sufficiently separated (strength filter)
SELL SIGNAL:
• Fast ALMA crosses below Slow ALMA (bearish regime)
• Optional: Price makes new N-bar low (momentum confirmation)
The strategy stays in position during the entire bullish regime, allowing you to ride trends for weeks or months.
VISUAL INDICATORS
LINES:
• Blue Line: Fast ALMA (short-term signal)
• Black Line: Slow ALMA (long-term baseline)
TRADE MARKERS:
• Green Triangle Up: Buy executed
• Red Triangle Down: Sell executed
• Orange "M": Buy blocked by momentum filter
• Purple "W": Buy blocked by weak crossover strength
KEY PARAMETERS
ALMA SETTINGS:
• Short Period (default: 30) - Fast signal responsiveness
• Long Period (default: 250) - Baseline stability
• ALMA Offset (default: 0.90) - Balance between lag and smoothness
• ALMA Sigma (default: 7.5) - Gaussian curve width
ENTRY/EXIT FILTERS:
• Buy Lookback (default: 7) - Bars for momentum confirmation (required)
• Sell Lookback (default: 0) - Exit momentum bars (0 = disabled for faster exits)
• Min Crossover Strength (default: 0.0) - Required ALMA separation (0 = disabled)
• Use Macro Filter (default: true) - Only enter above 200 EMA
BEST PRACTICES
RECOMMENDED ASSETS - Works well on:
• Cryptocurrencies (Bitcoin, Ethereum, etc.)
• Major indices (S&P 500, Nasdaq)
• Large-cap stocks
• Commodities (Gold, Oil)
RECOMMENDED TIMEFRAMES:
• Daily: Primary timeframe for swing trading
• 4-Hour: More active trading (increase trade frequency)
• Weekly: Long-term position trading
PARAMETER TUNING:
• More trades: Lower Short Period (60-80)
• Fewer trades: Raise Short Period (100-120)
• Faster exits: Set Sell Lookback = 0
• Safer entries: Enable Macro Filter (Use Macro Filter = true)
STRATEGY ADVANTAGES
1. Low Lag - ALMA provides faster signals than traditional moving averages
2. Smooth Signals - Minimal whipsaws compared to crossover strategies
3. Asset Agnostic - Same parameters work across different markets
4. Trend Capture - Stays positioned during entire bullish regimes
5. Risk Management - Multiple filters prevent poor entries
6. Visual Clarity - Easy to interpret regime and filter states
WHEN TO USE HERMES
BEST FOR:
• Trending markets (crypto bull runs, equity uptrends)
• Swing trading (hold days to weeks)
• Position trading (hold weeks to months)
• Clear trend identification
• Risk-managed exposure
NOT SUITABLE FOR:
• Ranging/sideways markets
• Scalping or day trading
• High-frequency trading
• Mean reversion strategies
RISK DISCLAIMER
This indicator is for educational purposes only. Past performance does not guarantee future results. Always use proper position sizing and risk management. Test thoroughly on historical data before live trading.
CREDITS
Inspired by Giovanni Santostasi's Power Law Volatility Indicator, generalized for universal application across all assets using adaptive ALMA filtering.
Strategy by Hermes Trading Systems
QUICK START
1. Add indicator to chart
2. Use on daily timeframe for best results
3. Look for green buy signals when blue line crosses above black line
4. Exit on red sell signals when blue line crosses below black line
5. Adjust parameters based on your trading style:
• Conservative: Enable Macro Filter, increase Buy Lookback to 10
• Aggressive: Disable Macro Filter, lower Short Period to 60
• Default settings work well for most assets

Master Trend Strategy - by jake_thebossMaster Trend Strategy
This strategy combines multiple technical indicators to identify high-probability trend entries across all asset classes.
Core Signal Logic:
Entry triggered when EMA 4 crosses above/below EMA 5
Confirmation required from RSI (>50 for long, <50 for short)
Price must be above/below key moving averages: EMA 21, SMA 50, EMA 55, EMA 89, and EMA 750
Additional confirmation from Stochastic (>52 bullish, <48 bearish) or EMA 89 breakout or VWAP cross
Key Features:
VWAP filter: Only takes bullish signals above VWAP and bearish signals below VWAP
Optional pyramiding: Allows multiple entries in the same direction (up to 200 orders)
Individual stop loss and take profit management for each pyramid level
Time filter: Customizable trading hours with timezone offset
Risk management: Adjustable stop loss (default 0.3%) and take profit (default 0.6%)
Visualization:
Entry, stop loss, and take profit levels drawn as horizontal lines
Customizable signal markers (triangles) for bull/bear entries
Optional EMA overlay display
The strategy is designed for trend-following on lower timeframes, with strict multi-indicator confirmation to filter out false signals.

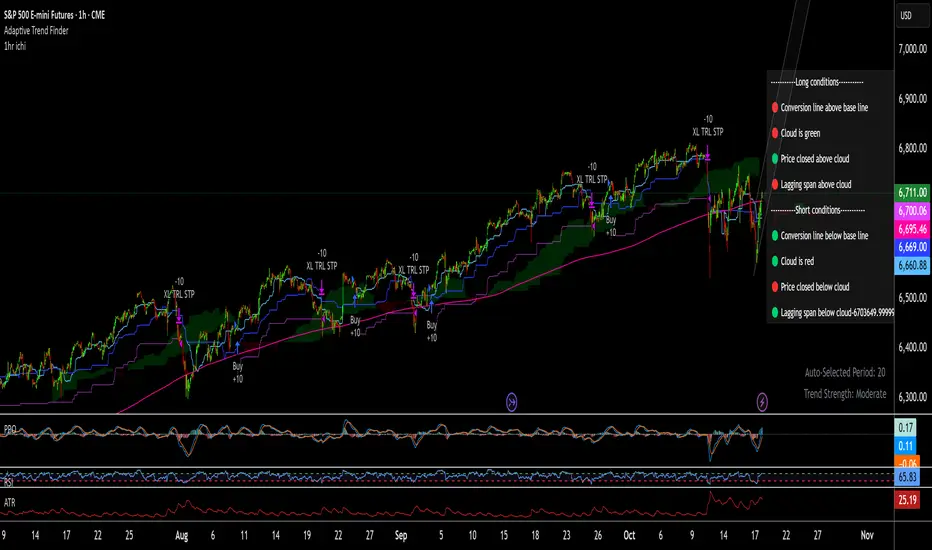
1hr ichi v6Ichimoku adapted to a 1hr chart
Set margin for positions to "0"
Adjust the number of contracts to the maximum drawdown you will accept. I use 11-13%
Momentum/Breakout Strategy A professional-grade trend–momentum hybrid strategy designed for high–timeframe precision and long-term consistency.
It combines exponential moving averages (EMA 20/50) to define directional bias, RSI and MACD to confirm momentum strength, and a manually coded ADX filter to validate market trend quality.
ATR-based stop placement and trailing mechanisms control downside volatility, while an optional daily EMA trend filter aligns trades with higher–timeframe direction for smoother performance.

RSI Oversold/Overbought + SMA Crossover Strategymy first strat, to share with my friends, hope you all enjoy

Gold GC Renko Strategy Futures MGC MicrosRENKO SET UP FOR GC (1 CONTRACT)
TRADITIONAL
BOX SIZE 1
CHART TIMEFRAME 1 MINUTE
__________________________
REGULAR CANDLE SETUP FOR MGC (2 MICROS)
15 MIN TIMEFRAME
__________________________
This strategy trades pullbacks within a trend, using two EMAs (fast/slow) to define uptrends and downtrends. It waits for a volatility “squeeze” , then looks for momentum ignition to go long, while shorts require a cross and optional band break/downtrend confirmation. Risk is handled with fixed dollar profit target and stop-loss values (converted to ticks), with exits placed immediately after entries and an automatic flat-at-session-close (New York time). Signals and risk lines are plotted.

5min ORB with FVG God Modethis is 15 min Order Block strategy who works verry well on 3 min chart just must to close some
trading hours

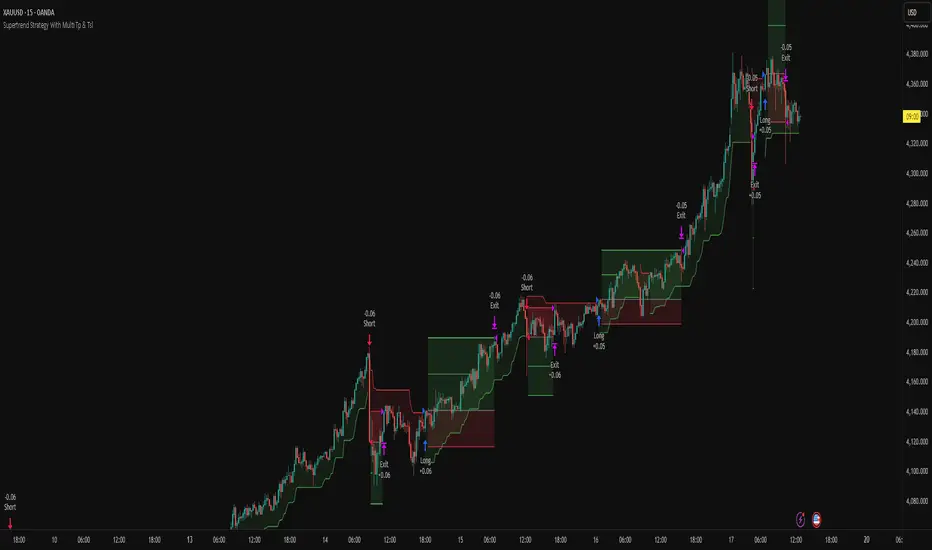
Supertrend Strategy With Multi Tp & TslHello Traders,
This strategy is based on the popular Supertrend indicator, which many traders use as a simple trend-following tool. The core entry logic is straightforward:
Buy (Long) when the price closes above the Supertrend line.
Sell (Short) when the price closes below the Supertrend line.
However, trading success isn’t only about entries — proper risk management makes all the difference. That’s why this strategy includes four stop-loss methods, two take-profit types, and a trailing stop-loss system. You can customize all of these settings to create your own personalized version.
🛑 Stop-Loss Methods
Tick – Uses the instrument’s smallest price increment. Ideal for tick-based markets such as Futures or Forex.
Percent – Defines the stop-loss as a percentage of entry price. Commonly used in Crypto trading.
ATR – Uses the Average True Range value to determine stop-loss distance. Perfect for adapting to changing market volatility.
Supertrend – The stop-loss level is set at the Supertrend line value at the time of entry.
🔁 Trailing Stop-Loss & Reverse Signals
Trailing SL: If enabled, the chosen stop-loss method will trail the price dynamically from the moment the position opens.
Close with Reverse Signals: When activated, the current position closes and reverses on an opposite signal. If disabled, the strategy waits until the current position is closed before opening a new one.
🎯 Take-Profit Options
Tick – Set a fixed take-profit level based on tick distance.
Percent – Set take-profit based on a percentage change from entry.
Ratio – Sets take-profit based on the entry-to-stop-loss distance × ratio value.
Each take-profit method allows you to define the percentage of position to close at that level.
⚖️ Breakeven Option
When Breakeven is enabled, after the first take-profit is triggered, the stop-loss automatically moves to the entry level, protecting your capital.
⚙️ Additional Settings
Position Type: Choose between Long only, Short only, or Both directions.
Session Filter: Trade only during specific time ranges. Activate this option and set your desired session hours (make sure to select your correct timezone).
📈 Visuals
The strategy plots entry, stop-loss, and take-profit levels directly on the chart, allowing you to clearly visualize your trades and manage them effectively.
Feel free to ask any questions or suggest improvements — this strategy is built for flexibility and experimentation!
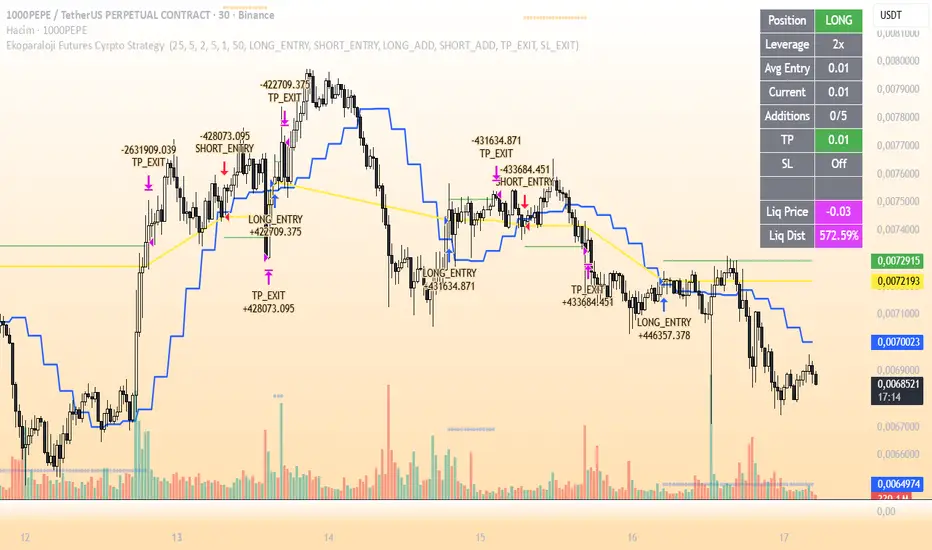
Ekoparaloji Futures Cyrpto Strategy Ekoparaloji Futures Crypto Strategy - Ladder Averaging System
This strategy uses a ladder position entry (pyramiding) approach and average cost reduction principle for crypto futures markets.
Key Features:
Dynamic ladder entry system
Profit-taking mechanism based on average price
Adjustable leverage support (1x-125x)
Long and Short position management
Optional stop-loss protection
Liquidation distance tracking
Advantages:
✓ Optimizes average cost during price fluctuations
✓ User-controlled risk-reward ratio
✓ Adapts to different market conditions
✓ Provides detailed visual feedback
✓ Increases profit potential through pyramiding strategy
Risks:
⚠ High leverage usage increases liquidation risk
⚠ Losses can accumulate during trend continuation
⚠ Pyramiding adds capital requirements
⚠ May produce unexpected results in sideways markets
⚠ Past performance does not guarantee future results
Recommended Usage:
This strategy is optimized for testing particularly on 30-minute and 1-hour timeframes. It may produce different results across various crypto pairs and market conditions.
Important Warning:
This strategy is for educational and research purposes. Extensive testing on demo accounts is strongly recommended before using in live trading. Leveraged trading involves high risk and you can lose all your capital.
📩 Message me to test the strategy and get access.
Happy Trading! 🚀
Multi-GPS (Long Only, with Alert Mode)A guided long‑only strategy with built‑in risk controls and smart alerts — your GPS for trend trading
**Multi‑GPS (Long Only, with Alert Mode)**
The Multi‑GPS strategy is built to help traders navigate trends with a structured, risk‑managed approach. It focuses exclusively on **long opportunities**, combining multiple moving‑average signals with layered risk controls to keep trades disciplined and consistent.
Key features include:
- **Dynamic trade management** with stop loss, take profit, and trailing stop options (all adjustable by percentage).
- **Flexible order sizing**, allowing positions to scale as a percentage of account equity.
- **Customizable moving averages** (SMA or EMA) and timeframe selection to adapt to different markets and styles.
- **Integrated alerts** with multiple modes, so traders can choose between order‑based notifications, alert() calls, or both.
- **Clear chart visuals**, including entry/exit markers and plotted guide lines for transparency.
This strategy is designed to act like a **navigation system for trend trading** — guiding entries, managing exits, and keeping risk under control, all while maintaining a clean and intuitive charting experience.
---
Would you like me to also craft a **short tagline version** (like a one‑liner hook) for this strategy, so it pairs neatly with the longer description when you publish it?

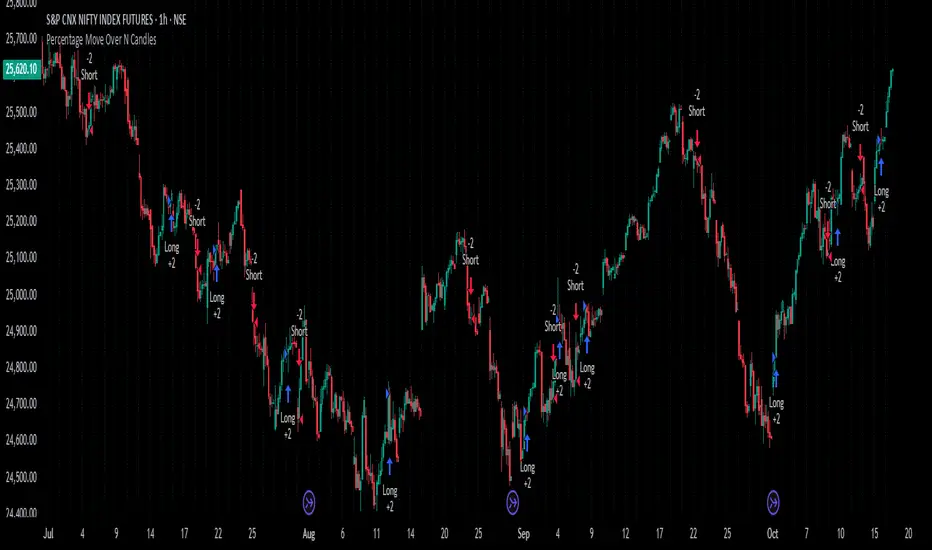
Percentage Move Over N CandlesThis strategy enters long/short trades if the price goes up/down by a certain defined percentage of the price, over a previous certain number of candles. Can be run on any time frame and on any instrument and alerts can be enabled.
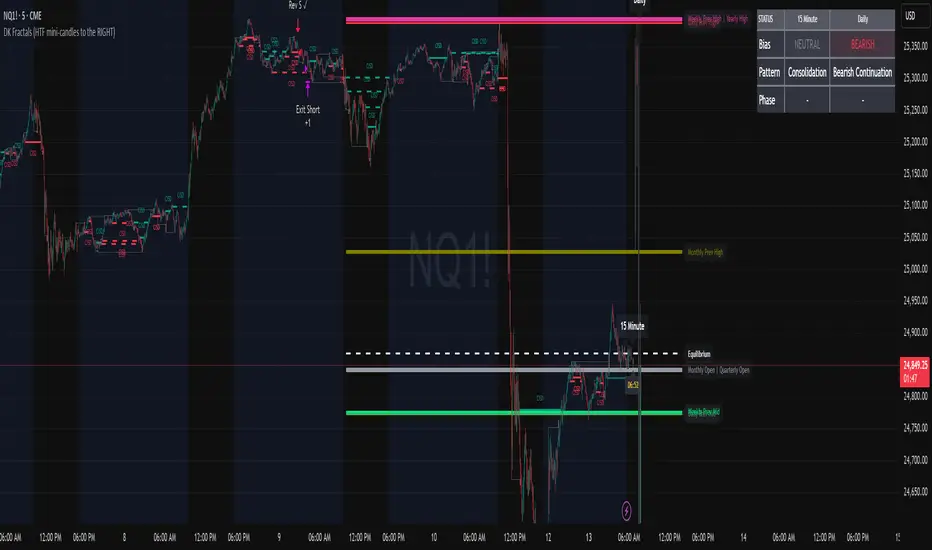
DK Fractals (Strategy)Convert to strategy. Introduce the first 2 trading models (Still heavily in development) The reversal and continuation models. More to come.
If you still want to use as an indicator, just disable the two trading models.
SPY200SMA (+4%/-3%) TQQQ/QQQ STRATEGYSummary of the Improved Strategy: When the price of AMEX:SPY is +4% above the 200SMA BUY NASDAQ:TQQQ and when the price of SPY drops to -3% under the SPY 200SMA SELL everything and slowly DCA into NASDAQ:QQQ over the next 6-12 months or until price returns to +4% above the SPY 200SMA at which point you will go back into 100% TQQQ.
Note: (if the price of QQQ goes 30% above the 200SMA of QQQ deleverage to QQQ or Sell to protect yourself from dot com level event)
More info and stats -https://www.reddit.com/r/LETFs/comments/1nhye66/spy_200sma_43_tqqqqqq_long_term_investment/

Ekoparaloji Cyrpto StrategyEkoparaloji Crypto Strategy - User Information Document
📊 Strategy Overview
This strategy provides long-term position management in cryptocurrency markets using the averaging down (pyramiding) technique. The basic logic is to controllably grow positions as prices decline and exit when specific profit targets are reached.
🎯 Key Features
✅ Automatic Entry System
Market direction is determined using a proprietary trend identification algorithm
Trades are only opened in uptrends
Initial position opens automatically when specific conditions are met
📈 Pyramiding Mechanism
New positions are automatically added as price decreases
Up to 10 positions can be added maximum
Each addition occurs at predetermined decline levels
Risk management through dynamic position sizing
💰 Profit and Loss Management
Take Profit: All positions close when the specified percentage above average cost is reached
Stop Loss (Optional): Protects a specified percentage of total capital
A certain ratio of available capital is used in each trade
📊 Visual Tracking System
The following information is displayed in real-time on the chart:
✅ Average cost level
✅ Profit target level
✅ Stop loss level (if active)
✅ Next pyramiding level
✅ Liquidation (capital reset) level
✅ Trend indicator
🛡️ Risk Management Features
1. Dynamic Capital Protection
Automatic exit when losses exceed a specified percentage of total capital
Complete loss scenario can be previewed through liquidation level calculation
2. Position Control System
Protection preventing multiple trades on the same bar
Double trigger prevention mechanism
Maximum position limit
3. Time Filter
Optional trading within a date range
Ideal for testing on historical data
📱 Information Panel
Information table always visible in the upper right corner of the strategy:
When Position is Open:
Number of active positions
Average cost
Current price
Total capital status
Capital loss percentage
Profit target
Stop loss level and distance
Next entry level
Liquidation level and distance
When No Position:
Market trend (Uptrend/Downtrend)
Ready to trade?
Reason for waiting
Initial position size
Target profit percentage
⚙️ Adjustable Parameters
Customizable by user:
💵 Capital Amount: Base amount to be used for each position
📊 Profit Target: Profit percentage at which to exit
🛑 Stop Loss: Usage status and maximum loss percentage
📅 Time Filter: Start and end dates for testing
💬 Trade Comments: Custom labels for each trade
📘 Understanding Leverage Effect
1. What is the Leverage Effect?
Although there's no real leverage in the spot market, when Capital Amount is increased, capital usage works like leverage:
Capital Amount 5% (1.0x): 100% capital usage with full pyramiding = All your money in trades
Capital Amount 10% (2.0x): 200% capital usage with full pyramiding = Attempting to open trades worth 2x your capital
Capital Amount 15% (3.0x): 300% capital usage with full pyramiding = Attempting to open trades worth 3x your capital
⚠️ IMPORTANT: If your capital runs out in the spot market, you cannot open new positions, therefore it's recommended to keep Capital Amount at 5% or below!
⚠️ Important Warnings
Pyramiding Risk: If price continues to decline, position grows and risk increases
Capital Requirements: Up to 10 positions can be added, requiring sufficient capital
Trend Dependency: Only works in uptrends
Backtest Results: Past performance is not a guarantee of future results
Real Trading Risks: Slippage, commissions, and market conditions can affect results
🎓 How to Use
Add the strategy to your chart
Adjust parameters according to your risk appetite
Examine past performance by backtesting
Optionally set up alerts to activate notifications
Test with paper trading first
This strategy is for educational purposes. Do your own research and only trade with capital you can afford to lose.
Disclaimer: This strategy is not financial advice. All investment decisions are the user's responsibility.
Happy trading! 📊

Ekoparaloji Strategy Crypto Ekoparaloji Crypto Strategy - User Information Document
📊 Strategy Overview
This strategy provides long-term position management in cryptocurrency markets using the averaging down (pyramiding) technique. The basic logic is to controllably grow positions as prices decline and exit when specific profit targets are reached.
🎯 Key Features
✅ Automatic Entry System
Market direction is determined using a proprietary trend identification algorithm
Trades are only opened in uptrends
Initial position opens automatically when specific conditions are met
📈 Pyramiding Mechanism
New positions are automatically added as price decreases
Up to 10 positions can be added maximum
Each addition occurs at predetermined decline levels
Risk management through dynamic position sizing
💰 Profit and Loss Management
Take Profit: All positions close when the specified percentage above average cost is reached
Stop Loss (Optional): Protects a specified percentage of total capital
A certain ratio of available capital is used in each trade
📊 Visual Tracking System
The following information is displayed in real-time on the chart:
✅ Average cost level
✅ Profit target level
✅ Stop loss level (if active)
✅ Next pyramiding level
✅ Liquidation (capital reset) level
✅ Trend indicator
🛡️ Risk Management Features
1. Dynamic Capital Protection
Automatic exit when losses exceed a specified percentage of total capital
Complete loss scenario can be previewed through liquidation level calculation
2. Position Control System
Protection preventing multiple trades on the same bar
Double trigger prevention mechanism
Maximum position limit
3. Time Filter
Optional trading within a date range
Ideal for testing on historical data
📱 Information Panel
Information table always visible in the upper right corner of the strategy:
When Position is Open:
Number of active positions
Average cost
Current price
Total capital status
Capital loss percentage
Profit target
Stop loss level and distance
Next entry level
Liquidation level and distance
When No Position:
Market trend (Uptrend/Downtrend)
Ready to trade?
Reason for waiting
Initial position size
Target profit percentage
⚙️ Adjustable Parameters
Customizable by user:
💵 Capital Amount: Base amount to be used for each position
📊 Profit Target: Profit percentage at which to exit
🛑 Stop Loss: Usage status and maximum loss percentage
📅 Time Filter: Start and end dates for testing
💬 Trade Comments: Custom labels for each trade
📘 Understanding Leverage Effect
1. What is the Leverage Effect?
Although there's no real leverage in the spot market, when Capital Amount is increased, capital usage works like leverage:
Capital Amount 5% (1.0x): 100% capital usage with full pyramiding = All your money in trades
Capital Amount 10% (2.0x): 200% capital usage with full pyramiding = Attempting to open trades worth 2x your capital
Capital Amount 15% (3.0x): 300% capital usage with full pyramiding = Attempting to open trades worth 3x your capital
⚠️ IMPORTANT: If your capital runs out in the spot market, you cannot open new positions, therefore it's recommended to keep Capital Amount at 5% or below!
⚠️ Important Warnings
Pyramiding Risk: If price continues to decline, position grows and risk increases
Capital Requirements: Up to 10 positions can be added, requiring sufficient capital
Trend Dependency: Only works in uptrends
Backtest Results: Past performance is not a guarantee of future results
Real Trading Risks: Slippage, commissions, and market conditions can affect results
🎓 How to Use
Add the strategy to your chart
Adjust parameters according to your risk appetite
Examine past performance by backtesting
Optionally set up alerts to activate notifications
Test with paper trading first
This strategy is for educational purposes. Do your own research and only trade with capital you can afford to lose.
Disclaimer: This strategy is not financial advice. All investment decisions are the user's responsibility.

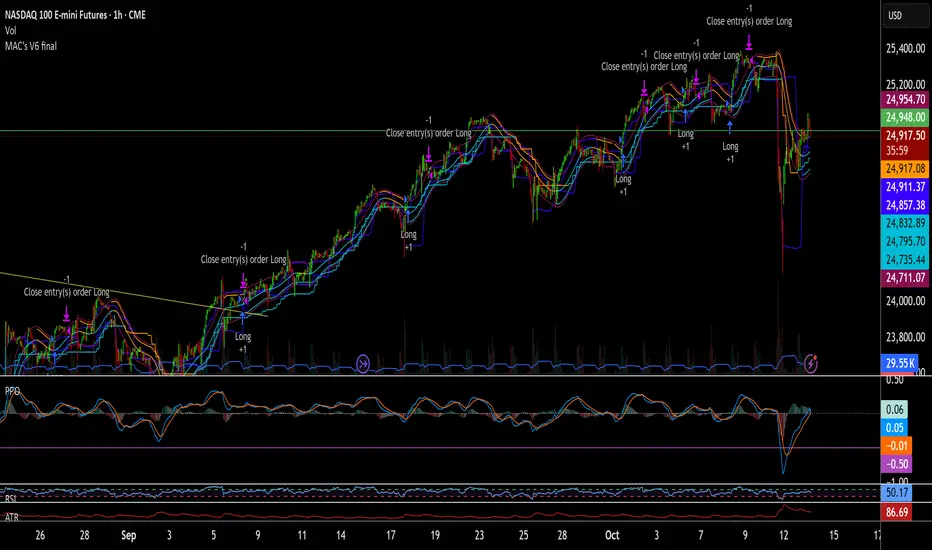
MAC's V6 finalBreakout retest strategy
Works best on a NQ 1 hour chart
Also works on other futures charts
Adjust the initial capital to 100000
and the margin requirement percent to 0
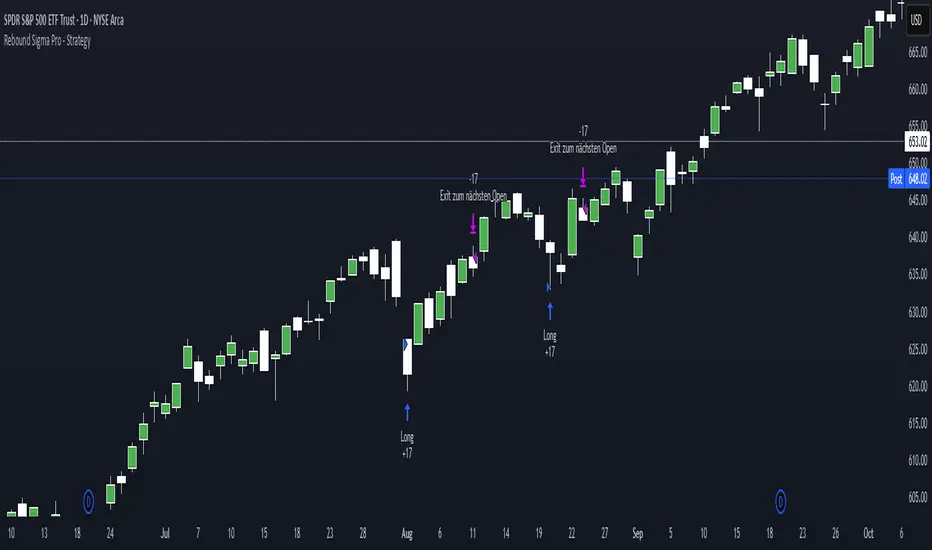
Rebound Sigma Pro - StrategyOverview
Rebound Sigma Pro is a mean-reversion indicator that detects statistically oversold conditions in trending markets.
It helps traders identify potential short-term rebounds based on momentum exhaustion and volatility-adjusted entry zones.
Concept
The indicator combines two quantitative components:
Short-term momentum to detect short-term exhaustion
Trend filter to ensure setups align with the long-term direction
When a stock in an uptrend becomes temporarily oversold, a limit-entry signal is plotted.
The trade is then tracked until short-term conditions normalize or a time-based exit occurs.
Visual Signals
Green Triangle: Suggests placing a limit order for the next session
Green Circle: Confirms entry was filled
Red Triangle: Signals an exit for the next session’s open
Orange Background: Pending order
Green Background: Position active
Red Background: Exit phase
Yellow Line: Entry reference price
User Inputs
Limit Entry (% below previous close) – Default 1 %
Use Limit Entry – Switch between limit or market entries
Enable Time Exit – Optional holding-period constraint
Maximum Holding Days
All other internal parameters (momentum length, filters) are pre-configured.
Alerts
Limit Order Signal: New setup detected
Entry Confirmed: Order filled
Exit Signal: Exit expected next day
Usage
Designed for liquid equities and ETFs
Works best in confirmed uptrends
Backtesting encouraged to adapt parameters per symbol and timeframe
Notes
Not an automated strategy; manual order execution required
Past behavior does not imply future performance
Always apply sound position sizing and risk management
Disclaimer
This indicator is provided for educational and analytical purposes only.
It does not constitute financial advice or performance assurance.
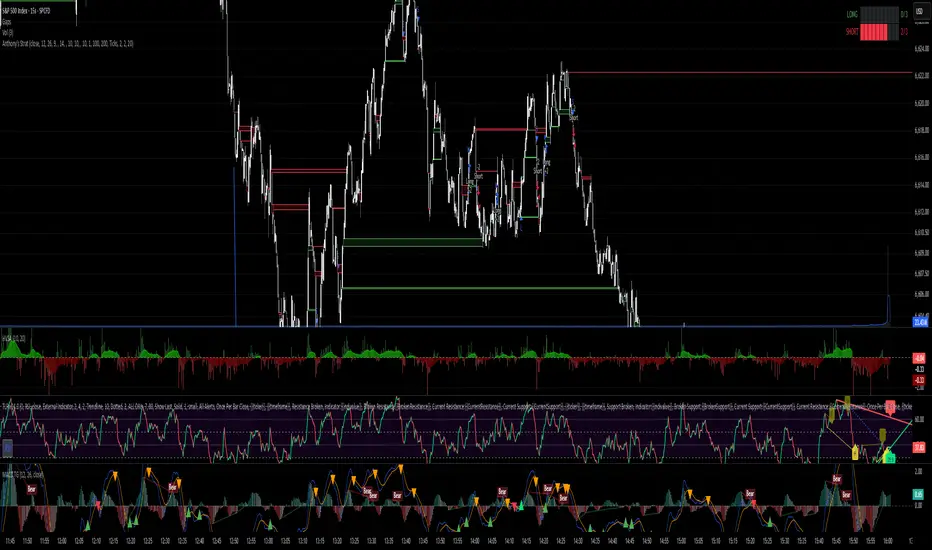
Anthony's trading strategyWait for signal to print and a continuation candle to enter trade. If no continuation candle, disregard signal.
Tight Entry Trend Engine Strategy═══════════════════════════════════════
TIGHT ENTRY TREND ENGINE
═══════════════════════════════════════
A breakout-based trend-following system designed to capture explosive
moves by entering at precise resistance/support breakouts with minimal
entry risk and massive profit potential.
⚠️ LOW WIN RATE, HIGH REWARD SYSTEM ⚠️
This is NOT a high win-rate strategy. Expect 25-35% winners, but
when it hits, winners are typically 10X+ larger than losers.
═══════════════════════════════════════
🎯 WHAT THIS SYSTEM DOES
═══════════════════════════════════════
The Tight Entry Trend Engine identifies powerful breakout opportunities
by detecting when price breaks through established trendlines with
confirmation from higher timeframe trends:
1. DYNAMIC TRENDLINE DETECTION (3 BANKS)
• Automatically draws support and resistance trendlines
• 3 separate "banks" capture short-term, medium-term, and long-term levels
• Each bank has configurable parameters (required pivot touch count,
angle limits, lengths)
2. BREAKOUT ENTRY TIMING
• Enters LONG when price breaks ABOVE resistance trendlines
• Enters SHORT when price breaks BELOW support trendlines
• Entry Alert occurs at the exact moment of breakout = "tight entry"
• Stop-loss placed just below/above the broken trendline (configurable)
3. HIGHER TIMEFRAME TREND FILTER
• Uses Hull Moving Average (HMA) on higher timeframe for trend following
• Auto-adjusts HTF based on your chart timeframe
• Optional filters prevent entries against major trend
• Optional "overextension" filter avoids buying parabolic moves
4. VOLATILITY-ADAPTIVE RISK MANAGEMENT
• Stop-loss calculated using Average True Range (ATR)
• Tighter stops = better R:R
• Profit targets adjust dynamically with volatility
• Breakeven stop moves automatically when in profit
• Extended profit targets when far from HTF trend
═══════════════════════════════════════
📊 HOW IT WORKS (METHODOLOGY)
═══════════════════════════════════════
STEP 1: TRENDLINE FORMATION
The system continuously scans for pivot highs and pivot lows to
construct trendlines. You control:
BANK 1 (Short-Term):
- Pivot Length: How many bars to look back for swing points
- Min Touches: How many pivots needed to form a line (default: 3)
- Max Length: How far back lines can reach (default: 180 bars)
- Angle Limits: Maximum steepness allowed for valid trendlines
- Tolerance: How close pivots must align to form horizontal lines
BANK 2 (Medium-Term):
- Slightly longer pivot periods for more significant levels
- Captures medium-term trend structure
- Default Max Length: 200 bars
BANK 3 (Long-Term):
- Focuses on major support/resistance zones
- Often uses horizontal levels (angled lines disabled by default)
- Default Max Length: 300 bars
The system draws RESISTANCE lines (red) above price and SUPPORT
lines (green) below price. These adapt in real-time as new pivots form.
STEP 2: BREAKOUT DETECTION
LONG SIGNALS:
- Price closes above a resistance trendline
- Higher timeframe trend is up (optional filter)
- Price not overextended from HTF trend (optional filter)
- No position currently open
SHORT SIGNALS:
- Price closes below a support trendline
- Higher timeframe trend is down (optional filter)
- Price not overextended from HTF trend (optional filter)
- No position currently open
The "tight" aspect: Because you're entering right at the trendline
break, your stop-loss can be placed very close (just below the
broken resistance for longs), creating exceptional risk/reward ratios.
STEP 3: POSITION SIZING
Choose between:
- Fixed $ Risk Per Trade: Risk same dollar amount every trade
- % Risk Per Trade: Risk percentage of current equity
Position size automatically calculated based on:
- Your risk amount
- Distance to stop-loss (ATR-based)
- Works with stocks, futures, crypto (auto-adjusts for contract multipliers)
STEP 4: EXIT MANAGEMENT
Multiple exit methods working together:
- PROFIT TARGET: Exits when profit reaches 100x your risk
- EXTENDED PROFIT: Earlier exit (80R) when very far from HTF trend
- STOP LOSS: Fixed ATR-based stop below entry
- HTF TREND EXIT: Exits when price crosses below HTF trend with profit
- BREAKEVEN PULLBACK: Exits if profit drops below 0.6R after reaching breakeven
- PARTIAL PROFITS: Optional - take partial profits at specified R-multiple
═══════════════════════════════════════
🔧 KEY COMPONENTS EXPLAINED
═══════════════════════════════════════
HULL MOVING AVERAGE (HMA)
A smoothed moving average that reduces lag compared to traditional
MAs. The system uses HMA on a higher timeframe to determine the
dominant trend direction. You can choose:
- Auto HTF: System picks appropriate HTF based on your chart timeframe
- Manual HTF: You specify the higher timeframe
AVERAGE TRUE RANGE (ATR)
Measures current market volatility. Used for:
- Stop-loss distance (tighter when volatility low)
- Profit targets (larger when volatility high)
- Position sizing (smaller positions in volatile conditions)
- Breakeven trigger distance
TRENDLINE ANGLE FILTERING
Each trendline bank has angle limits to ensure quality:
- Resistance lines: Max downward/upward slope allowed
- Support lines: Max downward/upward slope allowed
- Angles automatically adjust based on current volatility
- Prevents overly steep/unreliable trendlines
SENSITIVITY CONTROL
One master slider adjusts multiple parameters:
- Trendline detection sensitivity
- HTF MA length
- Exit timing
- Auto-adjusts for daily+ timeframes (60% increase)
═══════════════════════════════════════
⚙️ WHAT YOU SEE ON YOUR CHART
═══════════════════════════════════════
TRENDLINES:
✓ Red resistance lines above price
✓ Green support lines below price
✓ Orange broken lines (past breakouts)
✓ Lines extend to show current levels
HTF TREND:
✓ Thick colored line showing higher timeframe trend
✓ Color gradient: Red (bearish) → Orange → Yellow → Green (bullish)
✓ 250-bar smoothed curve for visual clarity
ENTRY/EXIT SIGNALS:
✓ Small green dot below bar = Long entry
✓ Small red dot above bar = Short entry
✓ Small red dot above = Long exit
✓ Small black dot below = Short exit
OPTIONAL DETAILED LABELS:
✓ Bank number that triggered entry (Bank 1, 2, or 3)
✓ Exit reason (Profit Target, Stop Loss, HTF Exit, etc.)
✓ Partial profit notifications
POSITION TRACKING:
✓ Yellow dashed line at entry price (extends right)
✓ Green/red fill showing current profit/loss zone
✓ Lime arrows at top = Currently in long position
✓ Red arrows at bottom = Currently in short position
✓ Gray background = No position (flat)
STATS TABLE (Top Right):
✓ Current position (LONG/SHORT/FLAT)
✓ Risk per trade ($ or %)
✓ Entry price
✓ Unrealized P/L in dollars
✓ P/L in R-multiples (how many R's profit/loss)
✓ Average winner/loser R ($ mode) OR CAGR (% mode)
═══════════════════════════════════════
📈 OPTIMAL USAGE
═══════════════════════════════════════
BEST ASSETS:
- NASDAQ:QQQ on 1-hour (reg) chart ⭐ (PRIMARY OPTIMIZATION)
- Strong trending stocks: NVDA, AAPL, TSLA, MSFT, GOOGL, AMZN
- High volatility tech stocks
- Crypto: BTC, ETH
- Any liquid asset with clear trends and momentum (GOLD)
AVOID:
- Low volatility stocks
- Ranging/choppy markets
- Penny stocks or illiquid assets
- Assets without clear directional movement
BEST TIMEFRAMES:
- PRIMARY: 1-hour charts (optimal for QQQ)
- ALSO EXCELLENT: 2H, 4H, 8H
- WORKS: 15min, 30min (only momentum leaders, more noise)
- WORKS WITH ADJUSTMENTS: 1D, 2D (decrease trendline pivot lengths)
═══════════════════════════════════════
📊 BACKTEST RESULTS (QQQ 1H (Reg hours), 1999-2024)
═══════════════════════════════════════
The system showed on NASDAQ:QQQ 1-hour timeframe (regular hours):
- Total Return: 1,100,000%+ over 24 years
- Total Trades: 500+
- Win Rate: ~20-24% (LOW - this is by design!)
- Average Winner: 8-15% gain
- Average Loser: 2-4% loss
- Win/Loss Ratio: 10:1 (winners much bigger than losers)
- Profit Factor: 3+
- Max Drawdown: 45-50%
- Risk per trade: 3% of capital
KEY INSIGHT: This is a LOW WIN RATE, HIGH REWARD system. You will
lose more trades than you win, but the few winners are so large
they more than compensate for many small losses.
IMPORTANT: These are backtested results using optimal parameters
on historical data. Real trading results will vary based on:
- Your execution and timing
- Slippage and commissions
- Your emotional discipline
- Market conditions during your trading period
═══════════════════════════════════════
🎓 WHO IS THIS FOR?
═══════════════════════════════════════
IDEAL FOR:
✓ Swing traders comfortable holding winners for longer period
✓ Part-time traders (1H = check 2-3x per day)
✓ Traders seeking exceptional risk/reward ratios
✓ Those comfortable with low win rates if winners are huge
✓ Technical analysis enthusiasts
✓ Breakout traders
✓ Trend followers
═══════════════════════════════════════
🚀 GETTING STARTED - STEP BY STEP
═══════════════════════════════════════
STEP 1: APPLY TO YOUR CHART
- Search "Tight Entry Trend Engine" in indicators
- Click to apply to your chart
- Trendlines and HTF line will appear immediately
STEP 2: CHOOSE YOUR SETTINGS
For BEGINNERS - Use These Settings First:
1. Trade Direction & Filters:
• ENABLE LONGS: ✓ ON
• ENABLE SHORTS: ✗ OFF (start with longs only)
• Sensitivity: 1.0 (default)
• HTF Trend Entry Filter: ✓ ON (safer entries)
• Block Entries When Overextended: ✓ ON (avoid parabolic tops)
2. Position Sizing & Risk:
• Position Sizing: "Per Risk"
• RISK Type: "$ Per Trade"
• Risk Amount: $200 (or 1-3% of your account)
3. Visual Settings:
• Show Support Lines: ✗ OFF (unless trading shorts)
• Show Detailed Entry/Exit Labels: ✓ ON
• Show Stats Table: ✓ ON
• Show Entry Line & P/L Fill: ✓ ON
4. Leave everything else at DEFAULT for now
STEP 3: UNDERSTAND WHAT YOU SEE
When trendlines appear:
- RED lines above = Resistance (watch for price breaking UP through these)
- GREEN lines below = Support (watch for price breaking DOWN)
- When price breaks a red line = Potential LONG entry
- When price breaks a green line = Potential SHORT entry
The HTF trend line (thick colored):
- Green/lime = Strong uptrend (favorable for longs)
- Red = Strong downtrend (favorable for shorts if enabled)
- Orange/yellow = Transitioning
STEP 4: OBSERVE SIGNALS
- Small GREEN dot below bar = System entered LONG
- Small RED dot above bar = System exited LONG
- Check the label to see which "Bank" triggered (Bank 1, 2, or 3)
- Watch the yellow entry line and colored fill show your P/L
STEP 5: PAPER TRADE FIRST
- Use TradingView's paper trading feature
- Watch how signals perform on YOUR chosen asset
- Understand the win rate will be LOW (20-35%)
- Verify that winners are indeed much larger than losers
- Test for at least 20-30 signals before going live
STEP 6: OPTIMIZE FOR YOUR ASSET (OPTIONAL)
If default settings aren't working well:
For FASTER signals (more trades):
- Reduce Pivot Length 1 to 3-4
- Reduce Max Length 1 to 120-150
- Increase Sensitivity to 1.2-1.5
For SLOWER signals (higher quality):
- Increase Pivot Length 1 to 7-10
- Increase Max Length 1 to 250+
- Decrease Sensitivity to 0.7-0.9
For DAILY timeframes:
- Increase all Pivot Lengths by 30-50%
- Increase all Max Lengths significantly
- Sensitivity: 0.6-0.8
═══════════════════════════════════════
⚙️ ADVANCED SETTINGS EXPLAINED
═══════════════════════════════════════
TRENDLINE BANK SETTINGS:
Each bank (1, 2, 3) has these parameters:
- Min Touches: Minimum pivots to form a line
- Lower (2) = More lines, earlier detection
- Higher (4+) = Fewer lines, higher quality
- Pivot Length: Lookback for swing points
- Lower (3-5) = Reacts to recent price action
- Higher (10+) = Only major swing points
- Max Length: How old a trendline can be
- Shorter (100-150) = Only recent lines
- Longer (300+) = Include historical levels
- Tolerance: Alignment strictness for horizontal lines
- Lower (3.0-3.5) = Very strict horizontal
- Higher (4.5+) = More forgiving alignment
- Allow Angled Lines: Enable diagonal trendlines
- ON = Catches sloped support/resistance
- OFF = Only horizontal levels
- Angle Limits: Maximum steepness allowed
- Lower (1-2) = Only gentle slopes
- Higher (4-6) = Accept steeper angles
- Automatically adjusts for volatility
ATR MULTIPLIERS:
- STOP LOSS ATR (0.6): Distance to stop-loss
- Lower (0.4-0.5) = Tighter stops, stopped out more
- Higher (0.8-1.0) = Wider stops, more room
- PROFIT TARGET ATR (100): Main profit target
- This is 100x your risk = 10,000% R:R
- Lower (50-80) = Take profits sooner
- Higher (120+) = Let winners run longer
- BREAKEVEN ATR (40): When to move stop to breakeven
- Lower (20-30) = Protect profits earlier
- Higher (60+) = Give more room before protecting
HIGHER TIMEFRAME:
- Auto HTF: Automatically selects appropriate HTF
- 5min chart → uses 2H
- 15-30min → uses 6H
- 1-4H → uses 2D
- Daily → uses 4D
- HTF MA Length (300): HMA period for trend
- Lower (150-250) = More responsive
- Higher (400-500) = Smoother, less whipsaw
- HTF Trend Following Exit: Exits when crossing HTF
- ON = Additional exit method
- OFF = Rely only on profit targets/stops
- HTF Trend Entry Filter: Only trade with HTF trend
- ON = Safer, fewer signals
- OFF = More aggressive, more signals
- Block Entries When Overextended: Prevents chasing
- ON = Avoids parabolic tops/bottoms
- OFF = Enter all breakouts regardless
═══════════════════════════════════════
💡 TRADING PHILOSOPHY & EXPECTATIONS
═══════════════════════════════════════
This system is built on one core principle:
"ACCEPT SMALL, FREQUENT LOSSES TO CAPTURE RARE, MASSIVE WINS"
What this means:
- You WILL lose 65%-75% of your trades
- Most losses will be small (1-2R)
- Some winners hit 80R+
- Over time, math works in your favour

Ajay R5.41🔻 Ajay Gold 3H Power Indicator 🔻
Precision-Based Smart Sell System for Gold (XAU/USD)
💡 Overview
This indicator is specifically designed for Gold (XAU/USD) and delivers best results on the 3-Hour Timeframe (3H TF).
It is a Smart Money Logic-based Sell Confirmation System, combining institutional structure and candle behavior to generate highly accurate bearish signals.
⚙️ Technical Foundation
The indicator uses multiple advanced confirmations:
📉 EMA Trend Filter → Confirms downtrend
💪 RSI Overbought Rejection → Momentum reversal signal
📊 MACD Bearish Cross → Confirms trend strength
🕯️ Bearish Candle Structure → Price action validation
When all conditions align, a clear 🔻 Sell Signal is plotted on the chart.
💎 Hidden Feature
This indicator includes a hidden feature that activates only when the correct market structure forms.
It helps reduce false signals and increases accuracy without being visible on the chart — fully automated internal logic.
📆 Recommended Settings
Symbol: XAU/USD (Gold)
Timeframe: 3-Hour (3H)
Market: Forex / Commodity
Mode: Sell-Only Confirmation Indicator
Performance: Best precision and consistency on 3H TF
📈 How to Use
Select XAU/USD on chart and set 3H timeframe.
Add the indicator to the chart.
Wait for the 🔻 Sell Signal and confirm the market structure after candle close.
Take entry according to your risk management.
⚠️ Disclaimer
This indicator is for educational and analytical purposes only.
No system is 100% accurate — always backtest and demo trade before using in real trading.
💬 Credits
Developed by Ajay Sahu (India)
Based on Institutional & Smart Money Logic
Best results on 3H TF
Hidden Algorithm for XAU/USD traders
