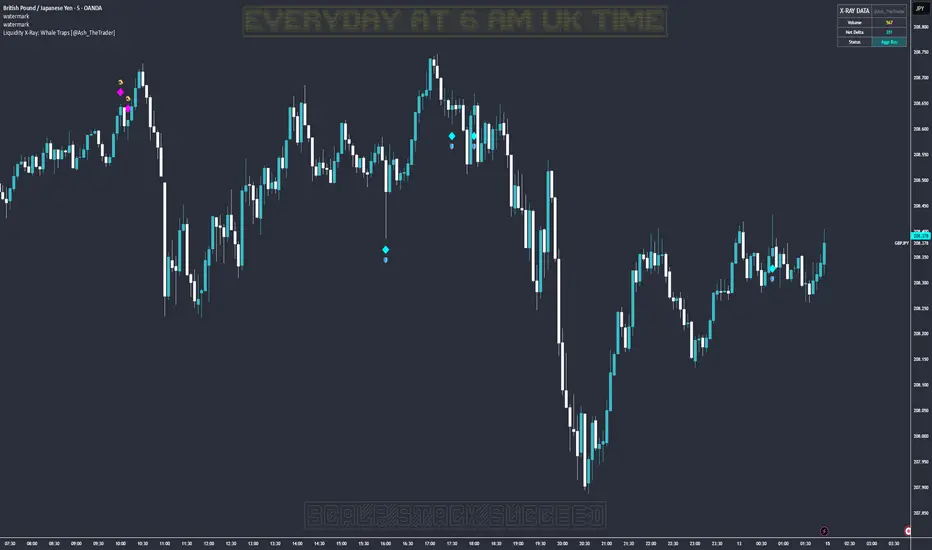
Liquidity X-Ray: Whale Traps [@Ash_TheTrader]👁️ Liquidity X-Ray: The Institutional Edge
Stop Trading Blind. See Inside the Candle.
Ninety percent of retail traders only see the outer shell of a candlestick—the Open, High, Low, and Close. They are trading blind to the actual battle that took place during that candle's formation.
Institutions, however, use expensive Order Flow software to see where aggressive buying or selling is happening in real-time.
The Liquidity X-Ray Strategy, developed by @Ash_TheTrader, levels the playing field. It uses advanced Intrabar Analysis to simulate institutional order flow footprints directly on your TradingView chart, automating powerful reversal signals based on "Absorption."
🧠 The Concept: Intrabar Analysis & Delta
How does it work?
Imagine a single 1-Hour candle. Inside that candle, there are sixty 1-Minute candles hidden from view.
This strategy performs an "X-Ray" scan. It tunnels into the lower timeframes (e.g., 5-minute data inside a 1-hour bar) to calculate the Net Delta—the difference between aggressive buying volume and aggressive selling volume.
Cyan Candles: Indicate that aggressive buyers (hitting the Ask) won the internal battle.
Magenta Candles: Indicate that aggressive sellers (hitting the Bid) won the internal battle.
But knowing who won isn't enough. The real edge comes from identifying Absorption.
🎯 The Signals: Detecting Traps & Shields
The core philosophy of this strategy by @Ash_TheTrader is simple: Identify where high effort yields low results.
When massive volume comes in, but price refuses to move, it means one side is being "absorbed" by a larger player. This is often the precursor to a violent reversal.
1. The Bear Trap (🪤)
What you see: A candle with massive volume and aggressive internal buying (positive Delta), yet the candle body remains small and fails to push price significantly higher.
The Psychology: Retail traders are FOMO-buying aggressively at a high. Institutional "Whales" are sitting on the other side, passively selling into this demand, absorbing all the buy orders without letting price rise.
The Result: Once the buyers are exhausted, the trap snaps shut, and price reverses downward.
Strategy Action: Enters a SHORT position.
2. The Bull Shield (🛡️)
What you see: A candle with massive volume and aggressive internal selling (negative Delta), yet the candle body remains small and fails to push price lower.
The Psychology: A "Stop Run" is occurring. Retail traders are panic-selling. Smart money is stepping in like a shield, absorbing all the sell pressure at a fixed level.
The Result: Once the sellers are exhausted, there is no one left to sell, and price rallies upward.
Strategy Action: Enters a LONG position.
⚡ Strategy Features & The Viral Dashboard
This isn't just an indicator; it's a complete, automated trading system.
Automated Execution: The script takes the trades for you when a Shield or Trap is confirmed upon candle close.
Smart Risk Management: It automatically places Stop Losses beyond the wick of the signal candle and targets a default 2:1 Risk/Reward ratio.
The Live Performance Panel: Look at the top right of your chart. The strategy features a built-in, professional-grade dashboard that displays real-time statistics. You can instantly see the strategy's Win Rate and Net Profit over the current historical data.
"Numbers don't lie. Don't just guess if a setup works; watch the win rate adjust in real-time." — @Ash_TheTrader
🛠️ How to Use This Strategy
For the best results, follow these institutional guidelines:
Timeframe: This strategy is most effective on Higher Timeframes where institutional volume is dominant. We recommend the 1-Hour (1H) or 4-Hour (4H) charts.
Intrabar Resolution (Settings): In the strategy settings, ensure the "Intrabar Resolution" is set lower than your chart timeframe. The default is 5 minutes, which is ideal for scanning inside 1H or 4H candles.
Confluence: While the strategy can be traded standalone, the best signals often occur near major support/resistance zones or key Fibonacci levels.
⚠️ Disclaimer
This strategy uses request.security_lower_tf to perform its calculations. While highly accurate, past performance on the dashboard does not guarantee future results. Always manage your risk responsibly.
Trade smart. See the liquidity.
~ @Ash_TheTrader
Traps
BT Delta AbsorptionBT Absorption detects aggressive counterflow volume—moments where one side
of the market (buyers or sellers) attacks aggressively, yet price fails to move
proportionally.
This is the classic definition of absorption:
"Large market orders are being absorbed by strong passive limit orders."
Absorption is one of the most reliable early signals for:
Reversals
Trap conditions
Failed breakouts
Liquidity grabs
Fake displacement moves
---
■ What BT Absorption Measures
1. Delta Imbalance
Identifies when buying or selling pressure becomes unusually one-sided.
2. Volatility Mismatch
Shows when large delta does NOT translate into meaningful price movement.
3. Absorption Strength Score
A normalized reading (often 0–100) showing the intensity of counterflow activity.
4. Wick & Structure Absorption
Wick-driven absorption helps identify:
Failed sweeps
Stop hunts
Rejection zones
Trapped traders
---
■ Why Absorption Matters
Absorption almost always precedes:
Reversals
Failed breakout moves
SMC/ICT-style displacement
Order block formation
Trend continuation after a trap
When aggressive traders cannot move price toward their desired direction,
the move typically reverses quickly—and with force.
---
■ Visual Elements
• Bull Absorption Marker
Often appears near lows—signals seller aggression failing to push price down.
• Bear Absorption Marker
Often appears near highs—signals buyer aggression failing to break higher.
• Absorption Score Heatmap (optional)
Shows intensity of absorption per candle.
• Threshold Levels
Identify when absorption becomes statistically significant.
---
■ How to Use BT Absorption in Trading
1. Reversal Detection
Look for absorption after:
Equal highs/lows
Sweeps
Stop runs
Breakout failures
This is often the earliest possible signal that a reversal is coming.
2. Filter Breakouts
A breakout without absorption is usually weak.
A breakout with absorption against it is likely a fakeout.
3. Confirm SMC/ICT Concepts
The indicator pairs perfectly with:
Fair Value Gaps
Order Blocks
Liquidity sweeps
Displacement legs
If your setup triggers and absorption confirms → high confidence.
4. Identify Trap Conditions
Absorption often marks:
Trapped breakout chasers
Trapped trend shorts
Imbalanced orderflow
These create ideal high-R trades.
5. Alert-Driven Market Monitoring
Use alerts for:
Bull Absorption
Bear Absorption
High-strength absorption
Absorption clusters
This allows traders to step away from charts while still catching
high-probability reversals.
---
■ High-Probability Absorption Setups
A) Sweep + Absorption
Swept level → absorption → enter opposite direction.
B) Failed Breakout Absorption
Breaks structure → delta fails → absorption prints → strong reversal.
C) Trend Continuation Absorption
Absorption against the correction often precedes continuation.
D) Absorption Clusters
Multiple absorption signals indicate a structural market shift.
---
■ Final Summary
BT Absorption provides:
Early reversal signals
Counterflow pressure detection
Confirmation for existing setups
Identification of liquidity traps
Alert-based monitoring across multiple markets
BT Absorption is the perfect complement to BT Spike:
• BT Spike = detects volatility ignition
• BT Absorption = detects failed aggression + reversals
Combined, they form a complete liquidity and orderflow toolkit.

Retail Sentiment Indicator - Multi-Asset CFD & Fear/Greed IndexRetail Sentiment Indicator - Multi-Asset CFD & Fear/Greed Index
Overview
The Retail Sentiment Indicator provides real-time sentiment data for major financial instruments including stocks, forex, commodities, and cryptocurrencies. This indicator displays retail trader positioning and market sentiment using CFD data and fear/greed indices.
Methodology and Scale Calculation
This indicator operates on a **-50 to +50 scale** with zero representing perfect market equilibrium.
Scale Interpretation:
- **Zero (0)**: Market balance - exactly 50% of investors buying, 50% selling
- **Positive values**: Majority buying pressure
- Example: If 63% of investors are buying, the indicator shows +13 (63 - 50 = +13)
- **Negative values**: Majority selling pressure
- Example: If 92% of investors are selling, the indicator shows -42 (50 - 92 = -42)
BTC Fear & Greed Index Scaling:
The original `BTC FEAR&GREED` index is natively scaled from 0-100 by its creator. In our indicator, this data has been rescaled to also fit the -50 to +50 range for consistency with other sentiment data sources.
This unified scaling approach allows for direct comparison across all instruments and data sources within the indicator.
-Important Data Source Selection-
Bitcoin (BTC) Data Sources
When viewing Bitcoin charts, the indicator offers **two different data sources**:
1. **Default Auto-Mode**: `BTCUSD Retail CFD` - Retail CFD traders sentiment data (automatically loaded).
2. **Manual Selection**: `BTC FEAR&GREED` - Fear & Greed Index from website: alternative dot me
**To access BTC Fear & Greed Index**: Input settings -> disable checkbox "Auto-load Sentiment Data" -> manually select "BTC FEAR&GREED" from the dropdown menu.
US Stock Market Data Sources
For US stocks and indices (S&P 500, NASDAQ, Dow Jones), there are **two data source options**:
1. **Default Auto-Mode**: Individual retail CFD sentiment data for each instrument
2. **Manual Selection**: `SNN FEAR&GREED` - SNN's Fear & Greed Index covering the overall US market sentiment. SNN was used as the name to avoid any potential trademark infringement.
**To access SNN Fear & Greed Index**: When viewing US market charts, disable in input settings checkbox "Auto-load Sentiment Data" and manually select "SNN FEAR&GREED" from the dropdown menu.
This distinction allows traders to choose between **instrument-specific retail sentiment** (auto-mode) or **broader market sentiment indices** (manual selection).
Features
- **Auto-Detection**: Automatically loads sentiment data based on the current chart symbol
- **Manual Selection**: Choose from 40+ supported instruments when auto-detection is unavailable
- **Multiple Data Sources**: Combines retail CFD sentiment with Fear & Greed indices
- **Visual Zones**: Clear greed/fear zones with color-coded backgrounds
- **Real-time Updates**: Live sentiment data from merged data sources
Supported Instruments
Major Indices
- S&P 500, NASDAQ, Dow Jones 30, DAX
Forex Pairs
- Major pairs: EURUSD, GBPUSD, USDJPY, USDCHF, USDCAD
- Cross pairs: EURJPY, GBPJPY, AUDUSD, NZDUSD, and 20+ others
Commodities
- Precious metals: Gold (XAUUSD), Silver (XAGUSD)
- Energy: WTI Oil
- Agricultural: Wheat, Coffee
- Industrial: Copper
Cryptocurrencies
- Bitcoin (BTC) sentiment data
- BTC & SNN Fear & Greed indices
How to Use
1. **Auto Mode** (Default): Enable "Auto-load Sentiment Data" to automatically display sentiment for the current chart symbol
2. **Manual Mode**: Disable auto-load and select from the dropdown menu for specific instruments
3. **Interpretation**:
- Values above 0 (green) indicate retail greed/bullish sentiment
- Values below 0 (red) indicate retail fear/bearish sentiment
- Fear & Greed indices use 0-100 scale (50 is neutral)
Data Sources
This indicator uses curated sentiment data from retail CFD providers and established fear/greed indices. Data is updated regularly and sourced from reputable financial data providers.
Trading Strategy & Market Philosophy
Contrarian Trading Approach
The primary purpose of this indicator is based on the fundamental market principle that **the majority of retail investors are often wrong**, and markets typically move opposite to the positions held by the majority of market participants.
Key Strategy Guidelines:
- **Contrarian Signal**: When the majority of users are positioned on one side of the market, there is statistically greater market advantage in taking positions in the opposite direction
- **Trend Exhaustion Signal**: An interesting observed phenomenon occurs when, during a long-lasting trend where the majority of investors have consistently been on the wrong side, the Sentiment indicator suddenly shows that the majority has flipped and opened positions in the direction of that long-running trend. This is often a signal of fuel exhaustion for further movement in that direction
Interpretation Examples
- High greed readings (majority bullish) → Consider bearish opportunities
- High fear readings (majority bearish) → Consider bullish opportunities
- Sudden sentiment flip during established trends → Potential trend reversal signal
Technical Notes
- Built with PineScript v6
- Dynamic symbol detection with fallback options
- Optimized for performance with minimal resource usage
- Color-coded visualization with customizable zones
Data Sources & Expansion
Acknowledgments
We extend our gratitude to **TradingView** for enabling the use of custom data feeds based on GitHub repositories, making this comprehensive sentiment analysis possible.
Data Expansion Opportunities
As the operator of this indicator, I am **open to suggestions for new data sources** that could be integrated and published. If you have ideas for additional instruments or sentiment data:
How to Submit Suggestions:
1. Send a **private message** with your proposal
2. Include: **instrument/data type**, **source**, and **brief description**
3. If technically feasible, we will work to import and publish the data
Data Infrastructure Status
Current Data Upload Process:
Please note that sentiment data uploads may occasionally experience minor interruptions. However, this should not pose significant issues as sentiment data typically changes gradually rather than rapidly.
Infrastructure Development:
We are actively working on establishing permanent cloud-based infrastructure to ensure continuous, automated data collection and upload processes. This will provide more reliable and consistent data availability in the future.
Disclaimer
This indicator is for educational and informational purposes only. Sentiment data should be used as part of a comprehensive trading strategy and not as the sole basis for trading decisions. Past performance does not guarantee future results. The contrarian approach described is a market theory and may not always produce profitable results.

Smart Market Matrix Smart Market Matrix
This indicator is designed for intraday, scalping, providing automated detection of price pivots, liquidity traps, and breakout confirmations, along with a context dashboard featuring volatility, trend, and volume.
## Summary Description
### Menu Settings & Their Roles
- **Swing Pivot Strength**: Controls the sensitivity for detecting High/Low pivots.
- **Show Pivot Points**: Toggles the display of HH/LL markers on the chart.
- **VWMA Length for Trap Volume** & **Volume Spike Multiplier**: Identify concentrated volume spikes for liquidity traps.
- **Wick Ratio Threshold** & **Max Body Size Ratio**: Detect candles with disproportionate wicks and small bodies (doji-ish) for traps.
- **ATR Length for Trap**: Measures volatility specific to trap detection.
- **VWMA Length for Breakout Volume**, **ATR Multiplier for Breakout**, **ATR Length for Breakout**, **Min Body/Range Ratio**: Set adaptive breakout thresholds based on volatility and volume.
- **OBV Smooth Length**: Smooths OBV momentum for breakout confirmation.
- **Enable VWAP Filter for Confirmations**: Optionally validate breakouts against the VWAP.
- **Enable Higher-TF Trend Filter** & **Trend Filter Timeframe**: Align breakout signals with the 1h/4h/Daily trend.
- **ADX Length**, **EMA Fast/Slow Length for Context**: Parameters for the context dashboard (Volatility, Trend, Volume).
- **Show Intraday VWAP Line**, **VWAP Line Color/Width**: Display the intraday VWAP line with custom style.
### Signal Interpretation Map
| Signal | Description | Recommended Action |
|--------------------------------|-----------------------------------------------------------|-------------------------------------------|
| 📌 **HH / LL (pivot)** | Market structure (support/resistance) | Note key levels |
| **Bull Trap(green diamond)** | Sweep down + volume spike + wick + rejection | Go long with trend filter
| **Bear Trap(red diamond)** | Sweep up + volume spike + wick + rejection | Go short with trend filter
| 🔵⬆️ **Breakout Confirmed Up** | Close > ATR‑scaled high + volume + OBV↑ | Go long with trend filter |
| 🔵⬇️ **Breakout Confirmed Down** | Close < ATR‑scaled low + volume + OBV↓ | Go short with trend filter |
| 📊 **VWAP Line** | Intraday reference to guide price | Use as dynamic support/resistance |
| ⚡ **Volatility** | ATR ratio High/Med/Low | Adjust position size |
| 📈 **Trend Context** | ADX+EMA Strong/Moderate/Weak | Confirm trend direction |
| 🔍 **Volume Context** | Breakout / Rising / Falling / Calm | Check volume momentum |
*This summary gives you a quick overview of the key settings and how to interpret signals for efficient intraday scalping.*
### Suggested Settings
- **Intraday Scalping (5m–15m)**
- `Swing Pivot Strength = 5`
- `VWMA Length for Trap Volume = 10`, `Volume Spike Multiplier = 1.6`
- `ATR Length for Trap = 7`
- `VWMA Length for Breakout Volume = 12`, `ATR Length for Breakout = 9`, `ATR Multiplier for Breakout = 0.5`
- `Min Body/Range Ratio for Breakout = 0.5`, `OBV Smooth Length = 7`
- `Enable Higher-TF Trend Filter = true` (TF = 60)
- `Show Intraday VWAP Line = true` (Color = orange, Width = 2)
- **Swing Trading (4h–Daily)**
- `Swing Pivot Strength = 10`
- `VWMA Length for Trap Volume = 20`, `Volume Spike Multiplier = 2.0`
- `ATR Length for Trap = 14`
- `VWMA Length for Breakout Volume = 30`, `ATR Length for Breakout = 14`, `ATR Multiplier for Breakout = 0.8`
- `Min Body/Range Ratio for Breakout = 0.7`, `OBV Smooth Length = 14`
- `Enable Higher-TF Trend Filter = true` (TF = D)
- `Show Intraday VWAP Line = false`
*Adjust these values based on the symbol and market volatility for optimal performance.*

[AlbaTherium] OptiStruct™ Premium for Smart Money Concepts An Insight into Structure Mapping and Order Block Identification with Smart Money Concepts
Introduction:
Structure Mapping & Demands and Supplies Premium serves as a fundamental pillar in the realm of Smart Money Concepts . This indicator adeptly charts the market structure based on a refined version of SMC while identifying Order Blocks. All the concepts embedded in this method are meticulously defined, offering users the ability to chart the market structure with precision and heightened confidence. With this indicator, there is no need for excessive questioning of the accuracy of your markings; it diligently strives to perform this task effectively. There are no hidden 'magic' properties underlying this indicator, ensuring that our users can independently verify each and every feature. It is this commitment to transparency that sets us apart and makes us unique in the market.
In this discussion, we delve into the intricacies of Break of Structure, Change of Character , and SMART MONEY TRAP . We also introduce the concepts of Extreme Order Blocks, Decisional Order Blocks , and Smart Money Trap Order Blocks .
Chapter 1: Understanding Structure Mapping:
Let's begin with some definitions:
- Inside bars are candles that lie within the range of a preceding candle.
- Pullbacks occur in an uptrend when the low of a preceding candle's range (excluding inside bars ) is breached, and the price continues to rise.
- Inducements (IDM) are price levels defined as the low of the latest pullback before the most recent high. They often act as liquidity points that the market revisits before continuing its move.
Break of Structure (BoS):
In an uptrend, after surpassing an IDM , the most recent high becomes a Confirmed structure high, or a Major High . If the price then closes above this Major High, a Bullish Break of Structure (Bullish BoS) is confirmed. Similarly, the lowest point between these movements becomes a Confirmed structure low or Major Low in a downtrend.
Change of Character (ChoCh):
In an uptrend, if the price falls below a Major Low, it indicates a shift in market bias from Bullish to Bearish, or a Bearish Change of Character .
Example of a bullish ChoCh:
Chapter 2: The Significance of Order Blocks:
Order Blocks (OB) play a pivotal role in Smart Money Concepts during entry points. Understanding what they represent and how to identify them is essential. For a Bullish/Bearish Order Block to be confirmed, specific conditions, including price imbalance and breaching the previous candle's high or low, must be met. We will delve into the finer details of identifying and trading Order Blocks, with an emphasis on the fact that price often reacts from Decisional Order Blocks, Extreme Order Blocks , and Smart Money Trap Order Blocks .
An OB is the initial candle range of a pullback that creates a Fair value gap.
These are zones where proactive traders enter the market, resulting in significant price changes indicated by Fair value gaps. It is believed that when the price revisits these zones in the future, it tends to bounce back. This property makes Order Blocks excellent potential entry points.
Order Blocks are categorized as follows:
- Extreme OB : The first and lowest OB between the Major Low and Major High.
- Decisional OB : The most recent OB lower than the current IDM.
- Smart Money Traps : All OBs between Extreme and Decisional OB.
- Demand above IDM / Supply below IDM
Chapter 3: Understanding SMART MONEY TRAP (SMT):
SMART MONEY TRAP is a concept that brings clarity to the distinction between Structure and Order Blocks within Smart Money Concepts and is a unique feature of this indicator. While many Smart Money Traders base their trades on Structure and Order Blocks, it's crucial to recognize that Order Blocks serve as an additional confirmation for buy or sell decisions. Blindly trading based on Order Blocks is not advisable. Instead, traders should exercise patience and await other confirmations like inducement or Liquidity sweep before executing trades on Order Blocks. We will illustrate how this concept works in practice.
In the example above, the market made a high wick up, taking out the buy-side liquidity, then made a bearish ChoCh. We place our sell order on the order block above IDM. This presents a promising trading opportunity, with a stop loss placed above the OB and a take profit set at the low of previous structure.
Conclusion:
Structure Mapping & Demands and Supplies Premium as the epitome of Smart Money Concepts, presenting traders with a tool meticulously crafted for an exceptional user experience . This indicator integrates structural mapping and Order Blocks, providing not only a wealth of knowledge but a platform tailor-made for personalization to suit your unique style and preferences. By mastering the nuances of Impulsive Moves and Corrections, and expertly identifying and trading Order Blocks while considering the SMART MONEY TRAP, traders gain a distinct advantage in the ever-evolving financial markets.
This document serves as an enriching guide to Structure Mapping & Demands and Supplies Premium, accentuating its pivotal role within the Smart Money Concepts framework. We invite users to immerse themselves in an experience that transcends the ordinary, delving into the intricacies that define successful trading. As you navigate the complexities of the market, these detailed insights become your compass, providing a rich and customizable user experience that unlocks the full potential of Smart Money Concepts. Embrace these tools judiciously, and empower your daily analysis with a wealth of information that truly holds its weight in gold.

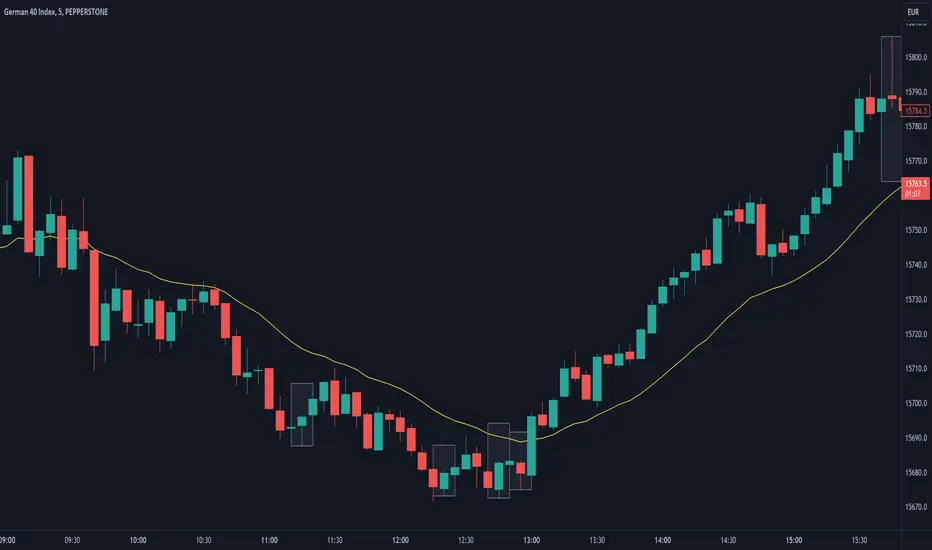
Are stop orders making money? [yohtza]Who is this indicator for and what does it do?
This is an indicator that helps price action traders in determining the strength of the trend and potential counter trend traps that present themselves during the move. It highlights the background of the bar at which counter trend traders that trade with stop orders (breakout entries) were able to achieve the same amount of reward as was their risk for that trade.
What is it based on?
When there is a strong trend in effect, the counter trend traders are unable to buy above(in bear trend) or sell below (in bull trend) a bar with a stop order and get an equal reward for the risk they are taking.
The first time counter trend traders are able to buy and make money in bear or sell and make money in bull it is a warning sign that market is likely transitioning into trading range phase of the market cycle.
Another application of the indicator is for discovering potential traps. If market comes very close to the take profit level of counter trend traders and reverses, they will usually try to get out with as much profit or as small of a loss as possible and that will often create a fast move (also called giving up) and a good with trend entry.
How does it work?
The indicator is using exponential moving average as a filter for when the market is trending and then scans for signals where counter trend traders enter. Next it looks if the stoploss or profit target was hit for that trade. If the profit target was hit it draws a box around the bar on which the traders entered, the box height is based on stoploss and profit target price levels.
Indicator inputs
- Scan for doji signal bars
When this option is selected, bars that have small bodies (less than 50% of their height) are also included as bars on which counter traders enter. If the option is not selected it only looks for bull trend bars (bodies are greater than 50% of their height) below the moving average and bear trend bars above the moving average.
- Border and background colors and border style
It is possible to select different colors and chose between solid, dashed and dotted borders
- Ema period
Default setting is 20 bar exponential moving average but feel free to use which you prefer
- Tick value
This is the value of the minimal movement of the chart you are trading on. For example for S&P 500 E-mini futures the value is 0.25 and that is the default setting.