Natural Visibility Graph [UAlgo]Natural Visibility Graph (NVG) is a structure detection indicator that treats price as a time series network. Each bar is interpreted as a node, and nodes are connected if they can “see” each other without intermediate bars blocking the line of sight. This is based on the Natural Visibility Graph concept introduced in complex network theory, where geometric visibility rules convert a time series into a graph.
In practical trading terms, NVG measures how structurally important a bar is by counting how many past bars remain visible from it. Bars with high visibility act like pivots that dominate their local environment because they are not easily obstructed by surrounding price action. The script computes this visibility for highs and lows separately, then flags exceptional nodes as hubs using a dynamic, volatility aware thresholding process.
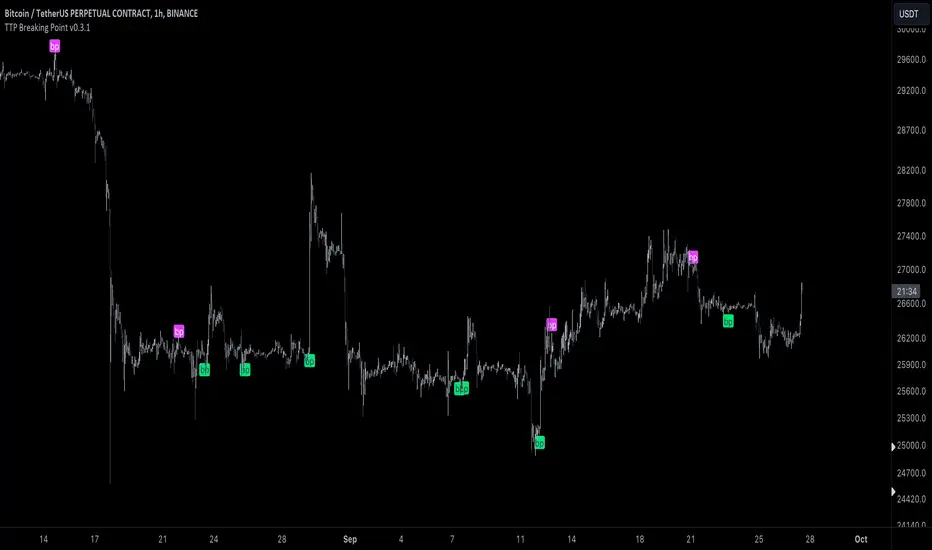
The output is a chart overlay that highlights structural peaks and valleys with neon hub markers, draws a horizon style connection to the furthest visible bar, and optionally provides alerts when new hubs appear. It also colors bars according to hub status so structural events stand out instantly.
🔹 Features
1) Natural Visibility Graph Degree for Highs and Lows
The indicator calculates an in degree style connectivity score for each bar. Degree represents how many past bars are visible from the current bar under the NVG rule. Highs and lows are handled independently:
High graph measures visibility between swing peaks
Low graph measures visibility between swing valleys using an inverted obstruction rule
This separation helps detect both resistance like peaks and support like valleys without blending them into a single metric.
2) Lookback Controlled Structural Sensitivity
Visibility is computed only within a user selected lookback window. Larger values build stronger structural context and produce more selective hubs, but increase computation. Smaller values react faster but focus on local structure.
Visibility Lookback directly controls how far the algorithm searches for visible connections.
3) Dynamic Hub Detection with Adaptive Max Degree
Instead of using a fixed degree threshold, the script maintains a rolling maximum degree for highs and lows and applies a percentile style threshold. A slow decay mechanism reduces the max gradually over time so the reference level adapts when market structure changes.
This keeps hub detection stable across different regimes and helps avoid permanently locking into an old maximum degree that may no longer be reachable.
4) Hub Threshold Percentile Control
Hub Threshold defines how strict hub detection is. It is applied as a fraction of the current rolling maximum degree:
High hub when degreeH is greater than or equal to maxDegH times threshold
Low hub when degreeL is greater than or equal to maxDegL times threshold
Higher threshold values mark only the most dominant nodes. Lower values mark more frequent hubs.
5) Neon Web Visual Design
The script uses a neon palette to make structural events highly visible:
High hubs are marked with a cyan diamond above price
Low hubs are marked with a pink diamond below price
A dotted horizon beam connects the hub to its furthest visible past node, helping you interpret how far the hub’s influence extends in the visibility sense.
6) Bar Coloring for Instant Structural Context
Bars are colored by hub status:
Cyan for high hubs
Pink for low hubs
Muted gray for non hub bars
This provides a fast scan view of where the market is producing dominant structural events.
7) Alerts for Structural Peaks and Valleys
Alert conditions are provided for both hub types:
High Visibility Structural Peak Detected
High Visibility Structural Valley Detected
These can be used for structural monitoring, swing validation, or confluence with other tools.
🔹 Calculations
1) Natural Visibility Rule for Highs
For each past bar i within the lookback, the script checks if the straight line from the current high to the past high is unobstructed by intermediate highs. If no intermediate high reaches or exceeds the projected height on that line, the past bar is visible and the degree increases.
Core idea:
Current bar at index 0
Past bar at index i
Intermediate bars at index k where 1 is the nearest past bar and i minus 1 is just before the past bar
Slope and projection:
float slope = (high - high ) / float(i)
for k = 1 to i - 1
float y_projected = high - (slope * k)
if high >= y_projected
isVisible := false
break
If isVisible remains true, degreeH increments and furthestVisIdxH is updated to i, so the script remembers the furthest visible connection for drawing.
2) Natural Visibility Rule for Lows
Lows use the inverted valley logic. A past low is visible from the current low if intermediate lows do not fall at or below the projected line, because deeper lows block visibility in a valley sense.
float slope = (low - low ) / float(i)
for k = 1 to i - 1
float y_projected = low - (slope * k)
if low <= y_projected
isVisible := false
break
If visible, degreeL increments and furthestVisIdxL records the furthest visible low node.
3) Rolling Maximum Degree with Slow Decay
The indicator maintains rolling maximum degree values for highs and lows. Periodically it applies a slow decay so that the maximum can adapt downwards over time if structural connectivity decreases:
var int maxDegH = 5
var int maxDegL = 5
if bar_index % int(lookback/2) == 0
maxDegH := int(math.max(5, maxDegH * 0.95))
maxDegL := int(math.max(5, maxDegL * 0.95))
maxDegH := math.max(maxDegH, degreeH)
maxDegL := math.max(maxDegL, degreeL)
Interpretation:
The max degree never falls below 5
Decay runs every lookback divided by two bars
New degrees update the max immediately if a stronger hub appears
4) Hub Classification
A bar becomes a hub if its degree reaches a fraction of the current max degree:
bool isHubH = degreeH >= maxDegH * threshold
bool isHubL = degreeL >= maxDegL * threshold
threshold behaves like a percentile control over the observed maximum connectivity.
5) Hub Markers and Horizon Beam
When a hub is detected, the script plots a diamond label and draws a dotted line to the furthest visible bar for that hub type:
High hub:
label.new(bar_index, high, "◈", textcolor=colNeonCyan, style=label.style_label_down)
line.new(bar_index, high, bar_index - furthestVisIdxH, high , style=line.style_dotted)
Low hub:
label.new(bar_index, low, "◈", textcolor=colNeonPink, style=label.style_label_up)
line.new(bar_index, low, bar_index - furthestVisIdxL, low , style=line.style_dotted)
Interpretation:
The beam represents the furthest confirmed visibility connection and gives a visual sense of the hub’s visibility range.
6) Alert Conditions
The script exposes alert conditions tied to the hub booleans:
alertcondition(isHubH, "NVG High Hub", "High Visibility Structural Peak Detected")
alertcondition(isHubL, "NVG Low Hub", "High Visibility Structural Valley Detected")
Wskaźnik Pine Script®