Ichimoku Bounce on Tenkan-Sen by YellowKumaIchimoku Bounce (Long/Short) on Tenkan-Sen by YellowKuma
Pure bounce signals off the Tenkan-sen • No MTF • No noise
🌊 What It Does
This indicator spots high-probability reversal zones where price reacts off the Tenkan-sen (9-period conversion line) — the fastest Ichimoku component acting as dynamic support/resistance.
✅ Long signal → Price bounces up from Tenkan-sen while trading above the cloud
✅ Short signal → Price rejects down from Tenkan-sen while trading below the cloud
✅ Kijun-sen is used only as a trend filter (Tenkan > Kijun for longs / Tenkan < Kijun for shorts) — never as a bounce level
✅ Zero MTF complexity — runs purely on your chart's native timeframe, no repainting
Signals appear as:
🟢 "L" label below the bar → Bullish Tenkan bounce
🔴 "S" label above the bar → Bearish Tenkan bounce
⏱️ Timeframe Matters — A Lot
This strategy shines on higher timeframes and struggles on low ones. Why?
📈 H4 / Daily / Weekly
→ Tenkan-sen aligns with real institutional pivot zones
→ Cloud represents weeks of consensus value — strong trend filter
→ Bounces carry momentum → larger winners, fewer whipsaws
📉 M5 / M15 / M30
→ Tenkan-sen reacts to micro-noise, not structure
→ Cloud too thin — price slices through easily
→ False bounces dominate → shallow moves, poor R:R
💡 Rule of thumb:
• Use H4 for swing entries
• Use Daily for core trend trades
• Keep a Weekly chart open to confirm macro trend (only trade bounces with the Weekly cloud)
• Avoid M15/M30 entirely — signal quality degrades sharply
⚙️ Settings (Simple & Clean)
• Tenkan-sen Period → 9 (standard) — shorter = more sensitive, longer = smoother
• Kijun-sen Period → 26 (standard) — trend filter only
• Senkou Span B Period → 52 (standard) — defines cloud thickness
• Show Long Bounces → Toggle ON/OFF
• Show Short Bounces → Toggle ON/OFF
Cloud colors:
🟢 Green fill → Bullish cloud (Senkou Span A > B)
🔴 Red fill → Bearish cloud (Senkou Span A < B)
🎯 How to Trade the Signals
1️⃣ Wait for confirmation
→ Never enter mid-bar. Wait for candle close beyond the Tenkan-sen.
2️⃣ Check cloud alignment
→ Longs only when price > cloud top
→ Shorts only when price < cloud bottom
3️⃣ Add price action confirmation (optional but recommended)
→ Bullish engulfing / hammer at Tenkan → stronger long signal
→ Bearish engulfing / shooting star at Tenkan → stronger short signal
4️⃣ Risk management
→ Stop-loss: 1–2 pips beyond bounce bar extreme OR 2×ATR(14)
→ Take-profit: Target Kijun-sen (near-term) or opposite cloud boundary (swing)
→ Minimum reward:risk = 1:3
5️⃣ Avoid these situations
→ Choppy markets (Tenkan/Kijun flat, cloud thin)
→ Major news events (FOMC, NFP) — volatility distorts Tenkan touches
→ Bounces within 15 pips of strong horizontal resistance/support against your direction
🔔 Alerts
Built-in alert conditions:
• "Long Bounce" → triggers when green "L" appears
• "Short Bounce" → triggers when red "S" appears
→ Right-click indicator → Add Alert → choose condition
💡 Pro Tips for TradingView Users
✨ Session timing: Avoid first 60 mins of London/NY open — volatility creates false Tenkan touches
✨ Combine with Weekly trend: Disable short signals when price > Weekly cloud (and vice versa)
✨ Less is more: Expect 2–5 high-quality signals per week on H4 — that's normal. Quality > quantity.
⚠️ Important
This is a price-structure tool, not a magic bullet.
Always:
• Respect the trend (trade bounces with the cloud, not against it)
• Use proper position sizing (0.5–1% risk per trade)
• Keep a trading journal — track which bounces worked and why
✨ Bottom Line
Pure. Simple. Effective.
By focusing only on Tenkan-sen bounces — and enforcing strict cloud alignment — this indicator cuts through noise and delivers clean reversal zones where institutions actually place orders.
Works best on H4 and higher.
Add it. Switch to H4. Trade the bounce. 🚀 @YellowKumo
Tenkan-sen

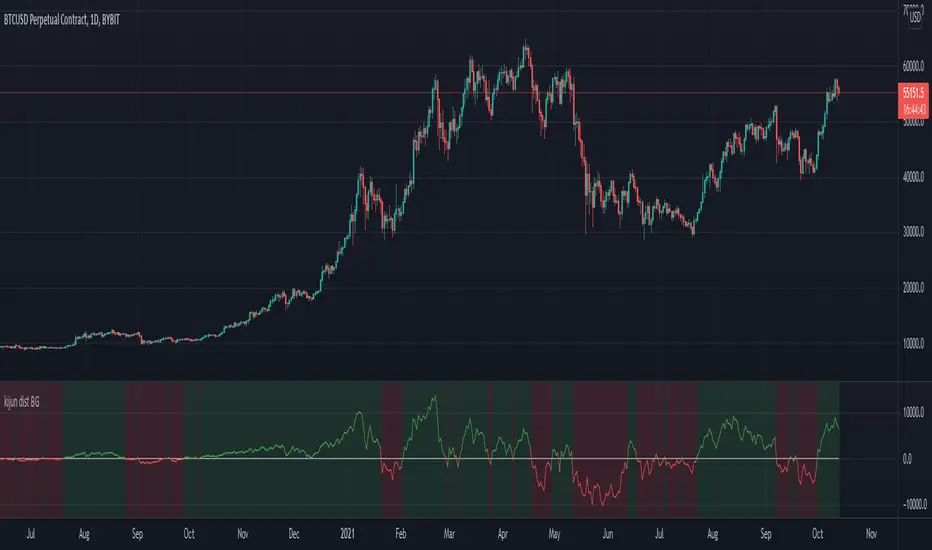
Kijun-Price DistanceThis script shows optional:
- distance between close price and Kijun-Sen
- distance btween Tenkan-Sen and Kijun-Sen
- Background color of current time frame
- Background color of the next higher time frame
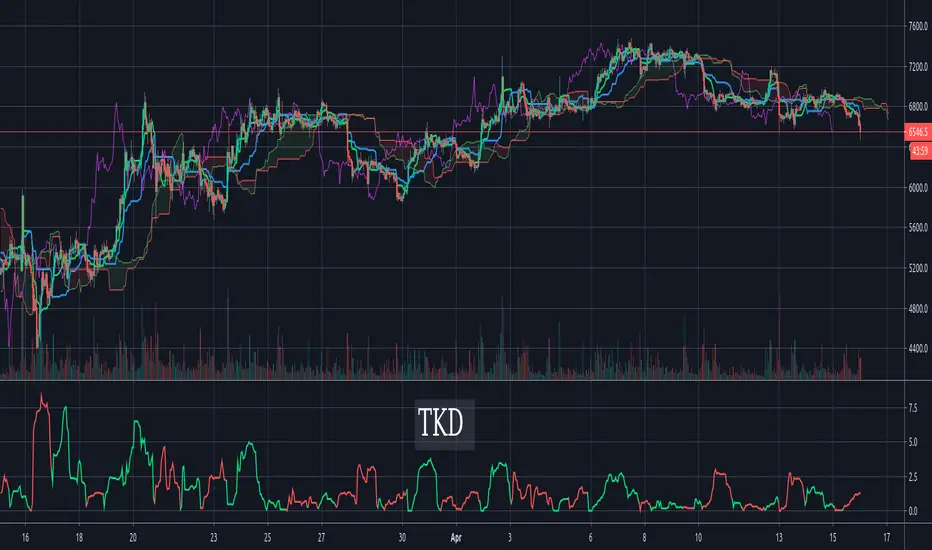
Tenkan-Sen Kijun-Sen Distance (TKD) Oscillator - IchimokuThe TKD is the distance between the Tenkan-Sen and the Kijun-Sen, expressed in percentage of current price. The further apart the tenken-sen and kijun-sen are, the more they want to snap back together. This makes for a decent oscillator. When the Tenkan-Sen is above the Kijun-Sen, the TKD is green. When it is below, the TKD is red. At the crossing points, it turns blue.
For those more familiar with Ichimoku Cloud techniques, one might also think of this indicator as a C-Clamp indicator. Bar coloring is supported and enabled by default. There's also an option to flip/invert the green/red colors in case you want to use it to judge pending cycles rather than current ones.