LibraryDivergenceV6LibraryDivergenceV6
Enhance your trading strategies with LibraryDivergenceV6, a comprehensive Pine Script library designed to simplify and optimize the detection of bullish and bearish divergences across multiple technical indicators. Whether you're developing your own indicators or seeking to incorporate robust divergence analysis into your trading systems, this library provides the essential tools and functions to accurately identify potential market reversals and continuations.
Overview
LibraryDivergenceV6 offers a suite of functions that detect divergences between price movements and key technical indicators such as the Relative Strength Index (RSI) and On-Balance Volume (OBV). By automating the complex calculations involved in divergence detection, this library enables traders and developers to implement reliable and customizable divergence strategies with ease.
Key Features
Comprehensive Divergence Detection
Bullish Divergence: Identifies instances where the indicator forms higher lows while the price forms lower lows, signaling potential upward reversals.
Bearish Divergence: Detects situations where the indicator creates lower highs while the price forms higher highs, indicating possible downward reversals.
Overbought and Oversold Conditions: Differentiates between standard and strong divergences by considering overbought and oversold levels, enhancing signal reliability.
Multi-Indicator Support
RSI (Relative Strength Index): Analyze momentum-based divergences to spot potential trend reversals.
OBV (On-Balance Volume): Incorporate volume flow into divergence analysis for a more comprehensive market perspective.
Customizable Parameters
Pivot Points Configuration: Adjust the number of bars to the left and right for pivot detection, allowing fine-tuning based on different timeframes and trading styles.
Range Settings: Define minimum and maximum bar ranges to control the sensitivity of divergence detection, reducing false signals.
Noise Cancellation: Enable or disable noise filtering to focus on significant divergences and minimize minor fluctuations.
Flexible Usage
Exported Functions: Easily integrate divergence detection into your custom indicators or trading strategies with exported functions such as DivergenceBull, DivergenceBear, DivergenceBullOversold, and DivergenceBearOverbought.
Occurrence Handling: Specify which occurrence of a divergence to consider (e.g., most recent, previous) for precise analysis.
Optimized Performance
Efficient Calculations: Designed to handle multiple occurrences and pivot points without compromising script performance.
Line Management: Automatically creates and deletes trend lines based on divergence conditions, ensuring a clean and uncluttered chart display.
Techindicator

PseudoPlotLibrary "PseudoPlot"
PseudoPlot: behave like plot and fill using polyline
This library enables line plotting by polyline like plot() and fill().
The core of polyline() is array of chart.point array, polyline() is called in its method.
Moreover, plotarea() makes a box in main chart, plotting data within the box is enabled.
It works so slowy to manage array of chart.point, so limit the target to visible area of the chart.
Due to polyline specifications, na and expression can not be used for colors.
1. pseudoplot
pseudoplot() behaves like plot().
//use plot()
plot(close)
//use pseudoplot()
pseudoplot(close)
Pseudoplot has label. Label is enabled when title argument is set.
In the example bellow, "close value" label is shown with line.
The label is shown at right of the line when recent bar is visible.
It is shown at 15% from the left of visible area when recent bar is not visible.
Just set "" if you don't need label.
//use plot()
plot(close,"close value")
//use pseudoplot
pseudoplot(close, "close value")
Arguments are designed in an order as similar as possible to plot.
plot(series, title, color, linewidth, style, trackprice, histbase, offset, join, editable, show_last, display, format, precision, force_overlay) → plot
pseudoplot(series, title, ,linecolor ,linewidth, linestyle, labelbg, labeltext, labelsize, shorttitle, format, xpos_from_left, overlay) → pseudo_plot
2. pseudofill
pseudofill() behaves like fill().
The label is shown(text only) at right of the line when recent bar is visible.
It is shown at 10% from the left of visible area when recent bar is not visible.
Just set "" if you don't need label.
//use plot() and fill()
p1=plot(open)
p2=plot(close)
fill(p1,p2)
//use pseudofill()
pseudofill(open,close)
Arguments are designed in an order as similar as possible to fill.
fill(hline1, hline2, color, title, editable, fillgaps, display) → void
pseudofill(series1, series2, fillcolor, title, linecolor, linewidth, linestyle, labeltext, labelsize, shorttitle, format, xpos_from_left, overlay) → pseudo_plot
3. plotarea and its methods
plotarea() makes a box in main chart. You can set the box position to top or bottom, and
the box height in percentage of the range of visible high and low prices.
x-coordinate of the box is from chart.left_visible_bar_time to chart.right_visible_bar_time,
y-coordinate is highest and lowest price of visible bars.
pseudoplot() and pseudofill() work as method of plotarea(box).
Usage is almost same as the function version, just set min and max value, y-coodinate is remapped automatically.
hline() is also available. The y-coordinate of hline is specified as a percentage from the bottom.
plotarea() and its associated methods are overlay=true as default.
Depending on the drawing order of the objects, plot may become invisible, so the bgcolor of plotarea should be na or tranceparent.
//1. make a plotarea
// bgcolor should be na or transparent color.
area=plotarea("bottom",30,"plotarea",bgcolor=na)
//2. plot in a plotarea
//(min=0, max=100 is omitted as it is the default.)
area.pseudoplot(ta.rsi(close,14))
//3. draw hlines
area.hline(30,linestyle="dotted",linewidth=2)
area.hline(70,linestyle="dotted",linewidth=2)
4. Data structure and sub methods
Array management is most imporant part of using polyline.
I don't know the proper way to handle array, so it is managed by array and array as intermediate data.
(type xy_arrays to manage bar_time and price as independent arrays.)
method cparray() pack arrays to array, when array includes both chart.left_visible_bar_time and chart.right_visible_bar.time.
Calling polyline is implemented as methods of array of chart.point.
Method creates polyline object if array is not empty.
method polyline(linecolor, linewidth, linestyle, overlay) → series polyline
method polyline_fill(fillcolor, linecolor, linewidth, linestyle, overlay) → series polyline
Also calling label is implemented as methods of array of chart.point.
Method creates label ofject if array is not empty.
Label is located at right edge of the chart when recent bar is visible, located at left side when recent bar is invisible.
label(title, labelbg, labeltext, labelsize, format, shorttitle, xpos_from_left, overlay) → series label
label_for_fill(title, labeltext, labelsize, format, shorttitle, xpos_from_left, overlay) → series label
visible_xyInit(series)
make arrays of visible x(bar_time) and y(price/value).
Parameters:
series (float) : (float) series variable
Returns: (xy_arrays)
method remap(this, bottom, top, min, max)
Namespace types: xy_arrays
Parameters:
this (xy_arrays)
bottom (float) : (float) bottom price to ajust.
top (float) : (float) top price to ajust.
min (float) : (float) min of src value.
max (float) : (float) max of src value.
Returns: (xy_arrays)
method polyline(this, linecolor, linewidth, linestyle, overlay)
Namespace types: array
Parameters:
this (array)
linecolor (color) : (color) color of polyline.
linewidth (int) : (int) width of polyline.
linestyle (string) : (string) linestyle of polyline. default is line.style_solid("solid"), others line.style_dashed("dashed"), line.style_dotted("dotted").
overlay (bool) : (bool) force_overlay of polyline. default is false.
Returns: (polyline)
method polyline_fill(this, fillcolor, linecolor, linewidth, linestyle, overlay)
Namespace types: array
Parameters:
this (array)
fillcolor (color)
linecolor (color) : (color) color of polyline.
linewidth (int) : (int) width of polyline.
linestyle (string) : (string) linestyle of polyline. default is line.style_solid("solid"), others line.style_dashed("dashed"), line.style_dotted("dotted").
overlay (bool) : (bool) force_overlay of polyline. default is false.
Returns: (polyline)
method label(this, title, labelbg, labeltext, labelsize, format, shorttitle, xpos_from_left, overlay)
Namespace types: array
Parameters:
this (array)
title (string) : (string) label text.
labelbg (color) : (color) color of label bg.
labeltext (color) : (color) color of label text.
labelsize (int) : (int) size of label.
format (string) : (string) textformat of label. default is text.format_none("none"). others text.format_bold("bold"), text.format_italic("italic"), text.format_bold+text.format_italic("bold+italic").
shorttitle (string) : (string) another label text for recent bar is not visible.
xpos_from_left (int) : (int) another label x-position(percentage from left of chart width), when recent bar is not visible. default is 15%.
overlay (bool) : (bool) force_overlay of label. default is false.
Returns: (label)
method label_for_fill(this, title, labeltext, labelsize, format, shorttitle, xpos_from_left, overlay)
Namespace types: array
Parameters:
this (array)
title (string) : (string) label text.
labeltext (color) : (color) color of label text.
labelsize (int) : (int) size of label.
format (string) : (string) textformat of label. default is text.format_none("none"). others text.format_bold("bold"), text.format_italic("italic"), text.format_bold+text.format_italic("bold+italic").
shorttitle (string) : (string) another label text for recent bar is not visible.
xpos_from_left (int) : (int) another label x-position(percentage from left of chart width), when recent bar is not visible. default is 10%.
overlay (bool) : (bool) force_overlay of label. default is false.
Returns: (label)
pseudoplot(series, title, linecolor, linewidth, linestyle, labelbg, labeltext, labelsize, shorttitle, format, xpos_from_left, overlay)
polyline like plot with label
Parameters:
series (float) : (float) series variable to plot.
title (string) : (string) title if need label. default value is ""(disable label).
linecolor (color) : (color) color of line.
linewidth (int) : (int) width of line.
linestyle (string) : (string) style of plotting line. default is "solid", others "dashed", "dotted".
labelbg (color) : (color) color of label bg.
labeltext (color) : (color) color of label text.
labelsize (int) : (int) size of label text.
shorttitle (string) : (string) another label text for recent bar is not visible.
format (string) : (string) textformat of label. default is text.format_none("none"). others text.format_bold("bold"), text.format_italic("italic"), text.format_bold+text.format_italic("bold+italic").
xpos_from_left (int) : (int) another label x-position(percentage from left of chart width), when recent bar is not visible. default is 15%.
overlay (bool) : (bool) force_overlay of polyline and label.
Returns: (pseudo_plot)
method pseudoplot(this, series, title, linecolor, linewidth, linestyle, labelbg, labeltext, labelsize, shorttitle, format, xpos_from_left, min, max, overlay)
Namespace types: series box
Parameters:
this (box)
series (float) : (float) series variable to plot.
title (string) : (string) title if need label. default value is ""(disable label).
linecolor (color) : (color) color of line.
linewidth (int) : (int) width of line.
linestyle (string) : (string) style of plotting line. default is "solid", others "dashed", "dotted".
labelbg (color) : (color) color of label bg.
labeltext (color) : (color) color of label text.
labelsize (int) : (int) size of label text.
shorttitle (string) : (string) another label text for recent bar is not visible.
format (string) : (string) textformat of label. default is text.format_none("none"). others text.format_bold("bold"), text.format_italic("italic"), text.format_bold+text.format_italic("bold+italic").
xpos_from_left (int) : (int) another label x-position(percentage from left of chart width), when recent bar is not visible. default is 15%.
min (float)
max (float)
overlay (bool) : (bool) force_overlay of polyline and label.
Returns: (pseudo_plot)
pseudofill(series1, series2, fillcolor, title, linecolor, linewidth, linestyle, labeltext, labelsize, shorttitle, format, xpos_from_left, overlay)
fill by polyline
Parameters:
series1 (float) : (float) series variable to plot.
series2 (float) : (float) series variable to plot.
fillcolor (color) : (color) color of fill.
title (string)
linecolor (color) : (color) color of line.
linewidth (int) : (int) width of line.
linestyle (string) : (string) style of plotting line. default is "solid", others "dashed", "dotted".
labeltext (color)
labelsize (int)
shorttitle (string)
format (string) : (string) textformat of label. default is text.format_none("none"). others text.format_bold("bold"), text.format_italic("italic"), text.format_bold+text.format_italic("bold+italic").
xpos_from_left (int) : (int) another label x-position(percentage from left of chart width), when recent bar is not visible. default is 15%.
overlay (bool) : (bool) force_overlay of polyline and label.
Returns: (pseudoplot)
method pseudofill(this, series1, series2, fillcolor, title, linecolor, linewidth, linestyle, labeltext, labelsize, shorttitle, format, xpos_from_left, min, max, overlay)
Namespace types: series box
Parameters:
this (box)
series1 (float) : (float) series variable to plot.
series2 (float) : (float) series variable to plot.
fillcolor (color) : (color) color of fill.
title (string)
linecolor (color) : (color) color of line.
linewidth (int) : (int) width of line.
linestyle (string) : (string) style of plotting line. default is "solid", others "dashed", "dotted".
labeltext (color)
labelsize (int)
shorttitle (string)
format (string) : (string) textformat of label. default is text.format_none("none"). others text.format_bold("bold"), text.format_italic("italic"), text.format_bold+text.format_italic("bold+italic").
xpos_from_left (int) : (int) another label x-position(percentage from left of chart width), when recent bar is not visible. default is 15%.
min (float)
max (float)
overlay (bool) : (bool) force_overlay of polyline and label.
Returns: (pseudo_plot)
plotarea(pos, height, title, bordercolor, borderwidth, bgcolor, textsize, textcolor, format, overlay)
subplot area in main chart
Parameters:
pos (string) : (string) position of subplot area, bottom or top.
height (int) : (float) percentage of visible chart heght.
title (string) : (string) text of area box.
bordercolor (color) : (color) color of border.
borderwidth (int) : (int) width of border.
bgcolor (color) : (string) color of area bg.
textsize (int)
textcolor (color)
format (string)
overlay (bool) : (bool) force_overlay of polyline and label.
Returns: (box)
method hline(this, ypos_from_bottom, linecolor, linestyle, linewidth, overlay)
Namespace types: series box
Parameters:
this (box)
ypos_from_bottom (float) : (float) percentage of box height from the bottom of box.(bottom is 0%, top is 100%).
linecolor (color) : (color) color of line.
linestyle (string) : (string) style of line.
linewidth (int) : (int) width of line.
overlay (bool) : (bool) force_overlay of polyline and label.
Returns: (line)
pseudo_plot
polyline and label.
Fields:
p (series polyline)
l (series label)
xy_arrays
x(bartime) and y(price or value) arrays.
Fields:
t (array)
p (array)

DynamicPeriodPublicDynamic Period Calculation Library
This library provides tools for adaptive period determination, useful for creating indicators or strategies that automatically adjust to market conditions.
Overview
The Dynamic Period Library calculates adaptive periods based on pivot points, enabling the creation of responsive indicators and strategies that adjust to market volatility.
Key Features
Dynamic Periods: Computes periods using distances between pivot highs and lows.
Customizable Parameters: Users can adjust detection settings and period constraints.
Robust Handling: Includes fallback mechanisms for cases with insufficient pivot data.
Use Cases
Adaptive Indicators: Build tools that respond to market volatility by adjusting their periods dynamically.
Dynamic Strategies: Enhance trading strategies by integrating pivot-based period adjustments.
Function: `dynamic_period`
Description
Calculates a dynamic period based on the average distances between pivot highs and lows.
Parameters
`left` (default: 5): Number of left-hand bars for pivot detection.
`right` (default: 5): Number of right-hand bars for pivot detection.
`numPivots` (default: 5): Minimum pivots required for calculation.
`minPeriod` (default: 2): Minimum allowed period.
`maxPeriod` (default: 50): Maximum allowed period.
`defaultPeriod` (default: 14): Fallback period if no pivots are found.
Returns
A dynamic period calculated based on pivot distances, constrained by `minPeriod` and `maxPeriod`.
Example
//@version=6
import CrimsonVault/DynamicPeriodPublic/1
left = input.int(5, "Left bars", minval = 1)
right = input.int(5, "Right bars", minval = 1)
numPivots = input.int(5, "Number of Pivots", minval = 2)
period = DynamicPeriodPublic.dynamic_period(left, right, numPivots)
plot(period, title = "Dynamic Period", color = color.blue)
Implementation Notes
Pivot Detection: Requires sufficient historical data to identify pivots accurately.
Edge Cases: Ensures a default period is applied when pivots are insufficient.
Constraints: Limits period values to a user-defined range for stability.

IndicatorsLibrary "Indicators"
cmf(lookback, n_to_smooth)
Calculates the Chaikin's Money Flow.
Parameters:
lookback (simple int)
n_to_smooth (simple int)
Returns: float The Money Flow value.
cmma(lookback, atr_length)
Calculates the CMMA (Close Minus Moving Average) indicator.
Parameters:
lookback (simple int)
atr_length (simple int)
Returns: float The CMMA value.
macd(fast_length, slow_length, n_to_smooth)
Calculates the normalized and scaled MACD.
Parameters:
fast_length (simple int)
slow_length (simple int)
n_to_smooth (simple int)
Returns: A tuple containing .
stochK(length, n_to_smooth)
Calculates a simplified Stochastic Oscillator.
Uses: 100 * ta.sma((close - lowest_low) / (highest_high - lowest_low), n_to_smooth)
Parameters:
length (simple int)
n_to_smooth (simple int)
Returns: float The Stochastic %K value.
williamsR(length)
Calculates the Williams %R using the stochK function.
Uses: -1 * (100 - stoch(length, 1))
Parameters:
length (simple int)
Returns: float The Williams %R value.

supertrendLibrary "supertrend"
supertrend : Library dedicated to different variations of supertrend
supertrend_atr(length, multiplier, atrMaType, source, highSource, lowSource, waitForClose, delayed)
supertrend_atr: Simple supertrend based on atr but also takes into consideration of custom MA Type, sources
Parameters:
length (simple int) : : ATR Length
multiplier (simple float) : : ATR Multiplier
atrMaType (simple string) : : Moving Average type for ATR calculation. This can be sma, ema, hma, rma, wma, vwma, swma
source (float) : : Default is close. Can Chose custom source
highSource (float) : : Default is high. Can also use close price for both high and low source
lowSource (float) : : Default is low. Can also use close price for both high and low source
waitForClose (simple bool) : : Considers source for direction change crossover if checked. Else, uses highSource and lowSource.
delayed (simple bool) : : if set to true lags supertrend atr stop based on target levels.
Returns: dir : Supertrend direction
supertrend : BuyStop if direction is 1 else SellStop
supertrend_bands(bandType, maType, length, multiplier, source, highSource, lowSource, waitForClose, useTrueRange, useAlternateSource, alternateSource, sticky)
supertrend_bands: Simple supertrend based on atr but also takes into consideration of custom MA Type, sources
Parameters:
bandType (simple string) : : Type of band used - can be bb, kc or dc
maType (simple string) : : Moving Average type for Bands. This can be sma, ema, hma, rma, wma, vwma, swma
length (simple int) : : Band Length
multiplier (float) : : Std deviation or ATR multiplier for Bollinger Bands and Keltner Channel
source (float) : : Default is close. Can Chose custom source
highSource (float) : : Default is high. Can also use close price for both high and low source
lowSource (float) : : Default is low. Can also use close price for both high and low source
waitForClose (simple bool) : : Considers source for direction change crossover if checked. Else, uses highSource and lowSource.
useTrueRange (simple bool) : : Used for Keltner channel. If set to false, then high-low is used as range instead of true range
useAlternateSource (simple bool) : - Custom source is used for Donchian Chanbel only if useAlternateSource is set to true
alternateSource (float) : - Custom source for Donchian channel
sticky (simple bool) : : if set to true borders change only when price is beyond borders.
Returns: dir : Supertrend direction
supertrend : BuyStop if direction is 1 else SellStop
supertrend_zigzag(length, history, useAlternativeSource, alternativeSource, source, highSource, lowSource, waitForClose, atrlength, multiplier, atrMaType)
supertrend_zigzag: Zigzag pivot based supertrend
Parameters:
length (simple int) : : Zigzag Length
history (simple int) : : number of historical pivots to consider
useAlternativeSource (simple bool)
alternativeSource (float)
source (float) : : Default is close. Can Chose custom source
highSource (float) : : Default is high. Can also use close price for both high and low source
lowSource (float) : : Default is low. Can also use close price for both high and low source
waitForClose (simple bool) : : Considers source for direction change crossover if checked. Else, uses highSource and lowSource.
atrlength (simple int) : : ATR Length
multiplier (simple float) : : ATR Multiplier
atrMaType (simple string) : : Moving Average type for ATR calculation. This can be sma, ema, hma, rma, wma, vwma, swma
Returns: dir : Supertrend direction
supertrend : BuyStop if direction is 1 else SellStop
zupertrend(length, history, useAlternativeSource, alternativeSource, source, highSource, lowSource, waitForClose, atrlength, multiplier, atrMaType)
zupertrend: Zigzag pivot based supertrend
Parameters:
length (simple int) : : Zigzag Length
history (simple int) : : number of historical pivots to consider
useAlternativeSource (simple bool)
alternativeSource (float)
source (float) : : Default is close. Can Chose custom source
highSource (float) : : Default is high. Can also use close price for both high and low source
lowSource (float) : : Default is low. Can also use close price for both high and low source
waitForClose (simple bool) : : Considers source for direction change crossover if checked. Else, uses highSource and lowSource.
atrlength (simple int) : : ATR Length
multiplier (simple float) : : ATR Multiplier
atrMaType (simple string) : : Moving Average type for ATR calculation. This can be sma, ema, hma, rma, wma, vwma, swma
Returns: dir : Supertrend direction
supertrend : BuyStop if direction is 1 else SellStop
zsupertrend(zigzagpivots, history, source, highSource, lowSource, waitForClose, atrMaType, atrlength, multiplier)
zsupertrend: Same as zigzag supertrend. But, works on already calculated array rather than Calculating fresh zigzag
Parameters:
zigzagpivots (array) : : Precalculated zigzag pivots
history (simple int) : : number of historical pivots to consider
source (float) : : Default is close. Can Chose custom source
highSource (float) : : Default is high. Can also use close price for both high and low source
lowSource (float) : : Default is low. Can also use close price for both high and low source
waitForClose (simple bool) : : Considers source for direction change crossover if checked. Else, uses highSource and lowSource.
atrMaType (simple string) : : Moving Average type for ATR calculation. This can be sma, ema, hma, rma, wma, vwma, swma
atrlength (simple int) : : ATR Length
multiplier (simple float) : : ATR Multiplier
Returns: dir : Supertrend direction
supertrend : BuyStop if direction is 1 else SellStop

taLibrary "ta"
Collection of all custom and enhanced TA indicators
ma(source, maType, length)
returns custom moving averages
Parameters:
source (float) : Moving Average Source
maType (simple string) : Moving Average Type : Can be sma, ema, hma, rma, wma, vwma, swma, highlow, linreg, median
length (simple int) : Moving Average Length
Returns: moving average for the given type and length
atr(maType, length)
returns ATR with custom moving average
Parameters:
maType (simple string) : Moving Average Type : Can be sma, ema, hma, rma, wma, vwma, swma, highlow, linreg, median
length (simple int) : Moving Average Length
Returns: ATR for the given moving average type and length
atrpercent(maType, length)
returns ATR as percentage of close price
Parameters:
maType (simple string) : Moving Average Type : Can be sma, ema, hma, rma, wma, vwma, swma, highlow, linreg, median
length (simple int) : Moving Average Length
Returns: ATR as percentage of close price for the given moving average type and length
bb(source, maType, length, multiplier, sticky)
returns Bollinger band for custom moving average
Parameters:
source (float) : Moving Average Source
maType (simple string) : Moving Average Type : Can be sma, ema, hma, rma, wma, vwma, swma, highlow, linreg, median
length (simple int) : Moving Average Length
multiplier (float) : Standard Deviation multiplier
sticky (simple bool) : - sticky boundaries which will only change when value is outside boundary.
Returns: Bollinger band with custom moving average for given source, length and multiplier
bbw(source, maType, length, multiplier, sticky)
returns Bollinger bandwidth for custom moving average
Parameters:
source (float) : Moving Average Source
maType (simple string) : Moving Average Type : Can be sma, ema, hma, rma, wma, vwma, swma, highlow, linreg, median
length (simple int) : Moving Average Length
multiplier (float) : Standard Deviation multiplier
sticky (simple bool) : - sticky boundaries which will only change when value is outside boundary.
Returns: Bollinger Bandwidth for custom moving average for given source, length and multiplier
bpercentb(source, maType, length, multiplier, sticky)
returns Bollinger Percent B for custom moving average
Parameters:
source (float) : Moving Average Source
maType (simple string) : Moving Average Type : Can be sma, ema, hma, rma, wma, vwma, swma, highlow, linreg, median
length (simple int) : Moving Average Length
multiplier (float) : Standard Deviation multiplier
sticky (simple bool) : - sticky boundaries which will only change when value is outside boundary.
Returns: Bollinger Percent B for custom moving average for given source, length and multiplier
kc(source, maType, length, multiplier, useTrueRange, sticky)
returns Keltner Channel for custom moving average
Parameters:
source (float) : Moving Average Source
maType (simple string) : Moving Average Type : Can be sma, ema, hma, rma, wma, vwma, swma, highlow, linreg, median
length (simple int) : Moving Average Length
multiplier (float) : Standard Deviation multiplier
useTrueRange (simple bool) : - if set to false, uses high-low.
sticky (simple bool) : - sticky boundaries which will only change when value is outside boundary.
Returns: Keltner Channel for custom moving average for given souce, length and multiplier
kcw(source, maType, length, multiplier, useTrueRange, sticky)
returns Keltner Channel Width with custom moving average
Parameters:
source (float) : Moving Average Source
maType (simple string) : Moving Average Type : Can be sma, ema, hma, rma, wma, vwma, swma, highlow, linreg, median
length (simple int) : Moving Average Length
multiplier (float) : Standard Deviation multiplier
useTrueRange (simple bool) : - if set to false, uses high-low.
sticky (simple bool) : - sticky boundaries which will only change when value is outside boundary.
Returns: Keltner Channel Width for custom moving average
kpercentk(source, maType, length, multiplier, useTrueRange, sticky)
returns Keltner Channel Percent K Width with custom moving average
Parameters:
source (float) : Moving Average Source
maType (simple string) : Moving Average Type : Can be sma, ema, hma, rma, wma, vwma, swma, highlow, linreg, median
length (simple int) : Moving Average Length
multiplier (float) : Standard Deviation multiplier
useTrueRange (simple bool) : - if set to false, uses high-low.
sticky (simple bool) : - sticky boundaries which will only change when value is outside boundary.
Returns: Keltner Percent K for given moving average, source, length and multiplier
dc(length, useAlternateSource, alternateSource, sticky)
returns Custom Donchian Channel
Parameters:
length (simple int) : - donchian channel length
useAlternateSource (simple bool) : - Custom source is used only if useAlternateSource is set to true
alternateSource (float) : - Custom source
sticky (simple bool) : - sticky boundaries which will only change when value is outside boundary.
Returns: Donchian channel
dcw(length, useAlternateSource, alternateSource, sticky)
returns Donchian Channel Width
Parameters:
length (simple int) : - donchian channel length
useAlternateSource (simple bool) : - Custom source is used only if useAlternateSource is set to true
alternateSource (float) : - Custom source
sticky (simple bool) : - sticky boundaries which will only change when value is outside boundary.
Returns: Donchian channel width
dpercentd(length, useAlternateSource, alternateSource, sticky)
returns Donchian Channel Percent of price
Parameters:
length (simple int) : - donchian channel length
useAlternateSource (simple bool) : - Custom source is used only if useAlternateSource is set to true
alternateSource (float) : - Custom source
sticky (simple bool) : - sticky boundaries which will only change when value is outside boundary.
Returns: Donchian channel Percent D
oscillatorRange(source, method, highlowLength, rangeLength, sticky)
oscillatorRange - returns Custom overbought/oversold areas for an oscillator input
Parameters:
source (float) : - Osillator source such as RSI, COG etc.
method (simple string) : - Valid values for method are : sma, ema, hma, rma, wma, vwma, swma, highlow, linreg, median
highlowLength (simple int) : - length on which highlow of the oscillator is calculated
rangeLength (simple int) : - length used for calculating oversold/overbought range - usually same as oscillator length
sticky (simple bool) : - overbought, oversold levels won't change unless crossed
Returns: Dynamic overbought and oversold range for oscillator input
oscillator(type, length, shortLength, longLength, source, highSource, lowSource, method, highlowLength, sticky)
oscillator - returns Choice of oscillator with custom overbought/oversold range
Parameters:
type (simple string) : - oscillator type. Valid values : cci, cmo, cog, mfi, roc, rsi, stoch, tsi, wpr
length (simple int) : - Oscillator length - not used for TSI
shortLength (simple int) : - shortLength only used for TSI
longLength (simple int) : - longLength only used for TSI
source (float) : - custom source if required
highSource (float) : - custom high source for stochastic oscillator
lowSource (float) : - custom low source for stochastic oscillator
method (simple string) : - Valid values for method are : sma, ema, hma, rma, wma, vwma, swma, highlow, linreg, median
highlowLength (simple int) : - length on which highlow of the oscillator is calculated
sticky (simple bool) : - overbought, oversold levels won't change unless crossed
Returns: Oscillator value along with dynamic overbought and oversold range for oscillator input

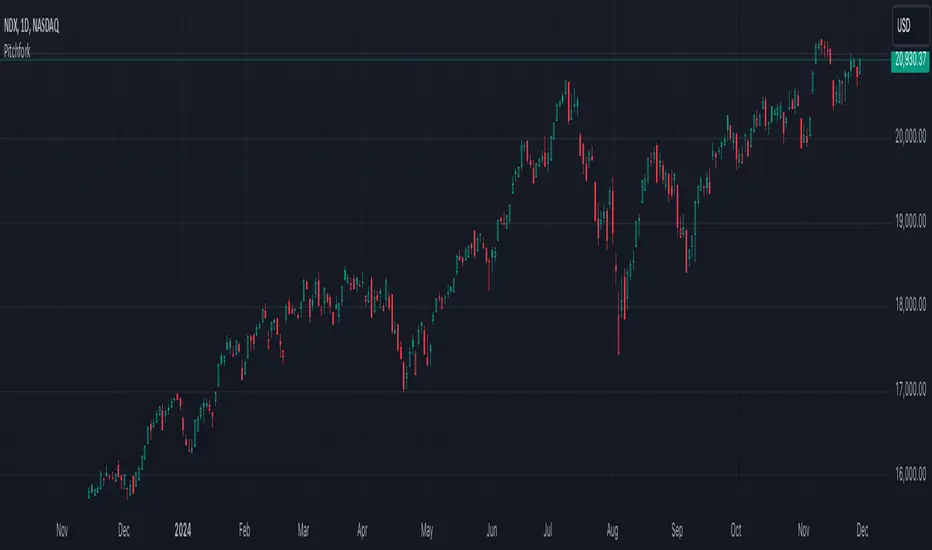
PitchforkLibrary "Pitchfork"
Pitchfork class
method tostring(this)
Converts PitchforkTypes/Fork object to string representation
Namespace types: Fork
Parameters:
this (Fork) : PitchforkTypes/Fork object
Returns: string representation of PitchforkTypes/Fork
method tostring(this)
Converts Array of PitchforkTypes/Fork object to string representation
Namespace types: array
Parameters:
this (array) : Array of PitchforkTypes/Fork object
Returns: string representation of PitchforkTypes/Fork array
method tostring(this, sortKeys, sortOrder)
Converts PitchforkTypes/PitchforkProperties object to string representation
Namespace types: PitchforkProperties
Parameters:
this (PitchforkProperties) : PitchforkTypes/PitchforkProperties object
sortKeys (bool) : If set to true, string output is sorted by keys.
sortOrder (int) : Applicable only if sortKeys is set to true. Positive number will sort them in ascending order whreas negative numer will sort them in descending order. Passing 0 will not sort the keys
Returns: string representation of PitchforkTypes/PitchforkProperties
method tostring(this, sortKeys, sortOrder)
Converts PitchforkTypes/PitchforkDrawingProperties object to string representation
Namespace types: PitchforkDrawingProperties
Parameters:
this (PitchforkDrawingProperties) : PitchforkTypes/PitchforkDrawingProperties object
sortKeys (bool) : If set to true, string output is sorted by keys.
sortOrder (int) : Applicable only if sortKeys is set to true. Positive number will sort them in ascending order whreas negative numer will sort them in descending order. Passing 0 will not sort the keys
Returns: string representation of PitchforkTypes/PitchforkDrawingProperties
method tostring(this, sortKeys, sortOrder)
Converts PitchforkTypes/Pitchfork object to string representation
Namespace types: Pitchfork
Parameters:
this (Pitchfork) : PitchforkTypes/Pitchfork object
sortKeys (bool) : If set to true, string output is sorted by keys.
sortOrder (int) : Applicable only if sortKeys is set to true. Positive number will sort them in ascending order whreas negative numer will sort them in descending order. Passing 0 will not sort the keys
Returns: string representation of PitchforkTypes/Pitchfork
method createDrawing(this)
Creates PitchforkTypes/PitchforkDrawing from PitchforkTypes/Pitchfork object
Namespace types: Pitchfork
Parameters:
this (Pitchfork) : PitchforkTypes/Pitchfork object
Returns: PitchforkTypes/PitchforkDrawing object created
method createDrawing(this)
Creates PitchforkTypes/PitchforkDrawing array from PitchforkTypes/Pitchfork array of objects
Namespace types: array
Parameters:
this (array) : array of PitchforkTypes/Pitchfork object
Returns: array of PitchforkTypes/PitchforkDrawing object created
method draw(this)
draws from PitchforkTypes/PitchforkDrawing object
Namespace types: PitchforkDrawing
Parameters:
this (PitchforkDrawing) : PitchforkTypes/PitchforkDrawing object
Returns: PitchforkTypes/PitchforkDrawing object drawn
method delete(this)
deletes PitchforkTypes/PitchforkDrawing object
Namespace types: PitchforkDrawing
Parameters:
this (PitchforkDrawing) : PitchforkTypes/PitchforkDrawing object
Returns: PitchforkTypes/PitchforkDrawing object deleted
method delete(this)
deletes underlying drawing of PitchforkTypes/Pitchfork object
Namespace types: Pitchfork
Parameters:
this (Pitchfork) : PitchforkTypes/Pitchfork object
Returns: PitchforkTypes/Pitchfork object deleted
method delete(this)
deletes array of PitchforkTypes/PitchforkDrawing objects
Namespace types: array
Parameters:
this (array) : Array of PitchforkTypes/PitchforkDrawing object
Returns: Array of PitchforkTypes/PitchforkDrawing object deleted
method delete(this)
deletes underlying drawing in array of PitchforkTypes/Pitchfork objects
Namespace types: array
Parameters:
this (array) : Array of PitchforkTypes/Pitchfork object
Returns: Array of PitchforkTypes/Pitchfork object deleted
method clear(this)
deletes array of PitchforkTypes/PitchforkDrawing objects and clears the array
Namespace types: array
Parameters:
this (array) : Array of PitchforkTypes/PitchforkDrawing object
Returns: void
method clear(this)
deletes array of PitchforkTypes/Pitchfork objects and clears the array
Namespace types: array
Parameters:
this (array) : Array of Pitchfork/Pitchfork object
Returns: void
PitchforkDrawingProperties
Pitchfork Drawing Properties object
Fields:
extend (series bool) : If set to true, forks are extended towards right. Default is true
fill (series bool) : Fill forklines with transparent color. Default is true
fillTransparency (series int) : Transparency at which fills are made. Only considered when fill is set. Default is 80
forceCommonColor (series bool) : Force use of common color for forks and fills. Default is false
commonColor (series color) : common fill color. Used only if ratio specific fill colors are not available or if forceCommonColor is set to true.
PitchforkDrawing
Pitchfork drawing components
Fields:
medianLine (Line type from Trendoscope/Drawing/2) : Median line of the pitchfork
baseLine (Line type from Trendoscope/Drawing/2) : Base line of the pitchfork
forkLines (array type from Trendoscope/Drawing/2) : fork lines of the pitchfork
linefills (array type from Trendoscope/Drawing/2) : Linefills between forks
Fork
Fork object property
Fields:
ratio (series float) : Fork ratio
forkColor (series color) : color of fork. Default is blue
include (series bool) : flag to include the fork in drawing. Default is true
PitchforkProperties
Pitchfork Properties
Fields:
forks (array) : Array of Fork objects
type (series string) : Pitchfork type. Supported values are "regular", "schiff", "mschiff", Default is regular
inside (series bool) : Flag to identify if to draw inside fork. If set to true, inside fork will be drawn
Pitchfork
Pitchfork object
Fields:
a (chart.point) : Pivot Point A of pitchfork
b (chart.point) : Pivot Point B of pitchfork
c (chart.point) : Pivot Point C of pitchfork
properties (PitchforkProperties) : PitchforkProperties object which determines type and composition of pitchfork
dProperties (PitchforkDrawingProperties) : Drawing properties for pitchfork
lProperties (LineProperties type from Trendoscope/Drawing/2) : Common line properties for Pitchfork lines
drawing (PitchforkDrawing) : PitchforkDrawing object
SnowdexUtilsLibrary "SnowdexUtils"
the various function that often use when create a strategy trading.
f_backtesting_date(train_start_date, train_end_date, test_date, deploy_date)
Backtesting within a specific window based on deployment and testing dates.
Parameters:
train_start_date (int) : the start date for training the strategy.
train_end_date (int) : the end date for training the strategy.
test_date (bool) : if true, backtests within the period from `train_end_date` to the current time.
deploy_date (bool) : if true, the strategy backtests up to the current time.
Returns: given time falls within the specified window for backtesting.
f_init_ma(ma_type, source, length)
Initializes a moving average based on the specified type.
Parameters:
ma_type (simple string) : the type of moving average (e.g., "RMA", "EMA", "SMA", "WMA").
source (float) : the input series for the moving average calculation.
length (simple int) : the length of the moving average window.
Returns: the calculated moving average value.
f_init_tp(side, entry_price, rr, sl_open_position)
Calculates the target profit based on entry price, risk-reward ratio, and stop loss. The formula is `tp = entry price + (rr * (entry price - stop loss))`.
Parameters:
side (bool) : the trading side (true for long, false for short).
entry_price (float) : the entry price of the position.
rr (float) : the risk-reward ratio.
sl_open_position (float) : the stop loss price for the open position.
Returns: the calculated target profit value.
f_round_up(number, decimals)
Rounds up a number to a specified number of decimals.
Parameters:
number (float)
decimals (int)
Returns: The rounded-up number.
f_get_pip_size()
Calculates the pip size for the current instrument.
Returns: Pip size adjusted for Forex instruments or 1 for others.
f_table_get_position(value)
Maps a string to a table position constant.
Parameters:
value (string) : String representing the desired position (e.g., "Top Right").
Returns: The corresponding position constant or `na` for invalid values.

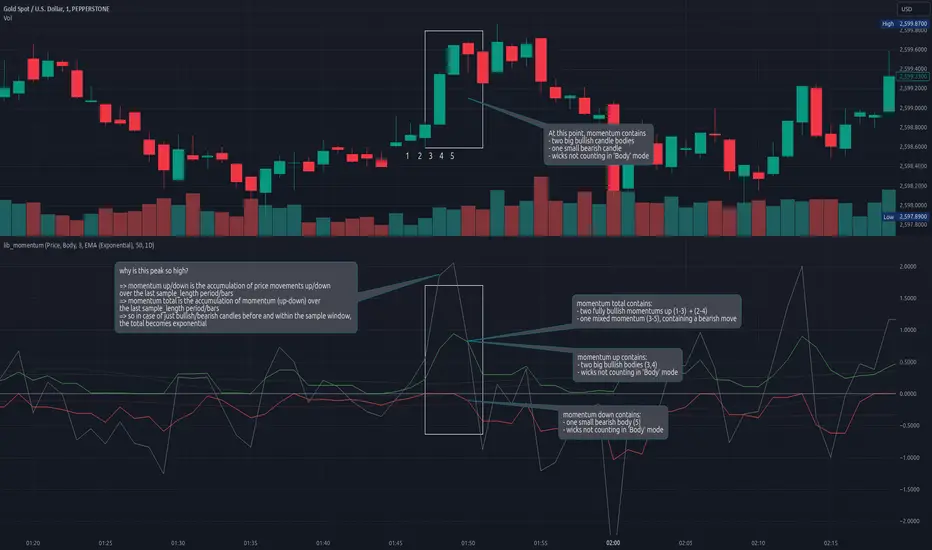
lib_momentumLibrary "lib_momentum"
This library calculates the momentum, derived from a sample range of prior candles. Depending on set MomentumType it either deduces the momentum from the price, volume, or a product of both. If price/product are selected, you can choose from SampleType if only candle body, full range from high to low or a combination of both (body counts full, wicks half for each direction) should be used. Optional: You can choose to normalize the results, dividing each value by its average (normalization_ma_length, normalization_ma). This will allow comparison between different instruments. For the normalization Moving Average you can choose any currently supported in my lib_no_delay.
get_momentum(momentum_type, sample_type, sample_length, normalization_ma_length, normalization_ma)
Parameters:
momentum_type (series MomentumType) : select one of MomentumType. to sample the price, volume or a product of both
sample_type (series SampleType) : select one of SampleType. to sample the body, total range from high to low or a combination of both (body count full, wicks half for each direction)
sample_length (simple int) : how many candles should be sampled (including the current)
normalization_ma_length (simple int) : if you want to normalize results (momentum / momentum average) this sets the period for the average. (default = 0 => no normalization)
normalization_ma (simple MovingAverage enum from robbatt/lib_no_delay/9) : is the type of moving average to normalize / compare with
Returns: returns the current momentum where the total line is not just (up - down) but also sampled over the sample_length and can therefore be used as trend indicator. If up/down fail to reach total's level it's a sign of decreasing momentum, if up/down exceed total the trend it's a sign of increasing momentum.
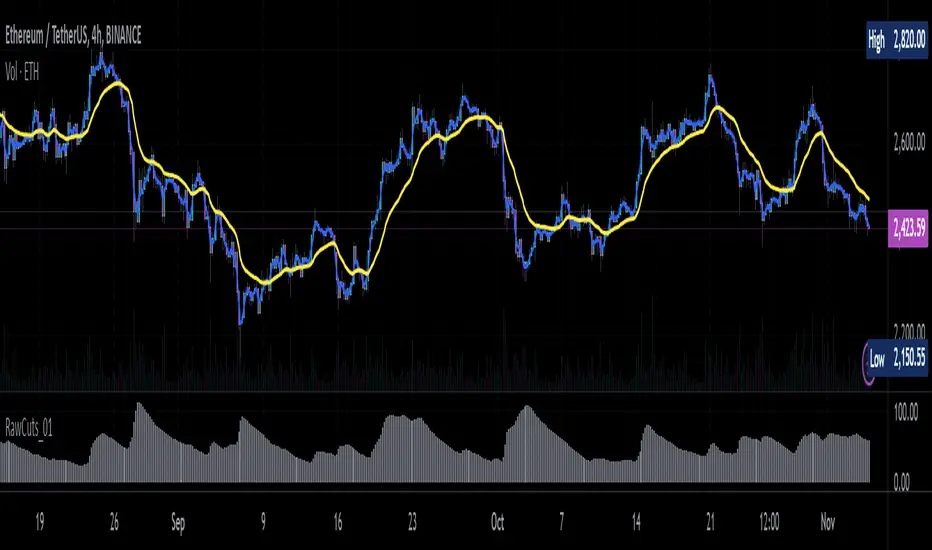
RawCuts_01Library "RawCuts_01"
A collection of functions by:
mutantdog
The majority of these are used within published projects, some useful variants have been included here aswell.
This is volume one consisting mainly of smaller functions, predominantly the filters and standard deviations from Weight Gain 4000.
Also included at the bottom are various snippets of related code for demonstration. These can be copied and adjusted according to your needs.
A full up-to-date table of contents is located at the top of the main script.
WEIGHT GAIN FILTERS
A collection of moving average type filters with adjustable volume weighting.
Based upon the two most common methods of volume weighting.
'Simple' uses the standard method in which a basic VWMA is analogous to SMA.
'Elastic' uses exponential method found in EVWMA which is analogous to RMA.
Volume weighting is applied according to an exponent multiplier of input volume.
0 >> volume^0 (unweighted), 1 >> volume^1 (fully weighted), use float values for intermediate weighting.
Additional volume filter switch for smoothing of outlier events.
DIVA MODULAR DEVIATIONS
A small collection of standard and absolute deviations.
Includes the weightgain functionality as above.
Basic modular functionality for more creative uses.
Optional input (ct) for external central tendency (aka: estimator).
Can be assigned to alternative filter or any float value. Will default to internal filter when no ct input is received.
Some other useful or related functions included at the bottom along with basic demonstration use.
weightgain_sma(src, len, xVol, fVol)
Simple Moving Average (SMA): Weight Gain (Simple Volume).
Parameters:
src (float) : Source input.
len (int) : Length (number of bars).
xVol (float) : Volume exponent multiplier (0 = unweighted, 1 = fully weighted).
fVol (bool) : Volume smoothing filter.
Returns: Standard Simple Moving Average with Simple Weight Gain applied.
weightgain_hsma(src, len, xVol, fVol)
Harmonic Simple Moving Average (hSMA): Weight Gain (Simple Volume).
Parameters:
src (float) : Source input.
len (int) : Length (number of bars).
xVol (float) : Volume exponent multiplier (0 = unweighted, 1 = fully weighted).
fVol (bool) : Volume smoothing filter.
Returns: Harmonic Simple Moving Average with Simple Weight Gain applied.
weightgain_gsma(src, len, xVol, fVol)
Geometric Simple Moving Average (gSMA): Weight Gain (Simple Volume).
Parameters:
src (float) : Source input.
len (int) : Length (number of bars).
xVol (float) : Volume exponent multiplier (0 = unweighted, 1 = fully weighted).
fVol (bool) : Volume smoothing filter.
Returns: Geometric Simple Moving Average with Simple Weight Gain applied.
weightgain_wma(src, len, xVol, fVol)
Linear Weighted Moving Average (WMA): Weight Gain (Simple Volume).
Parameters:
src (float) : Source input.
len (int) : Length (number of bars).
xVol (float) : Volume exponent multiplier (0 = unweighted, 1 = fully weighted).
fVol (bool) : Volume smoothing filter.
Returns: Basic Linear Weighted Moving Average with Simple Weight Gain applied.
weightgain_hma(src, len, xVol, fVol)
Hull Moving Average (HMA): Weight Gain (Simple Volume).
Parameters:
src (float) : Source input.
len (int) : Length (number of bars).
xVol (float) : Volume exponent multiplier (0 = unweighted, 1 = fully weighted).
fVol (bool) : Volume smoothing filter.
Returns: Basic Hull Moving Average with Simple Weight Gain applied.
diva_sd_sma(src, len, xVol, fVol, ct)
Standard Deviation (SD SMA): Diva / Weight Gain (Simple Volume)
Parameters:
src (float) : Source input.
len (int) : Length (number of bars).
xVol (float) : Volume exponent multiplier (0 = unweighted, 1 = fully weighted).
fVol (bool) : Volume smoothing filter.
ct (float) : Central tendency (optional, na = bypass). Internal: weightgain_sma().
Returns:
diva_sd_wma(src, len, xVol, fVol, ct)
Standard Deviation (SD WMA): Diva / Weight Gain (Simple Volume).
Parameters:
src (float) : Source input.
len (int) : Length (number of bars).
xVol (float) : Volume exponent multiplier (0 = unweighted, 1 = fully weighted).
fVol (bool) : Volume smoothing filter.
ct (float) : Central tendency (optional, na = bypass). Internal: weightgain_wma().
Returns:
diva_aad_sma(src, len, xVol, fVol, ct)
Average Absolute Deviation (AAD SMA): Diva / Weight Gain (Simple Volume).
Parameters:
src (float) : Source input.
len (int) : Length (number of bars).
xVol (float) : Volume exponent multiplier (0 = unweighted, 1 = fully weighted).
fVol (bool) : Volume smoothing filter.
ct (float) : Central tendency (optional, na = bypass). Internal: weightgain_sma().
Returns:
diva_aad_wma(src, len, xVol, fVol, ct)
Average Absolute Deviation (AAD WMA): Diva / Weight Gain (Simple Volume) .
Parameters:
src (float) : Source input.
len (int) : Length (number of bars).
xVol (float) : Volume exponent multiplier (0 = unweighted, 1 = fully weighted).
fVol (bool) : Volume smoothing filter.
ct (float) : Central tendency (optional, na = bypass). Internal: weightgain_wma().
Returns:
weightgain_ema(src, len, xVol, fVol)
Exponential Moving Average (EMA): Weight Gain (Elastic Volume).
Parameters:
src (float) : Source input.
len (int) : Length (number of bars).
xVol (float) : Volume exponent multiplier (0 = unweighted, 1 = fully weighted).
fVol (bool) : Volume smoothing filter.
Returns: Exponential Moving Average with Elastic Weight Gain applied.
weightgain_dema(src, len, xVol, fVol)
Double Exponential Moving Average (DEMA): Weight Gain (Elastic Volume).
Parameters:
src (float) : Source input.
len (int) : Length (number of bars).
xVol (float) : Volume exponent multiplier (0 = unweighted, 1 = fully weighted).
fVol (bool) : Volume smoothing filter.
Returns: Double Exponential Moving Average with Elastic Weight Gain applied.
weightgain_tema(src, len, xVol, fVol)
Triple Exponential Moving Average (TEMA): Weight Gain (Elastic Volume).
Parameters:
src (float) : Source input.
len (int) : Length (number of bars).
xVol (float) : Volume exponent multiplier (0 = unweighted, 1 = fully weighted).
fVol (bool) : Volume smoothing filter.
Returns: Triple Exponential Moving Average with Elastic Weight Gain applied.
weightgain_rma(src, len, xVol, fVol)
Rolling Moving Average (RMA): Weight Gain (Elastic Volume).
Parameters:
src (float) : Source input.
len (int) : Length (number of bars).
xVol (float) : Volume exponent multiplier (0 = unweighted, 1 = fully weighted).
fVol (bool) : Volume smoothing filter.
Returns: Rolling Moving Average with Elastic Weight Gain applied.
weightgain_drma(src, len, xVol, fVol)
Double Rolling Moving Average (DRMA): Weight Gain (Elastic Volume).
Parameters:
src (float) : Source input.
len (int) : Length (number of bars).
xVol (float) : Volume exponent multiplier (0 = unweighted, 1 = fully weighted).
fVol (bool) : Volume smoothing filter.
Returns: Double Rolling Moving Average with Elastic Weight Gain applied.
weightgain_trma(src, len, xVol, fVol)
Triple Rolling Moving Average (TRMA): Weight Gain (Elastic Volume).
Parameters:
src (float) : Source input.
len (int) : Length (number of bars).
xVol (float) : Volume exponent multiplier (0 = unweighted, 1 = fully weighted).
fVol (bool) : Volume smoothing filter.
Returns: Triple Rolling Moving Average with Elastic Weight Gain applied.
diva_sd_ema(src, len, xVol, fVol, ct)
Standard Deviation (SD EMA): Diva / Weight Gain: (Elastic Volume).
Parameters:
src (float) : Source input.
len (int) : Length (number of bars).
xVol (float) : Volume exponent multiplier (0 = unweighted, 1 = fully weighted).
fVol (bool) : Volume smoothing filter.
ct (float) : Central tendency (optional, na = bypass). Internal: weightgain_ema().
Returns:
diva_sd_rma(src, len, xVol, fVol, ct)
Standard Deviation (SD RMA): Diva / Weight Gain: (Elastic Volume).
Parameters:
src (float) : Source input.
len (int) : Length (number of bars).
xVol (float) : Volume exponent multiplier (0 = unweighted, 1 = fully weighted).
fVol (bool) : Volume smoothing filter.
ct (float) : Central tendency (optional, na = bypass). Internal: weightgain_rma().
Returns:
weightgain_vidya_rma(src, len, xVol, fVol)
VIDYA v1 RMA base (VIDYA-RMA): Weight Gain (Elastic Volume).
Parameters:
src (float) : Source input.
len (int) : Length (number of bars).
xVol (float) : Volume exponent multiplier (0 = unweighted, 1 = fully weighted).
fVol (bool) : Volume smoothing filter.
Returns: VIDYA v1, RMA base with Elastic Weight Gain applied.
weightgain_vidya_ema(src, len, xVol, fVol)
VIDYA v1 EMA base (VIDYA-EMA): Weight Gain (Elastic Volume).
Parameters:
src (float) : Source input.
len (int) : Length (number of bars).
xVol (float) : Volume exponent multiplier (0 = unweighted, 1 = fully weighted).
fVol (bool) : Volume smoothing filter.
Returns: VIDYA v1, EMA base with Elastic Weight Gain applied.
diva_sd_vidya_rma(src, len, xVol, fVol, ct)
Standard Deviation (SD VIDYA-RMA): Diva / Weight Gain: (Elastic Volume).
Parameters:
src (float) : Source input.
len (int) : Length (number of bars).
xVol (float) : Volume exponent multiplier (0 = unweighted, 1 = fully weighted).
fVol (bool) : Volume smoothing filter.
ct (float) : Central tendency (optional, na = bypass). Internal: weightgain_vidya_rma().
Returns:
diva_sd_vidya_ema(src, len, xVol, fVol, ct)
Standard Deviation (SD VIDYA-EMA): Diva / Weight Gain: (Elastic Volume).
Parameters:
src (float) : Source input.
len (int) : Length (number of bars).
xVol (float) : Volume exponent multiplier (0 = unweighted, 1 = fully weighted).
fVol (bool) : Volume smoothing filter.
ct (float) : Central tendency (optional, na = bypass). Internal: weightgain_vidya_ema().
Returns:
weightgain_sema(src, len, xVol, fVol)
Parameters:
src (float)
len (simple int)
xVol (float)
fVol (bool)
diva_sd_sema(src, len, xVol, fVol)
Parameters:
src (float)
len (simple int)
xVol (float)
fVol (bool)
diva_mad_mm(src, len, ct)
Median Absolute Deviation (MAD MM): Diva (no volume weighting).
Parameters:
src (float) : Source input.
len (int) : Length (number of bars).
ct (float) : Central tendency (optional, na = bypass). Internal: ta.median()
Returns:
source_switch(slct, aux1, aux2, aux3, aux4)
Custom Source Selector/Switch function. Features standard & custom 'weighted' sources with additional aux inputs.
Parameters:
slct (string) : Choose from custom set of string values.
aux1 (float) : Additional input for user-defined source, eg: standard input.source(). Optional, use na to bypass.
aux2 (float) : Additional input for user-defined source, eg: standard input.source(). Optional, use na to bypass.
aux3 (float) : Additional input for user-defined source, eg: standard input.source(). Optional, use na to bypass.
aux4 (float) : Additional input for user-defined source, eg: standard input.source(). Optional, use na to bypass.
Returns: Float value, to be used as src input for other functions.
colour_gradient_ma_div(ma1, ma2, div, bull, bear, mid, mult)
Colour Gradient for plot fill between two moving averages etc, with seperate bull/bear and divergence strength.
Parameters:
ma1 (float) : Input for fast moving average (eg: bullish when above ma2).
ma2 (float) : Input for slow moving average (eg: bullish when below ma1).
div (float) : Input deviation/divergence value used to calculate strength of colour.
bull (color) : Colour when ma1 above ma2.
bear (color) : Colour when ma1 below ma2.
mid (color) : Neutral colour when ma1 = ma2.
mult (int) : Opacity multiplier. 100 = maximum, 0 = transparent.
Returns: Colour with transparency (according to specified inputs)
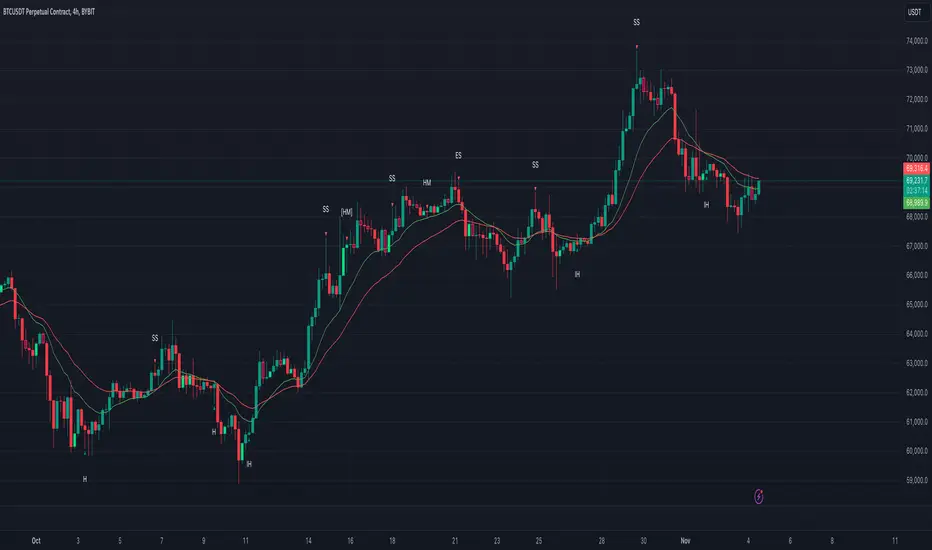
CandlestickPatternsLibrary "CandlestickPatterns"
zigzag(_low, _high, depth, deviation, backstep)
Parameters:
_low (float)
_high (float)
depth (int)
deviation (int)
backstep (int)
getTrend(trendType, currentClose, zz_downtrend, zz_uptrend, ema14, ema28)
Parameters:
trendType (string)
currentClose (float)
zz_downtrend (bool)
zz_uptrend (bool)
ema14 (float)
ema28 (float)
isInside(currentHigh, currentLow, currentClose, currentOpen, prevHigh, prevLow)
Parameters:
currentHigh (float)
currentLow (float)
currentClose (float)
currentOpen (float)
prevHigh (float)
prevLow (float)
checkMorningStar(open0, high0, low0, close0, open1, high1, low1, close1, open2, high2, low2, close2, innerCandleThreshold, closingMinThreshold, closingMaxThreshold, useDojiFilter, dojiSize, downTrend)
Parameters:
open0 (float)
high0 (float)
low0 (float)
close0 (float)
open1 (float)
high1 (float)
low1 (float)
close1 (float)
open2 (float)
high2 (float)
low2 (float)
close2 (float)
innerCandleThreshold (float)
closingMinThreshold (float)
closingMaxThreshold (float)
useDojiFilter (bool)
dojiSize (float)
downTrend (bool)
checkEveningStar(open0, high0, low0, close0, open1, high1, low1, close1, open2, high2, low2, close2, innerCandleThreshold, closingMinThreshold, closingMaxThreshold, useDojiFilter, dojiSize, upTrend)
Parameters:
open0 (float)
high0 (float)
low0 (float)
close0 (float)
open1 (float)
high1 (float)
low1 (float)
close1 (float)
open2 (float)
high2 (float)
low2 (float)
close2 (float)
innerCandleThreshold (float)
closingMinThreshold (float)
closingMaxThreshold (float)
useDojiFilter (bool)
dojiSize (float)
upTrend (bool)
checkHammerPattern(open, high, low, close, bodyAvg, shadowFactor, downTrend)
Parameters:
open (float)
high (float)
low (float)
close (float)
bodyAvg (float)
shadowFactor (float)
downTrend (bool)
checkInvertedHammerPattern(open, high, low, close, bodyAvg, shadowFactor, downTrend)
Parameters:
open (float)
high (float)
low (float)
close (float)
bodyAvg (float)
shadowFactor (float)
downTrend (bool)
checkHangingManPattern(open, high, low, close, bodyAvg, shadowFactor, upTrend)
Parameters:
open (float)
high (float)
low (float)
close (float)
bodyAvg (float)
shadowFactor (float)
upTrend (bool)
checkShootingStarPattern(open, high, low, close, bodyAvg, shadowFactor, upTrend)
Parameters:
open (float)
high (float)
low (float)
close (float)
bodyAvg (float)
shadowFactor (float)
upTrend (bool)
checkLevels(high0, high1, high2, low0, low1, low2, lookbackPeriod)
Parameters:
high0 (float)
high1 (float)
high2 (float)
low0 (float)
low1 (float)
low2 (float)
lookbackPeriod (int)
HTFBands█ OVERVIEW
Contains type and methods for drawing higher-timeframe bands of several types:
Bollinger bands
Parabolic SAR
Supertrend
VWAP
By copy pasting ready made code sections to your script you can add as many multi-timeframe bands as necessary.
█ HOW TO USE
Please see instructions in the code. (Important: first fold all sections of the script: press Cmd + K then Cmd + - (for Windows Ctrl + K then Ctrl + -)
█ FULL LIST OF FUNCTIONS AND PARAMETERS
atr2(length)
An alternate ATR function to the `ta.atr()` built-in, which allows a "series float"
`length` argument.
Parameters:
length (float) : (series int/float) Length for the smoothing parameter calculation.
Returns: (float) The ATR value.
pine_supertrend2(factor, atrLength, wicks)
An alternate SuperTrend function to `supertrend()`, which allows a "series float"
`atrLength` argument.
Parameters:
factor (float) : (series int/float) Multiplier for the ATR value.
atrLength (float) : (series int/float) Length for the ATR smoothing parameter calculation.
wicks (simple bool) : (simple bool) Condition to determine whether to take candle wicks into account when
reversing trend, or to use the close price. Optional. Default is false.
Returns: ( ) A tuple of the superTrend value and trend direction.
method getDefaultBandQ1(bandType)
For a given BandType returns its default Q1
Namespace types: series BandTypes
Parameters:
bandType (series BandTypes)
method getDefaultBandQ2(bandType)
For a given BandType returns its default Q2
Namespace types: series BandTypes
Parameters:
bandType (series BandTypes)
method getDefaultBandQ3(bandType)
For a given BandType returns its default Q3
Namespace types: series BandTypes
Parameters:
bandType (series BandTypes)
method init(this, bandsType, q1, q2, q3, vwapAnchor)
Initiates RsParamsBands for each band (used in htfUpdate() withi req.sec())
Namespace types: RsParamsBands
Parameters:
this (RsParamsBands)
bandsType (series BandTypes)
q1 (float) : (float) Depending on type: BB - length, SAR - AF start, ST - ATR's prd
q2 (float) : (float) Depending on type: BB - StdDev mult, SAR - AF step, ST - mult
q3 (float) : (float) Depending on type: BB - not used, SAR - AF max, ST - not used
vwapAnchor (series VwapAnchors) : (VwapAnchors) VWAP ahcnor
method init(this, bandsType, tf, showRecentBars, lblsShow, lblsMaxLabels, lblSize, lnMidClr, lnUpClr, lnLoClr, fill, fillClr, lnWidth, lnSmoothen)
Initialises object with params (incl. input). Creates arrays if any.
Namespace types: HtfBands
Parameters:
this (HtfBands)
bandsType (series BandTypes) : (BandTypes) Just used to enable/disable - if BandTypes.none then disable )
tf (string) : (string) Timeframe
showRecentBars (int) : (int) Only show over this number of recent bars
lblsShow (bool) : (bool) Show labels
lblsMaxLabels (int) : (int) Max labels to show
lblSize (string) : (string) Size of the labels
lnMidClr (color) : (color) Middle band color
lnUpClr (color) : (color) Upper band color
lnLoClr (color) : (color) Lower band color
fill (bool)
fillClr (color) : (color) Fill color
lnWidth (int) : (int) Line width
lnSmoothen (bool) : (bool) Smoothen the bands
method htfUpdateTuple(rsPrms, repaint)
(HTF) Calculates Bands within request.security(). Returns tuple . If any or all of the bands are not available returns na as their value.
Namespace types: RsParamsBands
Parameters:
rsPrms (RsParamsBands) : (RsParamsBands) Parameters of the band.
repaint (bool) : (bool) If true does not update on realtime bars.
Returns: A tuple (corresponds to fields in RsReturnBands)
method importRsRetTuple(this, htfBi, mid, up, lo, dir)
Imports a tuple returned from req.sec() into an HtfBands object
Namespace types: HtfBands
Parameters:
this (HtfBands) : (HtfBands) Object to import to
htfBi (int) : (float) Higher timeframe's bar index (Default = na)
mid (float)
up (float) : (float) Value of upper band (Default = na)
lo (float) : (float) Value of lower band (Default = na)
dir (int) : (int) Direction (for bands like Parabolic SAR) (Default = na)
method addUpdDrawings(this, rsPrms)
Draws band's labels
Namespace types: HtfBands
Parameters:
this (HtfBands)
rsPrms (RsParamsBands)
method update(this)
Sets band's values to na on intrabars if `smoothen` is set.
Namespace types: HtfBands
Parameters:
this (HtfBands)
method newRsParamsBands(this)
A wraper for RsParamsBands.new()
Namespace types: LO_A
Parameters:
this (LO_A)
method newHtfBands(this)
A wraper for HtfBands.new()
Namespace types: LO_B
Parameters:
this (LO_B)
RsParamsBands
Used to pass bands' params to req.sec()
Fields:
bandsType (series BandTypes) : (enum BandTypes) Type of the band (BB, SAR etc.)
q1 (series float) : (float) Depending on type: BB - length, SAR - AF start, ST - ATR's prd
q2 (series float) : (float) Depending on type: BB - StdDev mult, SAR - AF step, ST - mult
q3 (series float) : (float) Depending on type: BB - not used, SAR - AF max, ST - not used
vwapAnchor (series VwapAnchors)
RsReturnBands
Used to return bands' data from req.sec(). Params of the bands are in RsParamsBands
Fields:
htfBi (series float) : (float) Higher timeframe's bar index (Default = na)
upBand (series float) : (float) Value of upper band (Default = na)
loBand (series float) : (float) Value of lower band (Default = na)
midBand (series float) : (float) Value of middle band (Default = na)
dir (series int) : (float) Direction (for bands like Parabolic SAR) (Default = na)
BandsDrawing
Contains plot visualization parameters and stores and keeps track of lines, labels and other visual objects (not plots)
Fields:
lnMidClr (series color) : (color) Middle band color
lnLoClr (series color) : (color) Lower band color
lnUpClr (series color) : (color) Upper band color
fillUpClr (series color)
fillLoClr (series color)
lnWidth (series int) : (int) Line width
lnSmoothen (series bool) : (bool) Smoothen the bands
showHistory (series bool) : (bool) If true show bands lines, otherwise only current level
showRecentBars (series int) : (int) Only show over this number of recent bars
arLbl (array) : (label Labels
lblsMaxLabels (series int) : (int) Max labels to show
lblsShow (series bool) : (bool) Show labels
lblSize (series string) : (string) Size of the labels
HtfBands
Calcs and draws HTF bands
Fields:
rsRet (RsReturnBands) : (RsReturnBands) Bands' values
rsRetNaObj (RsReturnBands) : (RsReturnBands) Dummy na obj for returning from request.security()
rsPrms (RsParamsBands) : (RsParamsBands) Band parameters (for htfUpdate() called in req.sec() )
drw (BandsDrawing) : (BandsDrawing) Contains plot visualization parameters and stores and keeps track of lines, labels and other visual objects (not plots)
enabled (series bool) : (bool) Toggles bands on/off
tf (series string) : (string) Timeframe
LO_A
LO Library object, whose only purpose is to serve as a shorthand for library name in script code.
Fields:
dummy (series string)
LO_B
LO Library object, whose only purpose is to serve as a shorthand for library name in script code.
Fields:
dummy (series string)

HTFMAs█ OVERVIEW
Contains a type HTFMA used to return data on six moving averages from a higher timeframe.
Several types of MA's are supported.
█ HOW TO USE
Please see instructions in the code (in library description). (Important: first fold all sections of the script: press Cmd + K then Cmd + - (for Windows Ctrl + K then Ctrl + -)
█ FULL LIST OF FUNCTIONS AND PARAMETERS
method getMaType(this)
Enumerator function, given a key returns `enum MaTypes` value
Namespace types: series string, simple string, input string, const string
Parameters:
this (string)
method init(this, enableAll, ma1Enabled, ma1MaType, ma1Src, ma1Prd, ma2Enabled, ma2MaType, ma2Src, ma2Prd, ma3Enabled, ma3MaType, ma3Src, ma3Prd, ma4Enabled, ma4MaType, ma4Src, ma4Prd, ma5Enabled, ma5MaType, ma5Src, ma5Prd, ma6Enabled, ma6MaType, ma6Src, ma6Prd)
Namespace types: RsParamsMAs
Parameters:
this (RsParamsMAs)
enableAll (simple MaEnable)
ma1Enabled (bool)
ma1MaType (series MaTypes)
ma1Src (string)
ma1Prd (int)
ma2Enabled (bool)
ma2MaType (series MaTypes)
ma2Src (string)
ma2Prd (int)
ma3Enabled (bool)
ma3MaType (series MaTypes)
ma3Src (string)
ma3Prd (int)
ma4Enabled (bool)
ma4MaType (series MaTypes)
ma4Src (string)
ma4Prd (int)
ma5Enabled (bool)
ma5MaType (series MaTypes)
ma5Src (string)
ma5Prd (int)
ma6Enabled (bool)
ma6MaType (series MaTypes)
ma6Src (string)
ma6Prd (int)
method init(this, enableAll, tf, rngAtrQ, showRecentBars, lblsOffset, lblsShow, lnOffset, lblSize, lblStyle, smoothen, ma1lnClr, ma1lnWidth, ma1lnStyle, ma2lnClr, ma2lnWidth, ma2lnStyle, ma3lnClr, ma3lnWidth, ma3lnStyle, ma4lnClr, ma4lnWidth, ma4lnStyle, ma5lnClr, ma5lnWidth, ma5lnStyle, ma6lnClr, ma6lnWidth, ma6lnStyle, ma1ShowHistory, ma2ShowHistory, ma3ShowHistory, ma4ShowHistory, ma5ShowHistory, ma6ShowHistory, ma1ShowLabel, ma2ShowLabel, ma3ShowLabel, ma4ShowLabel, ma5ShowLabel, ma6ShowLabel)
Namespace types: HTFMAs
Parameters:
this (HTFMAs)
enableAll (series MaEnable)
tf (string)
rngAtrQ (int)
showRecentBars (int)
lblsOffset (int)
lblsShow (bool)
lnOffset (int)
lblSize (string)
lblStyle (string)
smoothen (bool)
ma1lnClr (color)
ma1lnWidth (int)
ma1lnStyle (string)
ma2lnClr (color)
ma2lnWidth (int)
ma2lnStyle (string)
ma3lnClr (color)
ma3lnWidth (int)
ma3lnStyle (string)
ma4lnClr (color)
ma4lnWidth (int)
ma4lnStyle (string)
ma5lnClr (color)
ma5lnWidth (int)
ma5lnStyle (string)
ma6lnClr (color)
ma6lnWidth (int)
ma6lnStyle (string)
ma1ShowHistory (bool)
ma2ShowHistory (bool)
ma3ShowHistory (bool)
ma4ShowHistory (bool)
ma5ShowHistory (bool)
ma6ShowHistory (bool)
ma1ShowLabel (bool)
ma2ShowLabel (bool)
ma3ShowLabel (bool)
ma4ShowLabel (bool)
ma5ShowLabel (bool)
ma6ShowLabel (bool)
method get(this, id)
Namespace types: RsParamsMAs
Parameters:
this (RsParamsMAs)
id (int)
method set(this, id, prop, val)
Namespace types: RsParamsMAs
Parameters:
this (RsParamsMAs)
id (int)
prop (string)
val (string)
method set(this, id, prop, val)
Namespace types: HTFMAs
Parameters:
this (HTFMAs)
id (int)
prop (string)
val (string)
method htfUpdateTuple(rsParams, repaint)
Namespace types: RsParamsMAs
Parameters:
rsParams (RsParamsMAs)
repaint (bool)
method clear(this)
Namespace types: MaDrawing
Parameters:
this (MaDrawing)
method importRsRetTuple(this, htfBi, ma1, ma2, ma3, ma4, ma5, ma6)
Namespace types: HTFMAs
Parameters:
this (HTFMAs)
htfBi (int)
ma1 (float)
ma2 (float)
ma3 (float)
ma4 (float)
ma5 (float)
ma6 (float)
method getDrw(this, id)
Namespace types: HTFMAs
Parameters:
this (HTFMAs)
id (int)
method setDrwProp(this, id, prop, val)
Namespace types: HTFMAs
Parameters:
this (HTFMAs)
id (int)
prop (string)
val (string)
method initDrawings(this, rsPrms, dispBandWidth)
Namespace types: HTFMAs
Parameters:
this (HTFMAs)
rsPrms (RsParamsMAs)
dispBandWidth (float)
method updateDrawings(this, rsPrms, dispBandWidth)
Namespace types: HTFMAs
Parameters:
this (HTFMAs)
rsPrms (RsParamsMAs)
dispBandWidth (float)
method update(this)
Namespace types: HTFMAs
Parameters:
this (HTFMAs)
method importConfig(this, oCfg, maCount)
Imports HTF MAs settings from objProps (of any level) into `RsParamsMAs` child `RsMaCalcParams` objects (into the first first `maCount` of them)
Namespace types: RsParamsMAs
Parameters:
this (RsParamsMAs) : (RsParamsMAs) Target object to import prop values to.
oCfg (objProps type from moebius1977/CSVParser/1) : (CSVP.objProps) (one of objProps types) an objProps, ... opjProps8 containing properties' values in a child objProps objects
maCount (int) : (int) Number of tgtObj's RsMaCalcParams childs of tgtObj to set (1 to 6, starting from 1)
Returns: this
method importConfig(this, oCfg, maCount)
Imports HTF MAs settings from objProps (of any level) into `RsParamsMAs` child `RsMaCalcParams` objects (into the first first `maCount` of them)
Namespace types: RsParamsMAs
Parameters:
this (RsParamsMAs) : (RsParamsMAs) Target object to import prop values to.
oCfg (objProps0 type from moebius1977/CSVParser/1) : (CSVP.objProps) (one of objProps types) an objProps, ... opjProps8 containing properties' values in a child objProps objects
maCount (int) : (int) Number of tgtObj's RsMaCalcParams childs of tgtObj to set (1 to 6, starting from 1)
Returns: this
method importConfig(this, oCfg, maCount)
Imports HTF MAs settings from objProps (of any level) into `RsParamsMAs` child `RsMaCalcParams` objects (into the first first `maCount` of them)
Namespace types: RsParamsMAs
Parameters:
this (RsParamsMAs) : (RsParamsMAs) Target object to import prop values to.
oCfg (objProps1 type from moebius1977/CSVParser/1) : (CSVP.objProps) (one of objProps types) an objProps, ... opjProps8 containing properties' values in a child objProps objects
maCount (int) : (int) Number of tgtObj's RsMaCalcParams childs of tgtObj to set (1 to 6, starting from 1)
Returns: this
method importConfig(this, oCfg, maCount)
Imports HTF MAs settings from objProps (of any level) into `RsParamsMAs` child `RsMaCalcParams` objects (into the first first `maCount` of them)
Namespace types: RsParamsMAs
Parameters:
this (RsParamsMAs) : (RsParamsMAs) Target object to import prop values to.
oCfg (objProps2 type from moebius1977/CSVParser/1) : (CSVP.objProps) (one of objProps types) an objProps, ... opjProps8 containing properties' values in a child objProps objects
maCount (int) : (int) Number of tgtObj's RsMaCalcParams childs of tgtObj to set (1 to 6, starting from 1)
Returns: this
method importConfig(this, oCfg, maCount)
Imports HTF MAs settings from objProps (of any level) into `RsParamsMAs` child `RsMaCalcParams` objects (into the first first `maCount` of them)
Namespace types: RsParamsMAs
Parameters:
this (RsParamsMAs) : (RsParamsMAs) Target object to import prop values to.
oCfg (objProps3 type from moebius1977/CSVParser/1) : (CSVP.objProps) (one of objProps types) an objProps, ... opjProps8 containing properties' values in a child objProps objects
maCount (int) : (int) Number of tgtObj's RsMaCalcParams childs of tgtObj to set (1 to 6, starting from 1)
Returns: this
method importConfig(this, oCfg, maCount)
Imports HTF MAs settings from objProps (of any level) into `RsParamsMAs` child `RsMaCalcParams` objects (into the first first `maCount` of them)
Namespace types: RsParamsMAs
Parameters:
this (RsParamsMAs) : (RsParamsMAs) Target object to import prop values to.
oCfg (objProps4 type from moebius1977/CSVParser/1) : (CSVP.objProps) (one of objProps types) an objProps, ... opjProps8 containing properties' values in a child objProps objects
maCount (int) : (int) Number of tgtObj's RsMaCalcParams childs of tgtObj to set (1 to 6, starting from 1)
Returns: this
method importConfig(this, oCfg, maCount)
Imports HTF MAs settings from objProps (of any level) into `RsParamsMAs` child `RsMaCalcParams` objects (into the first first `maCount` of them)
Namespace types: RsParamsMAs
Parameters:
this (RsParamsMAs) : (RsParamsMAs) Target object to import prop values to.
oCfg (objProps5 type from moebius1977/CSVParser/1) : (CSVP.objProps) (one of objProps types) an objProps, ... opjProps8 containing properties' values in a child objProps objects
maCount (int) : (int) Number of tgtObj's RsMaCalcParams childs of tgtObj to set (1 to 6, starting from 1)
Returns: this
method importConfig(this, oCfg, maCount)
Imports HTF MAs settings from objProps (of any level) into `RsParamsMAs` child `RsMaCalcParams` objects (into the first first `maCount` of them)
Namespace types: RsParamsMAs
Parameters:
this (RsParamsMAs) : (RsParamsMAs) Target object to import prop values to.
oCfg (objProps6 type from moebius1977/CSVParser/1) : (CSVP.objProps) (one of objProps types) an objProps, ... opjProps8 containing properties' values in a child objProps objects
maCount (int) : (int) Number of tgtObj's RsMaCalcParams childs of tgtObj to set (1 to 6, starting from 1)
Returns: this
method importConfig(this, oCfg, maCount)
Namespace types: RsParamsMAs
Parameters:
this (RsParamsMAs)
oCfg (objProps7 type from moebius1977/CSVParser/1)
maCount (int)
method importConfig(this, oCfg, maCount)
Imports HTF MAs settings from objProps (of any level) into `HTFMAs` child `MaDrawing` objects (into the first first `maCount` of them)
Namespace types: RsParamsMAs
Parameters:
this (RsParamsMAs) : (HTFMAs) Target object to import prop values to.
oCfg (objProps8 type from moebius1977/CSVParser/1) : (CSVP.objProps) (one of objProps types) an objProps, ... opjProps8 containing properties' values in a child objProps objects
maCount (int) : (int) Number of tgtObj's RsMaCalcParams childs of tgtObj to set (1 to 6, starting from 1)
Returns: this
method importConfig(this, oCfg, maCount)
Imports HTF MAs settings from objProps (of any level) into `HTFMAs` child `MaDrawing` objects (into the first first `maCount` of them)
Namespace types: HTFMAs
Parameters:
this (HTFMAs) : (HTFMAs) Target object to import prop values to.
oCfg (objProps type from moebius1977/CSVParser/1) : (CSVP.objProps) (one of objProps types) an objProps, ... opjProps8 containing properties' values in a child objProps objects
maCount (int) : (int) Number of tgtObj's RsMaCalcParams childs of tgtObj to set (1 to 6, starting from 1)
Returns: this
method importConfig(this, oCfg, maCount)
Imports HTF MAs settings from objProps (of any level) into `HTFMAs` child `MaDrawing` objects (into the first first `maCount` of them)
Namespace types: HTFMAs
Parameters:
this (HTFMAs) : (HTFMAs) Target object to import prop values to.
oCfg (objProps0 type from moebius1977/CSVParser/1) : (CSVP.objProps) (one of objProps types) an objProps, ... opjProps8 containing properties' values in a child objProps objects
maCount (int) : (int) Number of tgtObj's RsMaCalcParams childs of tgtObj to set (1 to 6, starting from 1)
Returns: this
method importConfig(this, oCfg, maCount)
Imports HTF MAs settings from objProps (of any level) into `HTFMAs` child `MaDrawing` objects (into the first first `maCount` of them)
Namespace types: HTFMAs
Parameters:
this (HTFMAs) : (HTFMAs) Target object to import prop values to.
oCfg (objProps1 type from moebius1977/CSVParser/1) : (CSVP.objProps) (one of objProps types) an objProps, ... opjProps8 containing properties' values in a child objProps objects
maCount (int) : (int) Number of tgtObj's RsMaCalcParams childs of tgtObj to set (1 to 6, starting from 1)
Returns: this
method importConfig(this, oCfg, maCount)
Imports HTF MAs settings from objProps (of any level) into `HTFMAs` child `MaDrawing` objects (into the first first `maCount` of them)
Namespace types: HTFMAs
Parameters:
this (HTFMAs) : (HTFMAs) Target object to import prop values to.
oCfg (objProps2 type from moebius1977/CSVParser/1) : (CSVP.objProps) (one of objProps types) an objProps, ... opjProps8 containing properties' values in a child objProps objects
maCount (int) : (int) Number of tgtObj's RsMaCalcParams childs of tgtObj to set (1 to 6, starting from 1)
Returns: this
method importConfig(this, oCfg, maCount)
Imports HTF MAs settings from objProps (of any level) into `HTFMAs` child `MaDrawing` objects (into the first first `maCount` of them)
Namespace types: HTFMAs
Parameters:
this (HTFMAs) : (HTFMAs) Target object to import prop values to.
oCfg (objProps3 type from moebius1977/CSVParser/1) : (CSVP.objProps) (one of objProps types) an objProps, ... opjProps8 containing properties' values in a child objProps objects
maCount (int) : (int) Number of tgtObj's RsMaCalcParams childs of tgtObj to set (1 to 6, starting from 1)
Returns: this
method importConfig(this, oCfg, maCount)
Imports HTF MAs settings from objProps (of any level) into `HTFMAs` child `MaDrawing` objects (into the first first `maCount` of them)
Namespace types: HTFMAs
Parameters:
this (HTFMAs) : (HTFMAs) Target object to import prop values to.
oCfg (objProps4 type from moebius1977/CSVParser/1) : (CSVP.objProps) (one of objProps types) an objProps, ... opjProps8 containing properties' values in a child objProps objects
maCount (int) : (int) Number of tgtObj's RsMaCalcParams childs of tgtObj to set (1 to 6, starting from 1)
Returns: this
method importConfig(this, oCfg, maCount)
Imports HTF MAs settings from objProps (of any level) into `HTFMAs` child `MaDrawing` objects (into the first first `maCount` of them)
Namespace types: HTFMAs
Parameters:
this (HTFMAs) : (HTFMAs) Target object to import prop values to.
oCfg (objProps5 type from moebius1977/CSVParser/1) : (CSVP.objProps) (one of objProps types) an objProps, ... opjProps8 containing properties' values in a child objProps objects
maCount (int) : (int) Number of tgtObj's RsMaCalcParams childs of tgtObj to set (1 to 6, starting from 1)
Returns: this
method importConfig(this, oCfg, maCount)
Imports HTF MAs settings from objProps (of any level) into `HTFMAs` child `MaDrawing` objects (into the first first `maCount` of them)
Namespace types: HTFMAs
Parameters:
this (HTFMAs) : (HTFMAs) Target object to import prop values to.
oCfg (objProps6 type from moebius1977/CSVParser/1) : (CSVP.objProps) (one of objProps types) an objProps, ... opjProps8 containing properties' values in a child objProps objects
maCount (int) : (int) Number of tgtObj's RsMaCalcParams childs of tgtObj to set (1 to 6, starting from 1)
Returns: this
method importConfig(this, oCfg, maCount)
Namespace types: HTFMAs
Parameters:
this (HTFMAs)
oCfg (objProps7 type from moebius1977/CSVParser/1)
maCount (int)
method importConfig(this, oCfg, maCount)
Namespace types: HTFMAs
Parameters:
this (HTFMAs)
oCfg (objProps8 type from moebius1977/CSVParser/1)
maCount (int)
method newRsParamsMAs(this)
Namespace types: LO
Parameters:
this (LO)
method newHTFMAs(this)
Namespace types: LO
Parameters:
this (LO)
RsMaCalcParams
Parameters of one MA (only calculation params needed within req.sec(), visual parameters are within htfMAs type)
Fields:
enabled (series bool)
maType (series MaTypes) : MA type options: SMA / EMA / WMA / ...
src (series string)
prd (series int) : MA period
RsParamsMAs
Collection of parameters of 6 MAs. Used to pass params to req.sec()
Fields:
ma1CalcParams (RsMaCalcParams)
ma2CalcParams (RsMaCalcParams)
ma3CalcParams (RsMaCalcParams)
ma4CalcParams (RsMaCalcParams)
ma5CalcParams (RsMaCalcParams)
ma6CalcParams (RsMaCalcParams)
RsReturnMAs
Used to return data from req.sec().
Fields:
htfBi (series int)
ma1 (series float)
ma2 (series float)
ma3 (series float)
ma4 (series float)
ma5 (series float)
ma6 (series float)
MaDrawing
MA's plot parameters plus drawing objects for MA's current level (line and label).
Fields:
lnClr (series color) : (color) MA plot line color (like in plot())
lnWidth (series int) : (int) MA plot line width (like in plot())
lnStyle (series string) : (string) MA plot line style (like in plot())
showHistory (series bool) : (bool) Whether to plot the MA on historical bars or only show current level to the right of the latest bar.
showLabel (series bool) : (bool) Whether to show the name of the MA to the right of the MA's level
ln (series line) : (line) line to show MA"s current level
lbl (series label) : (label) label showing MA's name
HTFMAs
Contains data and drawing parameters for MA's of one timeframe (MA calculation parameters for MA's of one timeframe are in a separate object RsParamsMAs)
Fields:
rsRet (RsReturnMAs) : (RsReturnMAs) Contains data returned from req.sec(). Is set to na in between HTF bar changes if smoothing is enabled.
rsRetLast (RsReturnMAs) : (RsReturnMAs) Contains a copy of data returned from req.sec() in case rsRet is set to na for smoothing.
rsRetNaObj (RsReturnMAs) : (RsReturnMAs) An empty object as `na` placeholder
ma1Drawing (MaDrawing) : (MaDrawing) MA drawing properties
ma2Drawing (MaDrawing) : (MaDrawing) MA drawing properties
ma3Drawing (MaDrawing) : (MaDrawing) MA drawing properties
ma4Drawing (MaDrawing) : (MaDrawing) MA drawing properties
ma5Drawing (MaDrawing) : (MaDrawing) MA drawing properties
ma6Drawing (MaDrawing) : (MaDrawing) MA drawing properties
enabled (series bool) : (bool ) Enables/disables all of the MAs of one timeframe.
tf (series string) : (string) Timeframe
showHistory (series bool) : (bool ) Plot MA line on historical bars
rngAtrQ (series int) : (int ) A multiplier for atr(14). Determines a range within which the MA's will be plotted. MA's too far away will not be plotted.
showRecentBars (series int) : (int ) Only plot MA on these recent bars
smoothen (series bool) : (bool ) Smoothen MA plot. If false the same HTF value is returned on all chart bars within a HTF bar (intrabars), so the plot looks like steps.
lblsOffset (series int) : (int ) Show MA name this number of bars to the right off last bar.
lblsShow (series bool) : (bool ) Show MA name
lnOffset (series int) : (int ) Start line showing current level of the MA this number of bars to the right off the last bar.
lblSize (series string) : (string) Label size
lblStyle (series string) : (string) Label style
lblTxtAlign (series string) : (string) Label text align
bPopupLabel (series bool) : (bool ) Show current MA value as a tooltip to MA's name.
LO
LO Library object, whose only purpose is to serve as a shorthand for library name in script code.
Fields:
dummy (series string)
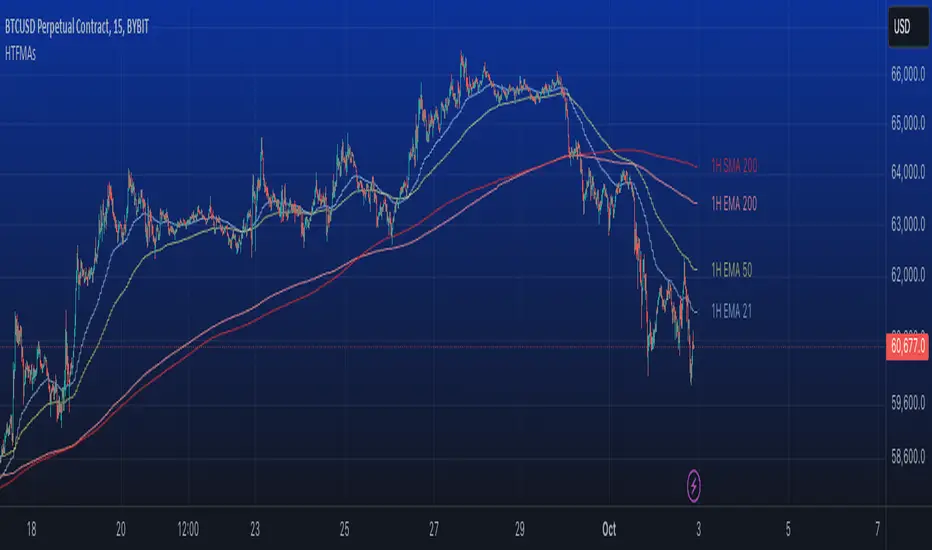
movingAveragesUtilitiesLibrary "movingAveragesUtilities"
get_movingAverages_data(source, length_fast, length_medium, length_slow)
Parameters:
source (float)
length_fast (simple int)
length_medium (simple int)
length_slow (simple int)

gridUtilitiesLibrary "gridUtilities"
TODO: add library description here
get_fibonacciGrid_data(length, trend_direction, plot_grid, plot_labels, bars_to_right, include_levels)
: Gets and plots a fibonacci grid.
Parameters:
length (int) : (int): The direction flag that indicates where the trend is going.
trend_direction (string) : (string): Direction of the trend (Long, Short or Neutral)
plot_grid (bool) : (bool): Plots the fibonacci grid.
plot_labels (bool) : (bool): Plots the datatable.
bars_to_right (int) : (bool): Plots the datatable.
include_levels (bool) : (bool): Plots the datatable.
Returns: : Returns a map with the grid levels, as string with the direction of the grid and a map with the values for the dataTable.

bollingerBandsLibrary "bollingerBands"
Bollinger bands related functions
get_multiple_bollinger_bands(stdv1, stdv2, stdv3, stdv4, stdv5, stdv6, stdv7, length, source)
Parameters:
stdv1 (int)
stdv2 (int)
stdv3 (int)
stdv4 (int)
stdv5 (int)
stdv6 (int)
stdv7 (int)
length (simple int)
source (float)
get_bb_volatility(bb_highest, bb_lowest, ma_length, lookback)
Parameters:
bb_highest (float)
bb_lowest (float)
ma_length (simple int)
lookback (int)

pseudorenko█ CALCULATE PSEUDO-RENKO VALUE
Calculates and returns the Pseudo-Renko Stabilized value (or close price) based on a given input value, along with the direction of the current Renko brick. This function adapts the traditional Renko brick size dynamically based on the volatility of the input value using a combination of SMA and EMA calculations. The calculated price represents the closing price of the most recent Pseudo-Renko brick, while the direction indicates the trend ( 1 for uptrend, -1 for downtrend).
Parameters:
* `val` :
* Type: ` float `
* Description: The input value upon which the Pseudo-Renko calculations are performed. You can use any price series or custom value as input.
* `sensitivity` :
* Type: ` float `
* Default Value: ` 1.0 `
* Description: Controls the sensitivity of the brick size to the volatility of the `val`. Higher values lead to larger bricks, resulting in a smoother Renko chart. Lower values produce smaller bricks, leading to a more reactive chart.
* Possible Values: Any positive float.
* `length` :
* Type: ` int `
* Default Value: ` 7 `
* Description: The length used for calculating the EMA and SMA in the dynamic brick size calculation. It influences how quickly the brick size adapts to changing volatility of the `val`.
* Possible Values: Any positive integer.
Return Values:
* `lastRenkoClose` :
* Type: ` float `
* Description: The closing price of the last completed Pseudo-Renko brick based on the `val`.
* `renkoDirection` :
* Type: ` int `
* Description: The direction of the current Pseudo-Renko brick based on the `val`:
* ` 1 `: Uptrend
* ` -1 `: Downtrend
* ` 0 `: No change (initially, or no brick change since the previous bar)
Example Usage:
//@version=5
indicator("Pseudo-Renko Stabilized (Val)", overlay=true)
// Get user inputs
sensitivityInput = input.float(0.1, "Sensitivity",0.01,step=0.01)
lengthInput = input.int(5, "Length",2)
// Example usage with the 'close' price as the input value
= pseudo_renko(math.avg(close,open), sensitivityInput, lengthInput)
// Plot the Renko close price
plot(renkoClose, "Renko Close", renkoDirection>0?color.aqua:color.orange,2)
// You can also use other values as input, such as:
// = pseudo_renko(high, sensitivityInput, lengthInput)
// = pseudo_renko(low, sensitivityInput, lengthInput)
This example demonstrates how to use the `pseudo_renko` function within an indicator. It takes user inputs for `sensitivity` and `length`, then calculates the Pseudo-Renko values using the average of the `close` and `open` prices as the `val`. The resulting `renkoClose` price is plotted on the chart, with a color change based on the `renkoDirection`. It also illustrates how you can use other values, like `high` and `low`, as input to the function.
Note: The Pseudo-Renko algorithm is based on adapting the Renko brick size dynamically based on the input `val`. This provides more flexibility compared to the normal, but is experimental. The `sensitivity` and `length` parameters, along with the choice of the `val`, offer further customization to tune the algorithm's behavior to your preference and trading style.
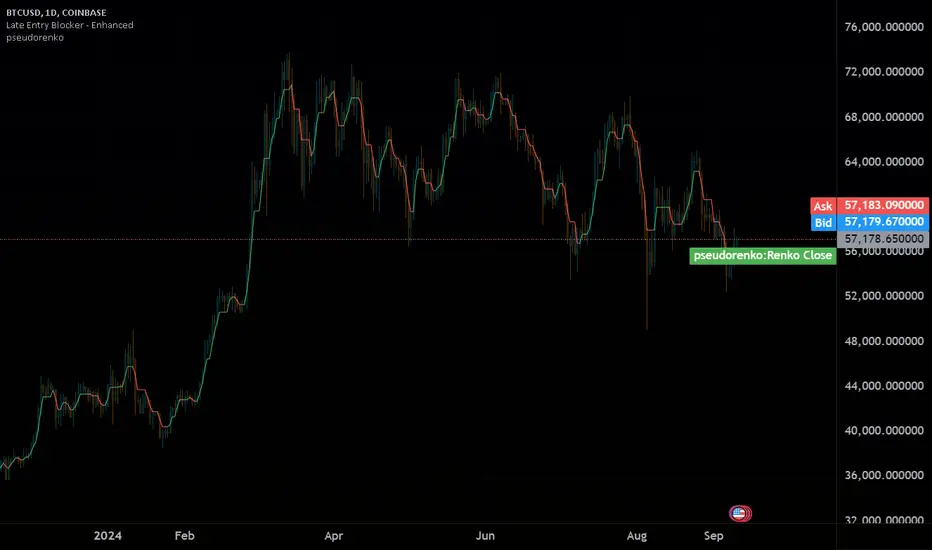
[ALGOA+] Markov Chains Library by @metacamaleoLibrary "MarkovChains"
Markov Chains library by @metacamaleo. Created in 09/08/2024.
This library provides tools to calculate and visualize Markov Chain-based transition matrices and probabilities. This library supports two primary algorithms: a rolling window Markov Chain and a conditional Markov Chain (which operates based on specified conditions). The key concepts used include Markov Chain states, transition matrices, and future state probabilities based on past market conditions or indicators.
Key functions:
- `mc_rw()`: Builds a transition matrix using a rolling window Markov Chain, calculating probabilities based on a fixed length of historical data.
- `mc_cond()`: Builds a conditional Markov Chain transition matrix, calculating probabilities based on the current market condition or indicator state.
Basically, you will just need to use the above functions on your script to default outputs and displays.
Exported UDTs include:
- s_map: An UDT variable used to store a map with dummy states, i.e., if possible states are bullish, bearish, and neutral, and current is bullish, it will be stored
in a map with following keys and values: "bullish", 1; "bearish", 0; and "neutral", 0. You will only use it to customize your own script, otherwise, it´s only for internal use.
- mc_states: This UDT variable stores user inputs, calculations and MC outputs. As the above, you don´t need to use it, but you may get features to customize your own script.
For example, you may use mc.tm to get the transition matrix, or the prob map to customize the display. As you see, functions are all based on mc_states UDT. The s_map UDT is used within mc_states´s s array.
Optional exported functions include:
- `mc_table()`: Displays the transition matrix in a table format on the chart for easy visualization of the probabilities.
- `display_list()`: Displays a map (or array) of string and float/int values in a table format, used for showing transition counts or probabilities.
- `mc_prob()`: Calculates and displays probabilities for a given number of future bars based on the current state in the Markov Chain.
- `mc_all_states_prob()`: Calculates probabilities for all states for future bars, considering all possible transitions.
The above functions may be used to customize your outputs. Use the returned variable mc_states from mc_rw() and mc_cond() to display each of its matrix, maps or arrays using mc_table() (for matrices) and display_list() (for maps and arrays) if you desire to debug or track the calculation process.
See the examples in the end of this script.
Have good trading days!
Best regards,
@metacamaleo
-----------------------------
KEY FUNCTIONS
mc_rw(state, length, states, pred_length, show_table, show_prob, table_position, prob_position, font_size)
Builds the transition matrix for a rolling window Markov Chain.
Parameters:
state (string) : The current state of the market or system.
length (int) : The rolling window size.
states (array) : Array of strings representing the possible states in the Markov Chain.
pred_length (int) : The number of bars to predict into the future.
show_table (bool) : Boolean to show or hide the transition matrix table.
show_prob (bool) : Boolean to show or hide the probability table.
table_position (string) : Position of the transition matrix table on the chart.
prob_position (string) : Position of the probability list on the chart.
font_size (string) : Size of the table font.
Returns: The transition matrix and probabilities for future states.
mc_cond(state, condition, states, pred_length, show_table, show_prob, table_position, prob_position, font_size)
Builds the transition matrix for conditional Markov Chains.
Parameters:
state (string) : The current state of the market or system.
condition (string) : A string representing the condition.
states (array) : Array of strings representing the possible states in the Markov Chain.
pred_length (int) : The number of bars to predict into the future.
show_table (bool) : Boolean to show or hide the transition matrix table.
show_prob (bool) : Boolean to show or hide the probability table.
table_position (string) : Position of the transition matrix table on the chart.
prob_position (string) : Position of the probability list on the chart.
font_size (string) : Size of the table font.
Returns: The transition matrix and probabilities for future states based on the HMM.
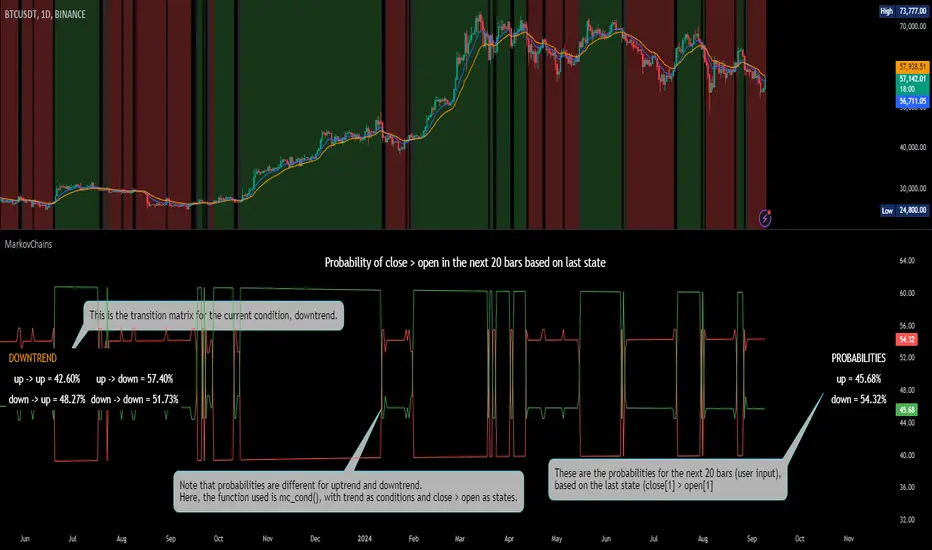
Candlestick_patternsLibrary "CandlestickepatternsClase3"
TODO: add library description here
bullish_engulfing()
bearish_engulfing()
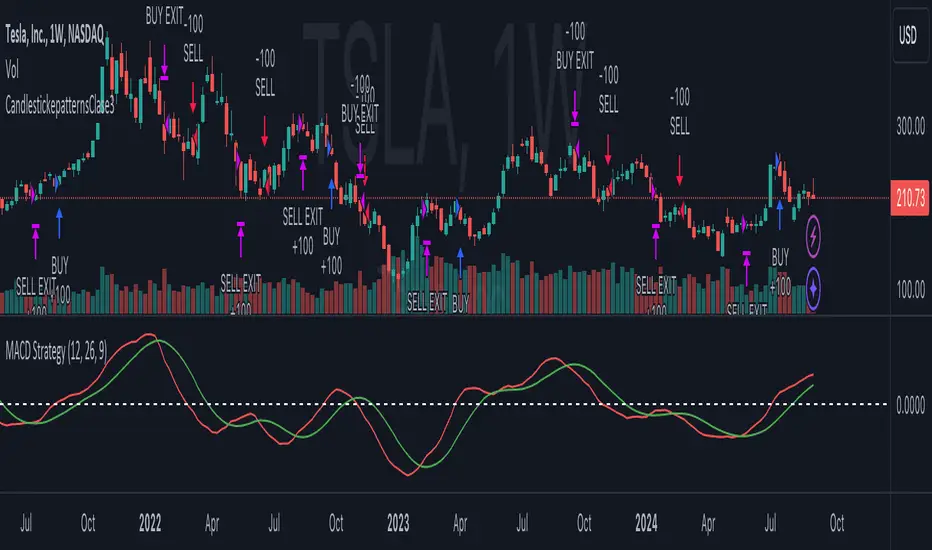
WavesLibrary "Waves"
Methods for elliot wave detection
method delete(this)
deletes the subwave drawing
Namespace types: Subwave
Parameters:
this (Subwave) : Subwave object to be deleted
Returns: deleted subwave object
method delete(this)
deletes the wave drawing and the corresponding subwaves
Namespace types: Wave
Parameters:
this (Wave) : Wave object to be deleted
Returns: deleted wave object
method createWave(pivot, lineColor, waves, limit)
Create wave object
Namespace types: zg.Pivot
Parameters:
pivot (Pivot type from Trendoscope/Zigzag/7) : pivot object where the wave needs to be created
lineColor (color) : color of the wave to be drawn
waves (array) : array of existing waves
limit (int) : max number of waves to be shown in the chart
Returns: wave object created
method createSubWaves(wave, subwavePivots)
Create sub waves for the wave
Namespace types: Wave
Parameters:
wave (Wave)
subwavePivots (array) : array of sub wave pivots
Returns: wave object created
method draw(subWave)
Draw subwave
Namespace types: Subwave
Parameters:
subWave (Subwave)
Returns: subwsubWave object
method draw(wave, limitSubwaves)
Draw Wave
Namespace types: Wave
Parameters:
wave (Wave) : Wave object to be drawn
limitSubwaves (bool) : limit the number of subwave combinations within the wave
Returns: wave object
method checkMotiveWave(prices)
based on the price array, check if there is motive wave and identify the type
Namespace types: array
Parameters:
prices (array) : float array of prices
Returns: WaveType representing the identified wave type. na otherwise
method scanMotiveWave(pivot, lastPivot, existingWaves, allowedTypes)
Scan for motive wave
Namespace types: zg.Pivot
Parameters:
pivot (Pivot type from Trendoscope/Zigzag/7) : Zigzag pivot that will be checked for motive wave
lastPivot (Pivot type from Trendoscope/Zigzag/7) : previous Zigzag pivot
existingWaves (array) : array of existing waves
allowedTypes (array) : allowed Wave types to filter them
Returns: array of subwave pivots
SubwavePivots
SubwavePivots represents the sub pivots of the main wave
Fields:
waveType (series WaveType) : Type of the Wave
indices (array) : Bar index values of sub waves
subPivots (array type from Trendoscope/Zigzag/7) : sub pivot objects of the wave
Subwave
Subwave represents the drawing of sub waves
Fields:
waves (array type from Trendoscope/Drawing/1) : array of sub wave lines
points (array type from Trendoscope/Drawing/1) : Array of subwave pivot labels
subwavePivots (SubwavePivots) : array of subwave pivots being drawn
Wave
Wave object type
Fields:
pivot (Pivot type from Trendoscope/Zigzag/7) : starting point of the wave
wave (Line type from Trendoscope/Drawing/1) : Line representing the wave
waveLabel (Label type from Trendoscope/Drawing/1) : label containing wave details
subWaves (array) : array of sub waves
lib_no_delayLibrary "lib_no_delay"
This library contains modifications to standard functions that return na before reaching the bar of their 'length' parameter.
That is because they do not compromise speed at current time for correct results in the past. This is good for live trading in short timeframes but killing applications on Monthly / Weekly timeframes if instruments, like in crypto, do not have extensive history (why would you even trade the monthly on a meme coin ... not my decision).
Also, some functions rely on source (value at previous bar), which is not available on bar 1 and therefore cascading to a na value up to the last bar ... which in turn leads to a non displaying indicator and waste of time debugging this)
Anyway ... there you go, let me know if I should add more functions.
sma(source, length)
Parameters:
source (float) : Series of values to process.
length (simple int) : Number of bars (length).
Returns: Simple moving average of source for length bars back.
ema(source, length)
Parameters:
source (float) : Series of values to process.
length (simple int) : Number of bars (length).
Returns: (float) The exponentially weighted moving average of the source.
rma(source, length)
Parameters:
source (float) : Series of values to process.
length (simple int) : Number of bars (length).
Returns: Exponential moving average of source with alpha = 1 / length.
atr(length)
Function atr (average true range) returns the RMA of true range. True range is max(high - low, abs(high - close ), abs(low - close )). This adapted version extends ta.atr to start without delay at first bar and deliver usable data instead of na by averaging ta.tr(true) via manual SMA.
Parameters:
length (simple int) : Number of bars back (length).
Returns: Average true range.
rsi(source, length)
Relative strength index. It is calculated using the ta.rma() of upward and downward changes of source over the last length bars. This adapted version extends ta.rsi to start without delay at first bar and deliver usable data instead of na.
Parameters:
source (float) : Series of values to process.
length (simple int) : Number of bars back (length).
Returns: Relative Strength Index.

DynamicRSILibrary "DynamicRSI"
The "DynamicRSI" library provides a method to calculate a Dynamic Relative Strength Index (RSI) that adjusts its sensitivity based on market volatility. By combining short and long RSI periods with a weighted average influenced by the market's volatility, this library allows users to obtain a more responsive RSI tailored to changing market conditions.
"DynamicRSI" 라이브러리는 시장 변동성에 따라 감도를 조정하는 동적 상대 강도 지수(RSI)를 계산하는 방법을 제공합니다. 짧은 RSI와 긴 RSI 기간을 시장 변동성에 따라 가중 평균하여 결합함으로써, 이 라이브러리는 시장 상황에 맞게 보다 유연하게 반응하는 RSI를 제공합니다.
Function: drsi(src, minLength, maxLength, volatilityPeriod)
함수: drsi(src, minLength, maxLength, volatilityPeriod)
Parameters:
src (float)
The source data to calculate the RSI (e.g., close price). This is the price data that the RSI is calculated on.
RSI를 계산하기 위한 입력 데이터입니다(예: 종가(close) ). 이 값은 RSI를 계산하는 기준이 되는 가격 데이터입니다.
minLength (simple int)
The period for the shorter RSI. This parameter controls the sensitivity of the RSI, with a shorter period making the RSI more reactive to price changes.
짧은 RSI 기간입니다. 이 매개변수는 RSI의 감도를 제어하며, 더 짧은 기간은 RSI가 가격 변화에 더 민감하게 반응하게 합니다.
maxLength (simple int)
The period for the longer RSI. This parameter provides a smoother RSI, which is less sensitive to short-term price fluctuations.
긴 RSI 기간입니다. 이 매개변수는 더 부드러운 RSI를 제공하며, 단기적인 가격 변동에 덜 민감하게 반응합니다.
volatilityPeriod (simple int)
The period used for calculating the Average True Range (ATR) to measure market volatility. This volatility is then used to adjust the weighting between the short and long RSI, making the final Dynamic RSI more adaptive to market conditions.
시장 변동성을 측정하기 위해 평균 진정 범위(ATR)를 계산하는 기간입니다. 이 변동성을 기반으로 짧은 RSI와 긴 RSI 간의 가중치를 조정하여 최종 Dynamic RSI가 시장 상황에 더 잘 적응할 수 있도록 합니다.
Description:
The drsi function calculates a Dynamic RSI by weighting the short-term and long-term RSI values according to the current market volatility. The function uses the ATR to determine the market's volatility, applying more weight to the short-term RSI when volatility is high and more weight to the long-term RSI when volatility is low. This approach ensures that the RSI is more responsive during volatile periods and smoother during stable periods, providing traders with a more effective tool for identifying overbought and oversold conditions in varying market environments.
drsi 함수는 현재 시장 변동성에 따라 단기와 장기의 RSI 값을 가중치로 조정하여 Dynamic RSI를 계산합니다. 이 함수는 시장의 변동성을 판단하기 위해 ATR을 사용하며, 변동성이 높을 때는 단기 RSI에 더 많은 가중치를 적용하고, 변동성이 낮을 때는 장기 RSI에 더 많은 가중치를 적용합니다. 이 접근 방식은 변동성이 큰 기간 동안 RSI가 더 민감하게 반응하고, 안정적인 기간 동안 더 부드럽게 반응하도록 하여, 다양한 시장 환경에서 과매수 및 과매도 상태를 식별하는 데 보다 효과적인 도구를 제공합니다.
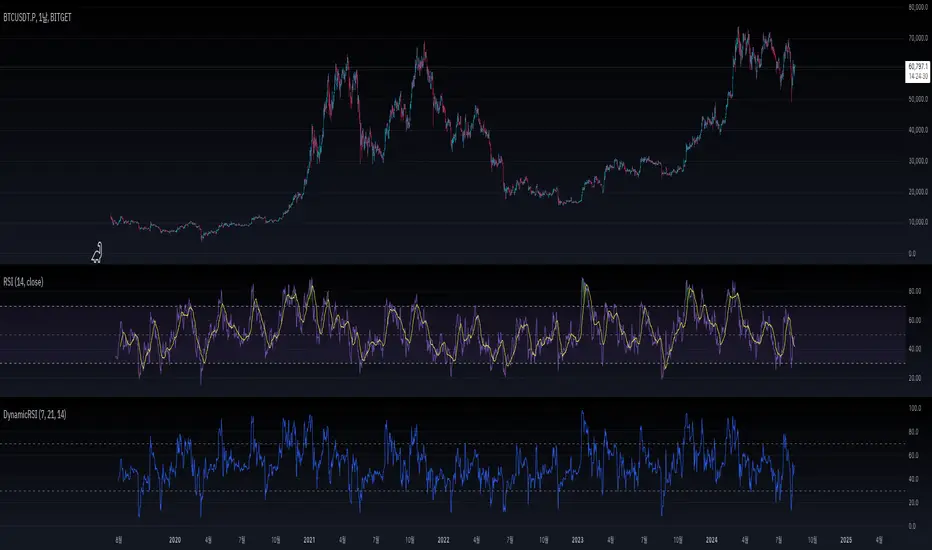
Order Block Overlapping Drawing [TradingFinder]🔵 Introduction
Technical analysis is a fundamental tool in financial markets, helping traders identify key areas on price charts to make informed trading decisions. The ICT (Inner Circle Trader) style, developed by Michael Huddleston, is one of the most advanced methods in this field.
It enables traders to precisely identify and exploit critical zones such as Order Blocks, Breaker Blocks, Fair Value Gaps (FVGs), and Inversion Fair Value Gaps (IFVGs).
To streamline and simplify the use of these key areas, a library has been developed in Pine Script, the scripting language for the TradingView platform. This library allows you to automatically detect overlapping zones between Order Blocks and other similar areas, and visually display them on your chart.
This tool is particularly useful for creating indicators like Balanced Price Range (BPR) and ICT Unicorn Model.
🔵 How to Use
This section explains how to use the Pine Script library. This library assists you in easily identifying and analyzing overlapping areas between Order Blocks and other zones, such as Breaker Blocks and Fair Value Gaps.
To add "Order Block Overlapping Drawing", you must first add the following code to your script.
import TFlab/OrderBlockOverlappingDrawing/1
🟣 Inputs
The library includes the "OBOverlappingDrawing" function, which you can use to detect and display overlapping zones. This function identifies and draws overlapping zones based on the Order Block type, trigger conditions, previous and current prices, and other relevant parameters.
🟣 Parameters
OBOverlappingDrawing(OBType , TriggerConditionOrigin, distalPrice_Pre, proximalPrice_Pre , distalPrice_Curr, proximalPrice_Curr, Index_Curr , OBValidGlobal, OBValidDis, MitigationLvL, ShowAll, Show, ColorZone) =>
OBType (string)
TriggerConditionOrigin (bool)
distalPrice_Pre (float)
proximalPrice_Pre (float)
distalPrice_Curr (float)
proximalPrice_Curr (float)
Index_Curr (int)
OBValidGlobal (bool)
OBValidDis (int)
MitigationLvL (string)
ShowAll (bool)
Show (bool)
ColorZone (color)
In this example, various parameters are defined to detect overlapping zones and draw them on the chart. Based on these settings, the overlapping areas will be automatically drawn on the chart.
OBType : All order blocks are summarized into two types: "Supply" and "Demand." You should input your Current order block type in this parameter. Enter "Demand" for drawing demand zones and "Supply" for drawing supply zones.
TriggerConditionOrigin : Input the condition under which you want the Current order block to be drawn in this parameter.
distalPrice_Pre : Generally, if each zone is formed by two lines, the farthest line from the price is termed Pervious "Distal." This input receives the price of the "Distal" line.
proximalPrice_Pre : Generally, if each zone is formed by two lines, the nearest line to the price is termed Previous "Proximal" line.
distalPrice_Curr : Generally, if each zone is formed by two lines, the farthest line from the price is termed Current "Distal." This input receives the price of the "Distal" line.
proximalPrice_Curr : Generally, if each zone is formed by two lines, the nearest line to the price is termed Current "Proximal" line.
Index_Curr : This input receives the value of the "bar_index" at the beginning of the order block. You should store the "bar_index" value at the occurrence of the condition for the Current order block to be drawn and input it here.
OBValidGlobal : This parameter is a boolean in which you can enter the condition that you want to execute to stop drawing the block order. If you do not have a special condition, you should set it to True.
OBValidDis : Order blocks continue to be drawn until a new order block is drawn or the order block is "Mitigate." You can specify how many candles after their initiation order blocks should continue. If you want no limitation, enter the number 4998.
MitigationLvL : This parameter is a string. Its inputs are one of "Proximal", "Distal" or "50 % OB" modes, which you can enter according to your needs. The "50 % OB" line is the middle line between distal and proximal.
ShowAll : This is a boolean parameter, if it is "true" the entire order of blocks will be displayed, and if it is "false" only the last block order will be displayed.
Show : You may need to manage whether to display or hide order blocks. When this input is "On", order blocks are displayed, and when it's "Off", order blocks are not displayed.
ColorZone : You can input your preferred color for drawing order blocks.
🟣 Output
Mitigation Alerts : This library allows you to leverage Mitigation Alerts to detect specific conditions that could lead to trend reversals. These alerts help you react promptly in your trades, ensuring better management of market shifts.
🔵 Conclusion
The Pine Script library provided is a powerful tool for technical analysis, especially in the ICT style. It enables you to detect overlapping zones between Order Blocks and other significant areas like Breaker Blocks and Fair Value Gaps, improving your trading strategies. By utilizing this tool, you can perform more precise analysis and manage risks effectively in your trades.
