N.White_For_H4_TESTI use this Test version to determine price movement for a longer period, in the next versions Long / short signals will be added. Includes drawing support and resistance lines, Bollinger bands.
Wsparcie i Opór
N.White_ScalpM15TestThis test version of the strategy is designed for scalping on the timeframe M15. It includes drawing support and resistance lines, a bollinger band.

N.White_ScalpM5TESTThis test version of the strategy is designed for scalping on the timeframe M5. It includes drawing support and resistance lines, a bollinger band.
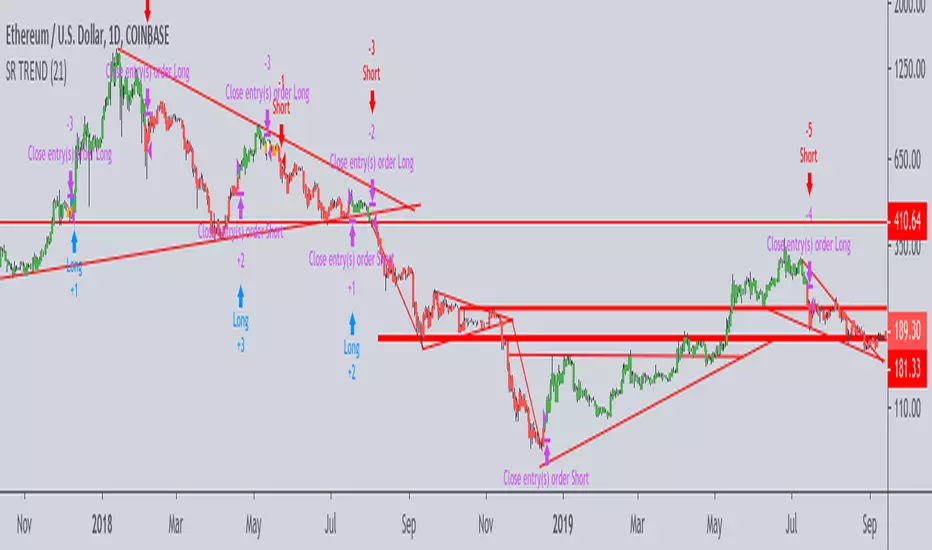
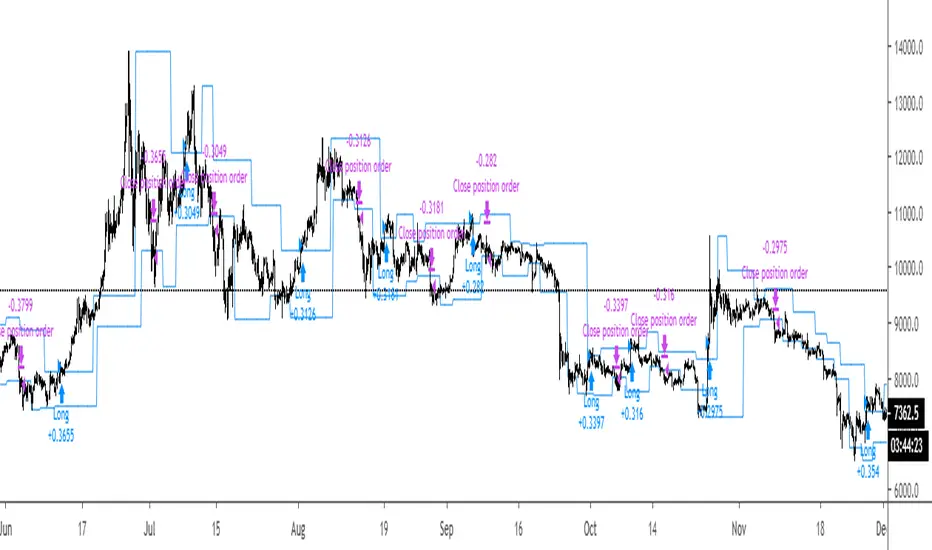
TFs Pivot Reversal StrategyThe Pivot Reversal strategy script uses pivot points to create a support and resistance level; based on this levels the strategy creates virtual stop-market orders to catch the trend if the price is crossing the pivot lines.
A configurable trailing-stop and stop-loss is being used to exit an open position.
How to use
The strategy works with all timeframes; the current chart setting is using a 15min timeframe. The strategy enters about 10 trades per day, depending on the used settings.
I'm also providing a "study" version of this strategy, which can be used to automate the strategy by using webhooks for instance.
The script is using a default commission of 0.075% which reflects Bitmex' Taker-Fees. This is just a default and can be modified in the strategy settings for each instrument individually.
How to access
This strategy is a "Invite Only" script. You can can subscribe or purchase the strategy ; please use the link below or send me a message via Tradingview to obtain access to the strategy and study script.
For enabling the script in your Tradingview chart window, click on "Indicators" and select "Invite-Only Scripts".
Full list of parameters:
"Pivot Left Bars" ... Number of bars on the left of the pivot point - used for pivot/peak detection
"Pivot Right Bars" ... Number of bars on the right of the pivot point - used for pivot/peak detection
"Entry Offset " ... Entry price offset after crossing pivot line (in %)
"Trailing Activation Level " ... Trailing stop activation level above/below average price (in %)
"Trailing Offset " ... Trailing stop price (in %)
"Stop Loss " ... Absolute stop-loss (in %)
"Capital Risk Factor " ... Capital risk factor (in %)
"Margin / Leverage " ... Optional leverage factor which can be used to leverage position (in %)
"Backtest ..." ... Backtest timeframe; area outside this timeframe will be grayed out
I'm looking forward to any feedback, reviews or change requests!

[fikira] Fibma/Fibema StrategyMy strategy regarding the Fibma/Fibema lines (also see my Fibma/Fibema study)
You can enable/disable each strategy to see what
works best in what timeframe
Thanks!
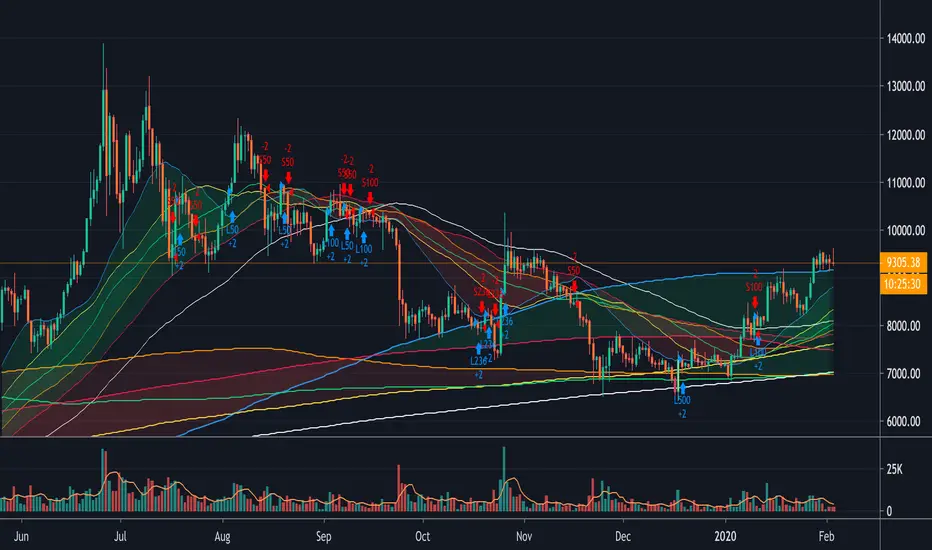

[astropark] Ichimoku Cloud StrategyDear Followers,
today a Great Swing Trading Strategy , runnable on a bot , which works great on High Timeframes (1D is suggested!) but also even better on 1m Renko chart.
If you are a scalper, you will love suggested entries for fast profit. You can run it on 1h timeframe (below is not suggested) if you are used to scalp trading and close each trade whenever you feel happy (a proper trailing stop strategy is suggested anyway).
This strategy is based on the Ichimoku Cloud Indicator and let's you set a lot of settings:
works on all timeframes (but 1D and above is suggested on normal candlesticks chart)
you can run this indicator on 1m Renko chart (be sure to enable the "USING RENKO CHART? ENABLE THIS OPTION" setting)
you can use 4 kind of Ichimoku Cloud (Custom, Slow, Standard and Fast - keep only one enabled)
you can make the Ichimoku Cloud show or not
you can enable showing the possibile re-entries
you can enable an heiking ashi analysis
you can enable a trailing stop strategy ("Auto Trailing Stop Loss" and "Close Trade When Price Breaks Above the Ichimoku Cloud" are two options very much suggested to keep enabled, especially on bot trading)
you can create your own trailing stop stategy and take profit strategy
you can enable a simple take profit strategy based on RSI Overbought and Oversold levels
This strategy only trigger 1 buy or 1 sell, but if you missed the possibility to open your long or short position don't get mad, but just enable the "show re-entry signals" option, so yout will be able to enter again (be sure to always use a proper money management ).
By the way, you can set any alarms you like in order to get notified when any kind of signal is triggered (you need to use the "alarms" version for this).
Strategy results are calculated on the timeframe from January 2016 to now, so on 3 years, using 10000$ as initial capital, doing only 6 trades (great swings!) and working at 1x leverage (so no leverage at all! perfect spot trading style!). If you like to use leverage, be sure tp use a safe option, like 3x or 5x at most in order to have liquidation price very far).
This is not the "Holy Grail", so use a proper risk management strategy.
This script will let you backtest how the indicator will perform on any chart you may test. Of course results will be very different depending on the chart you will open. I tested a lot of charts and always you can find a combination that keep this strategy in profit on swing trading style (and this means that if you can have a daily look at the chart you can always manage to maximize your profit on each trade!
The alarms version of this indicator, which will let you set all notifications you may need in order to be alerted on each triggered signals, can be found by searching for "astropark Ichimoku Cloud Strategy" and then choosing the "astropark" indicator with "alarms" suffix in the name.
This is a premium indicator , so send me a private message in order to get access to this script.

Trend Following or Mean RevertingThe strategy checks nature of the instruments. It Buys if the close is greater than yesterday's high, reverse the position if the close is lower than yesterday's low and repeat the process.
1. If it is trend following then the equity curve will be in uptrend
2. If it is mean reverting then the equity curve will be downtrend
Thanks to Rayner Teo.

Breakout Strategy #1Breakout above previous pivot points trigger a long. Close below pivot lows trigger the exit.
Most effective during trends.
TFs I Love Mondays V1The strategy calculates highs and lows of the previous week, and uses them as resistance and support lines. If crossing such resistance/support lines, the strategy enters a long or short position, and exists an open position with predefined profit-targets and a stop-loss.

Donchian Breakout StrategyThis strategy buys when the Donchian Channel is broken to the upside and uses the lower Donchian Channel line as a trailing stop. You can also choose to use a moving average as a filter to keep you out of trades that are counter trend.
You can also configure which dates you want to backtest, so you can see how this behaves over specific time frames and market cycles.

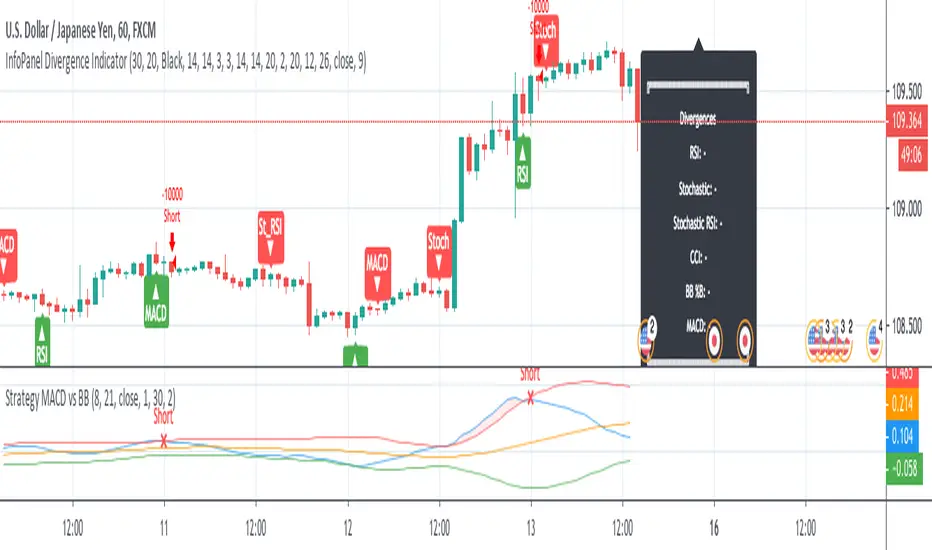
Strategy MACD vs BBStrategy based on MACD and Bollinger Bands, where BBs are calculatend from macd signal.
Strategy doesn't open at breakout of bands but it waits for a pullback.
Upper and lower bands are used as resistance and support.
There are various parameters that can be optimized.
I have also a study with alerts.
Please use comment section for any feedback or cointact me if you need support.
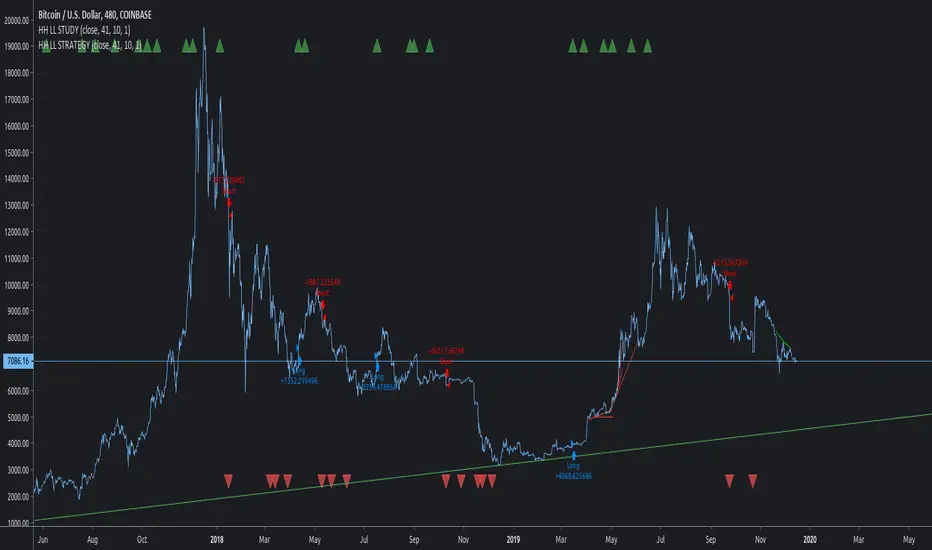
HIGHER HIGH LOWER LOW STRATEGYThis is my favorite for Tradingview.
Please use other indicators to find good entry and good exit. This is why this publication has so many indicators. A good indicator will find good results even on line chart. Feel free to try on "Heiken Ashi" but understand that "line" chart is much more realistic
Due to tradingview's crappy auto resize, the best way to view this script is to click on the share button and "Make it Mine".
Then you can see why my other indicators are "PRESENT"
Cheers!!!
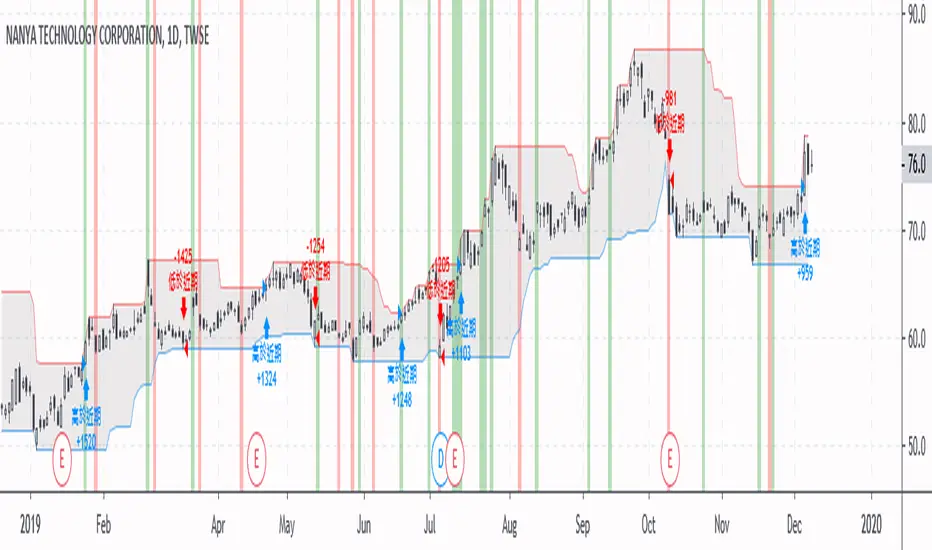
[LunaOwl] 樂活投資:價格通道 (LOHAS Investor - PriceChannel)- Introduction -
Price channel is an ancient strategy, which is very convenient for office workers. since most people no time do it.
so they are suitable for simple strategies. There are several conditions to become a "LOHAS Investor" -
價格通道是很老的投資策略,對於肯做功課的上班族來說非常方便,而且多數人沒時間操作。
如果要當「樂活投資人」有幾點條件:
1) set moderate ROI expectations.
- 設定溫和的投資報酬率期望。
2) use appropriate stock selection methods to build portfolios and reduce single error rates.
- 使用適當的選股方式建立投資組合,減少單一股票失誤率。
3) simple trade strategy, executed regularly.
- 使用簡單的策略規律執行。
4) wealth accumulates over time and learns every day.
- 財富依靠時間積累,每天勤學新知。
SAMURAI SWORDSamurai Sword is an add on tool for Ninja Scalper and the next evolution of the Trend Trade Indicator.
It auto plots the fib retracement to speed up target acquisition support and resistance areas based on the formula to increase the success rate of trade entry and exits.
None of this is to be taken as investment advice but rather Edutainment and infotainment
#TradeSocially

Cyatophilum Ultimate Trading Bot [BACKTEST]Private Indicator.
This is an indicator for trading low timeframes . It is generic and configurable meaning you can use it not only on crypto, but also forex, CFD, stocks etc.
HOW IT WORKS
The user chooses between three powerful base strategies: Bollinger Bands + Stoch RSI, RSI Divergences or the SARMA Strategy .
He can also trade support and resistance breakouts , with or without the base strategy.
Use the Alert Setup version to trigger entry and exit alerts .
You can choose between a set of trend lines that will filter trades that are against the main trend in order to increase profitability.
The integrated Trailing Stop Loss will trigger an alert to exit the trade.
You can use the Trailing Take Profit with a configurable % deviation. It will also trigger an exit alert.
SAMPLE USE CASES
XBTUSD 5m BitMEX
XBTUSD 15m BitMEX
ETHUSD 5m BitMEX
ETHUSD 15m BitMEX
USD/WTI 1m IDC (Us Dollar/ WTI Crude OIL)
Backtest below for BITMEX:LTCZ19 in 15m timeframe.
To get access to the indicator, use the link below, thanks for reading!

Bybit SHORT ETHUSD SCALPER - M15ETHUSD ByBit Scalping System detects trends. System opens only SHORT positions on 15 Minute Timeframe only.
Dont use it on any other coins or any other timeframes or any other direction.
Coin : ETHUSD
Exchange : ByBit
Direction : Short
Timeframe : M15
This System is developed for our institutional client who may further retail it.

Bybit SHORT XRPUSD M15 LOW RISKXRPUSD ByBit Scalping System detects trends. System opens only SHORT positions on 15 Minute Timeframe only.
Dont use it on any other coins or any other timeframes or any other direction.
Coin : XRPUSD
Exchange : ByBit
Direction : Short
Timeframe : M15
This System is developed for our institutional client who may further retail it.

Bybit SHORT EOSUSD M15 LOW RISKTrading Room Scalping System automatically detects trends & breakouts. System opens only SHORT positions on 15 Minute Timeframe only. Dont use it on any other coins or any other timeframes or any other direction.
Coin : EOSUSD
Exchange : ByBit
Direction : Short
Timeframe : M15

Turtle trading strategy (Donchian/ATR)Strategy based on Turtle Trading Strategy from William Eckhardt and Richard Dennis
- Considers entering trades on breakout of Donchian channels (upper for long, lower for short) (Default length = 20 for daily)
- Considers exiting trades on breakout of Donchian channels (lower for long, upper for short) with lower length (10 for daily)
- Uses 2N ATR (default) as stop loss

Arrows 1.0Version 1.0
This script uses cycle values to create arrow triggers for support/restiance strategy

Support-Resistance breakoutStrategy based on longing resistance breakout and shorting support breakout.
It defines highs and lows using fractal with 2 bars for confirming high/lows. So it has 2 bars lag.
It calculates the difference between sma with defined length (21 by default) of highs and of lows and uses it as alt SR level. This idea I took from synapticEx's indicator Nebula-Advanced-Dynamic-Support-Resistance.
Position enter is the breakout of SR, defined by fractals.
Position exit is: bar change in opposite to position direction > difference is sma of highs and of lows.