StochRSI RangeIndicator for getting StochRSI reading while looking at RSI. White background plots RSI lows and highs over lookback period. (14 is the default) Both lines are smoothed like original RSI.Wskaźnik Pine Script®od stuehmer4455
Zero Cross Buy/SellThis is an oscillator. Buy on zero cross from below. Sell on zero cross from above. It prevents risky buys when price is too high and too low. It is capable of recognizing long bear runs to prevent you prom buying Best used with Bollinger Bands. Based on RSI and Stochastic RSIWskaźnik Pine Script®od umur.ozkulZaktualizowano 11125
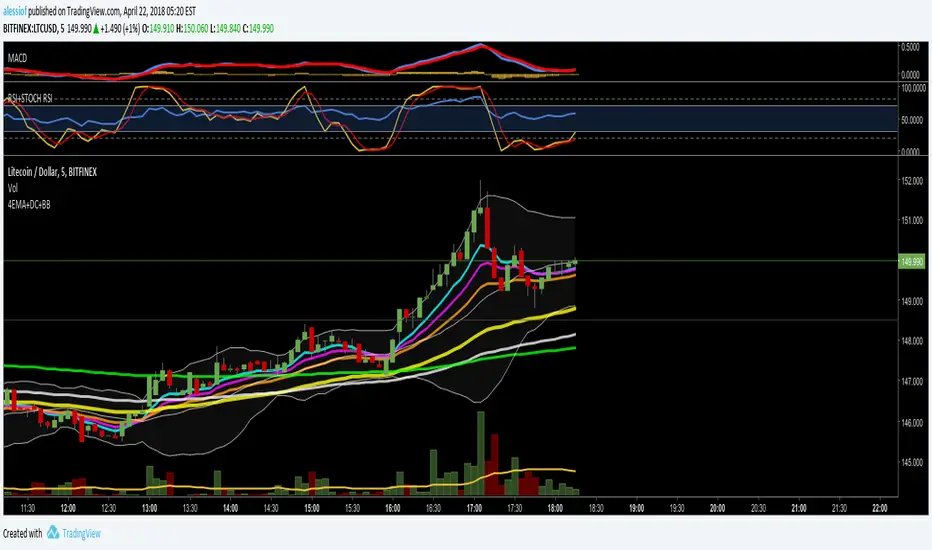
RSI + STOCH RSI OVERLAY by AlessiofRSI and Stochastic RSI in one. Standard settings. Check out my other script for 4EMA + Death Cross + Bollinger Bands all in one. Wskaźnik Pine Script®od a1234567890aaaZaktualizowano 1180
hTU Stochastic RSIThe default Stoch RSI with shading added to highlight when it is at 0 or 100Wskaźnik Pine Script®od h00ch7131
MG - Multiple time frame Stochastic RSIAdded option to add third time frameWskaźnik Pine Script®od mgibson914496
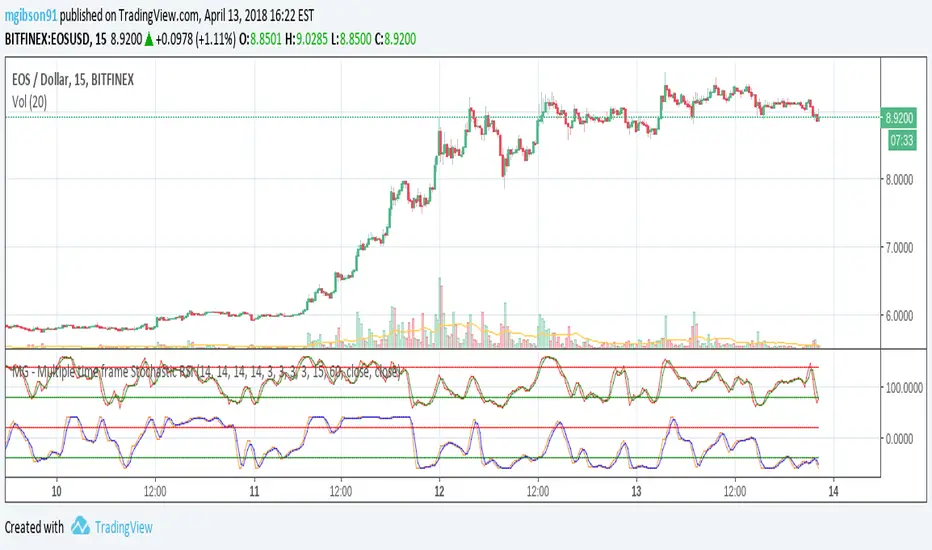
MG - Multiple time frame Stochastic RSIAllows user to view stochastic RSI from two different time frames. Each stochastic RSI indicator is fully customizable, offering the following options: - Timeframe - RSI source - RSI length - Stochastic length - Stochastic average length - Stochastic smoothing length Usage: Comparing stochastic RSI across two different time frames can sharpen trades. For example, if you configure a 60 min and 5/15 min stochastic RSI pair, you might enter a long trade when the 60 min stoch RSI crosses up and exit / take profit when the 5 min stock RSI crosses down.Wskaźnik Pine Script®od mgibson91Zaktualizowano 11209
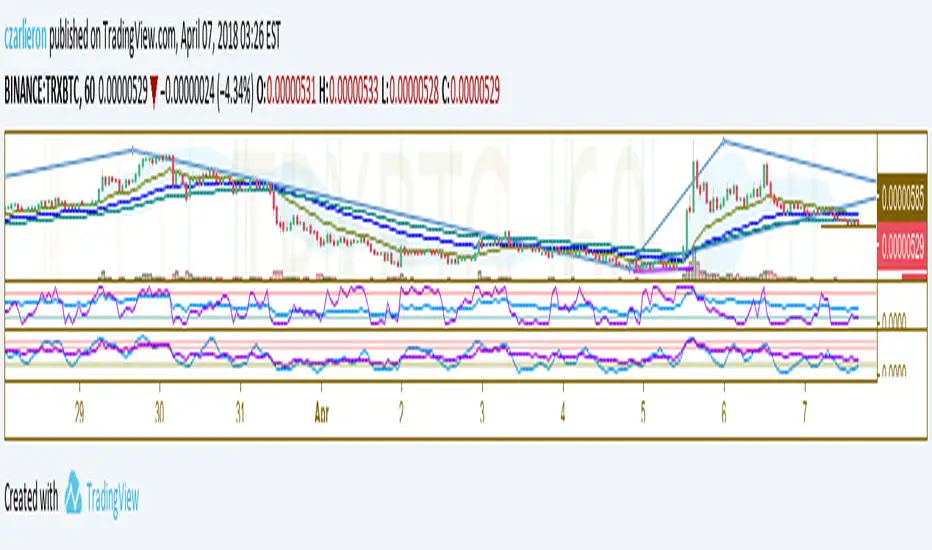
Relative Strength Index with StochRSIJust a combination of RSI and StochRSIWskaźnik Pine Script®od czarlieron18
RSI Combo (RSI, StochRSI)RSI and StochRSI combination with color fill histogram if RSI is over 70 or below 30.Wskaźnik Pine Script®od ColtHandsZaktualizowano 44266
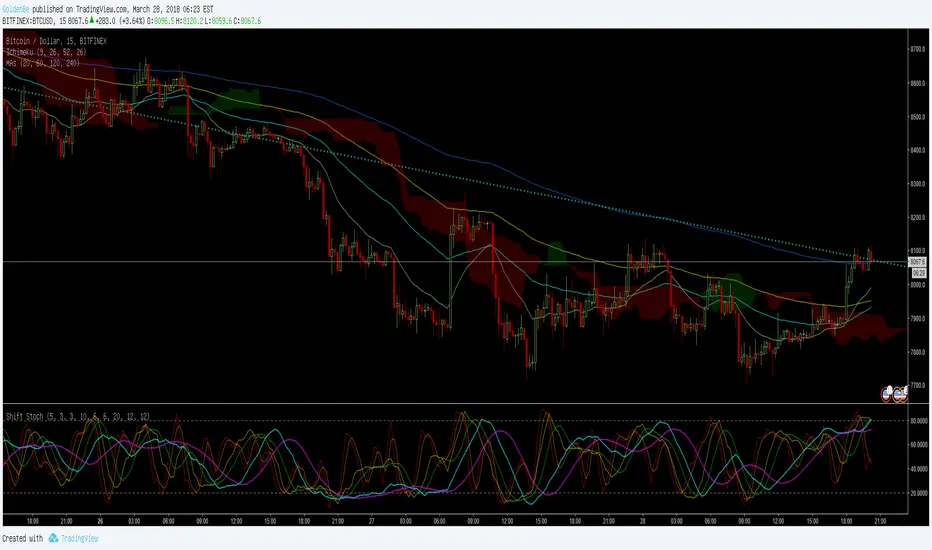
ShiftPower StochasticThis indicator is a combination of the following three slow stochastics commonly used. ⓐ 5 - 3 - 3 ⓑ 10 - 6 - 6 ⓒ 20 - 12 - 12 ( n - %k - %d ) I hope it helps. Thanks. <한국어> 일반적으로 많이 사용하는 다음 3개의 슬로우 스토케스틱을 하나로 합친 지표입니다. ⓐ 5 - 3 - 3 ⓑ 10 - 6 - 6 ⓒ 20 - 12 - 12 ( n - %k - %d ) 도움이 됐으면 좋겠습니다. 감사합니다.Wskaźnik Pine Script®od GoldenBe83
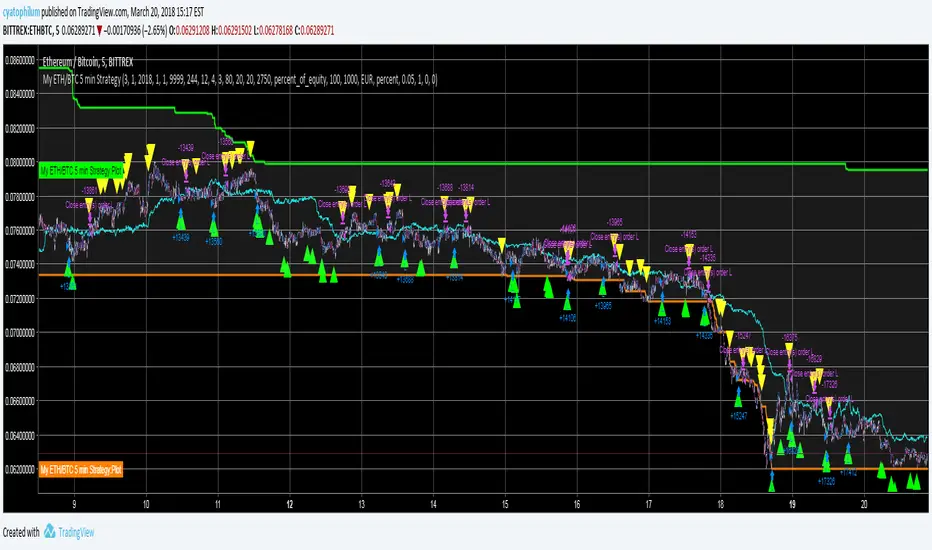
My ETH/BTC 5 min StrategyHello, beginner in trading here. Use this at your own risk. Commission : 0.05% Time Unit : 5 min Backtest range : 15 days (looking like that is the maximum in 5 min UT) Initial capital : 1000€ How it works : Long entries and exits. That's all, no pyramiding, no shorting. It takes the first buy signal (green triangle) and the first sell signal (yellow triangle) The idea is to scalp while in range using stochastic, and to get out / in when a big trend appears (that is what the tunnel is for). See the code for details. I think those are pretty good result when we look at hueg negative buy and hold returns of this month of March. What do you think?Strategia Pine Script®od cyatophilum66360
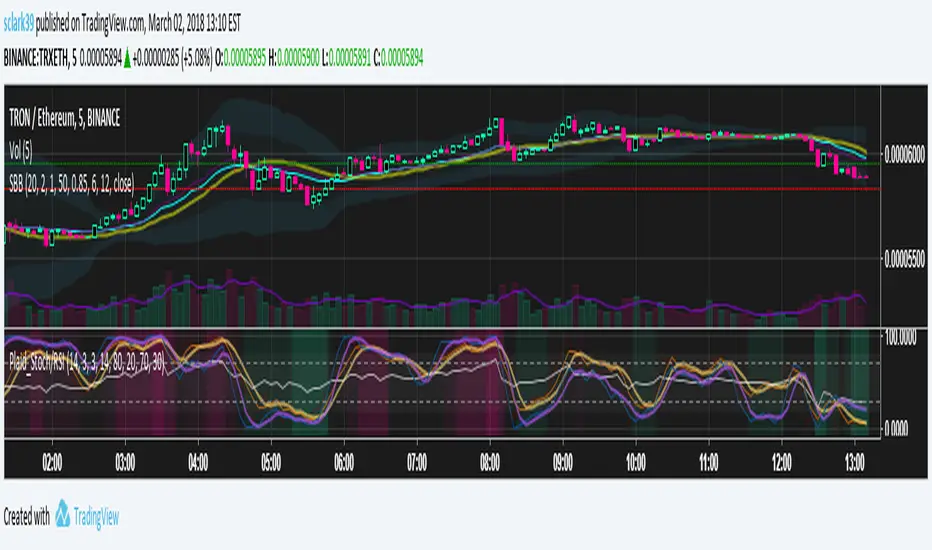
Plaid Stochastic / RSI Triple Combo Indicator [sclark39]Welcome to my "Plaid" Stochastic / RSI / StochRSI Combo indicator. This shows the Fast and Slow Stochastic (orange and yellow), Relative Strength Index (white), and the Stochastic RSI (purple). As the lines cross the 80/20 and 70/30 lines, the background color changes to make it easy to see at a glance how many of the indicators have crossed their threshold. In the options you can change the period lengths and hide/show each of type of indicator to best fit your trading style. Use this indicator for trades at your own risk, I made this for fun and it is not a trade recommendation. That being said, if you like my work please tip me! ETH: 0xf8E0Ea503B5c833fD4546E7fa2c70EcE42A27C8A Please comment with feedback and requests!Wskaźnik Pine Script®od sclark39125
Stochastic + Stochastic RSIJust a basic indicator I rigged up to help reduce screen real estate that ended up providing more insight than expected; overlays both the stochastic and stochastic RSI. While I initially made this to save space, I've begun to pick up on some interesting patterns in cryptocurrencies based on the divergence of stochastic from the stochastic RSI, and the comparison of their swing lows. Left all settings modifiable, since this is simply a combination indicator I've left the source code open unlike other proprietary indicators I use. Happy trading! Austin Doyle CTO Crypto PlayhouseWskaźnik Pine Script®od UnknownUnicorn1613901146
RSI / Stoch / Stoch RSI (SRSI) Overlay [SigmaDraconis]Combines RSI, Stochastic and Stochastic RSI (SRSI) in only one indicator. Most useful to better pick tops and bottoms on oversold and overbought levels. I decided to write it since I felt the need to look at how all 3 behaved at once, relative to each. If you like it, here are my tip jars: BTC: 1CfBVcxmrx7Uxw3SYJWVGKZsEK698fwXP9 LTC: LXXt76wWTksLcM5qbbiAxfP1o8SoxwzDH2 BTS: sigma-draconis Wskaźnik Pine Script®od SigmaDraconis77193
RSI / Stoch / Stoch RSI (SRSI) Overlay [SigmaDraconis]One indicator combining RSI, Stochastic Oscillator and Stochastic RSI in one. Credits for rwhiteside and his RSI / Stoch RSI Overlay indicator who served as inspiration to all three. I believe this will be very useful to a lot of people. If you like, use and i prove to be , you can contribute to my TIP JAR : Wskaźnik Pine Script®od SigmaDraconisZaktualizowano 132
RSI + Stoch/RSIThis is a combination of 2 of the most used indicators. RSI and stochastic/RSI Ive coded them both to work together to save space on your chart and work as only ONE indicator. I specifically only use the D line with my rsi , but you have the option to use the K and D line if you so choose. RSI is good for momentum Stochastic is good for short term momentum. They work very well together and if you are a swing trader or scalper they can help immensely when looking for sniper entry areas after you've done you're initial pattern, level, fibonacci and wave analysis. I like the way this works and have been using these two indicators for a while so I figured I would share. Happy new year everyone, God bless!Wskaźnik Pine Script®od pAulseperformance33311
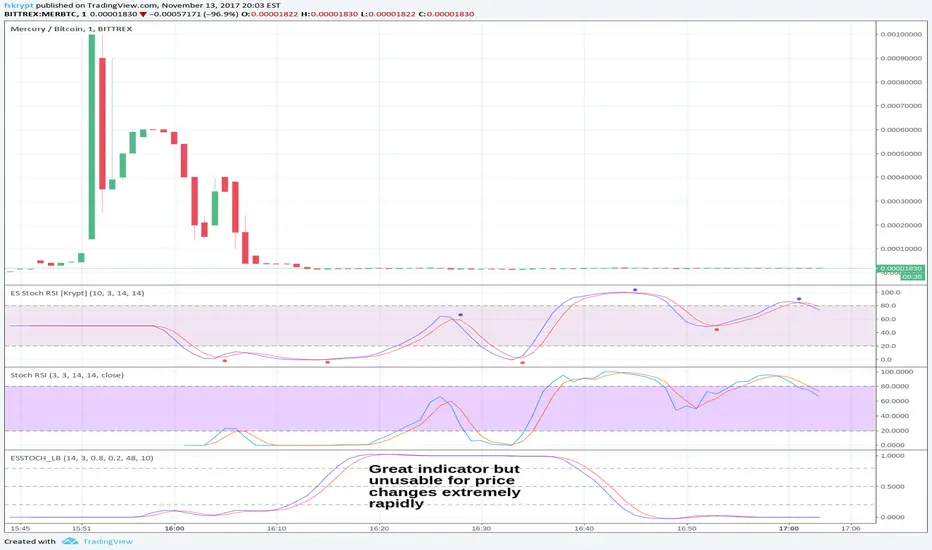
Ehlers-Smoothed Stochastic RSI [Krypt]This script uses a regular Stochastic RSI formula and then runs Ehlers' Super Smoother on top of it. It also provides buy/sell signals on crossovers. The script is inspired by LazyBear Ehlers-Smoothed Stochastic RSI with Roofing Filter, except I find that the Roofing filter (existing implementation) does not work well near extreme price changes, where a regular formula is preferable. The Ehlers Super Smoother however is excellent and seems to provide earlier signals in most cases than an EMA-EMA smoother. Combined, the super-smoother and regular Stochastic RSI formula provide very good results.Wskaźnik Pine Script®od fskryptZaktualizowano 77 1.9 K
Stochastic Connors RSIAn experimental indicator based on the Stochastic + Connors RSI bindingWskaźnik Pine Script®od evergetZaktualizowano 99347
Cuathro EMA StrategyIt's a long term script based on multiples EMA, crossover and crossunder. Based on two good scripts CM Sling and OCC. Always adjust resolution at least twice than chart. Enjoy it! BTCUSDStrategia Pine Script®od monerosZaktualizowano 11155
Log-space Stochastic RSISimilar to regular Stochastic RSI except usable even with charts that show dramatic (10x or more) volatility, such as in the beginning of the ZEC-BTC chart in the example attached.Wskaźnik Pine Script®od fskryptZaktualizowano 127
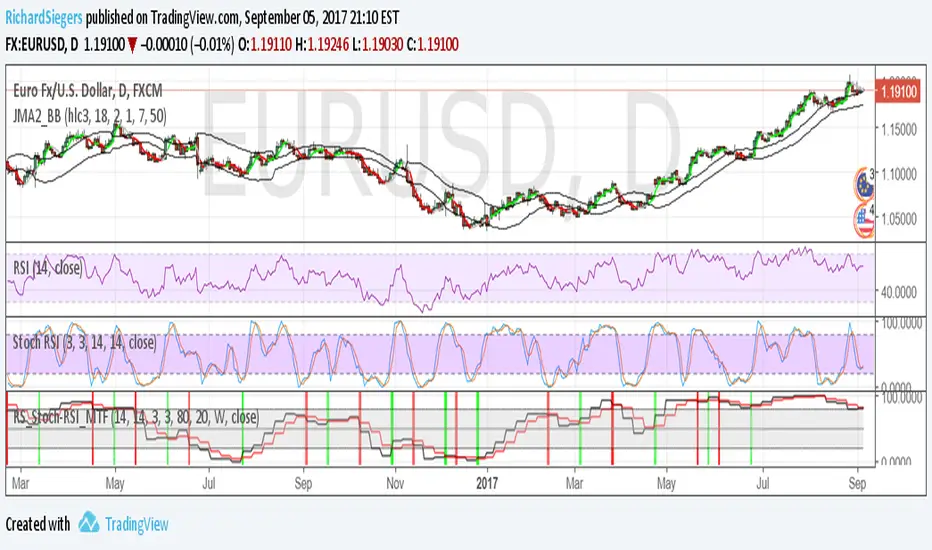
RS_Stoch-RSI_MTFmodification by Richard Siegers that turned stochastic mtf from ChrisMoody into stochastic-rsi mtfWskaźnik Pine Script®od RichardSiegersZaktualizowano 33218
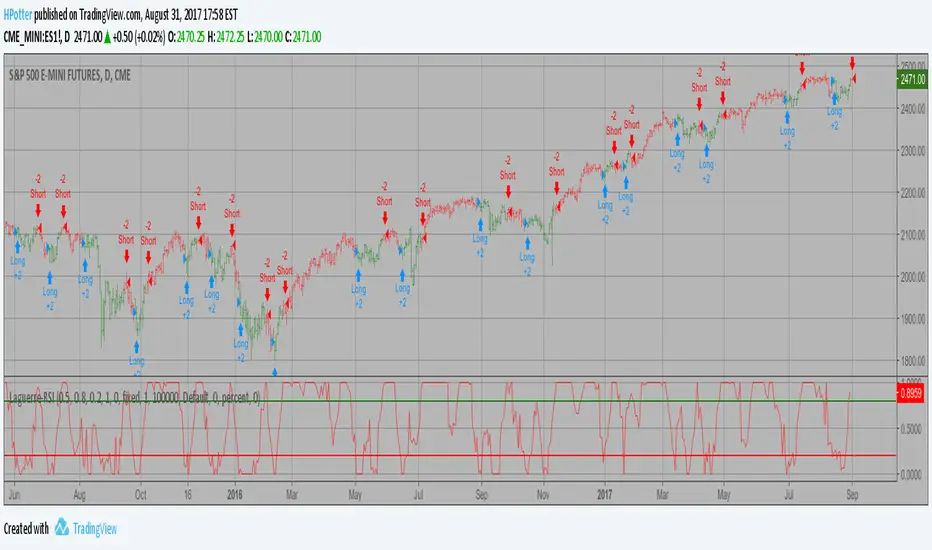
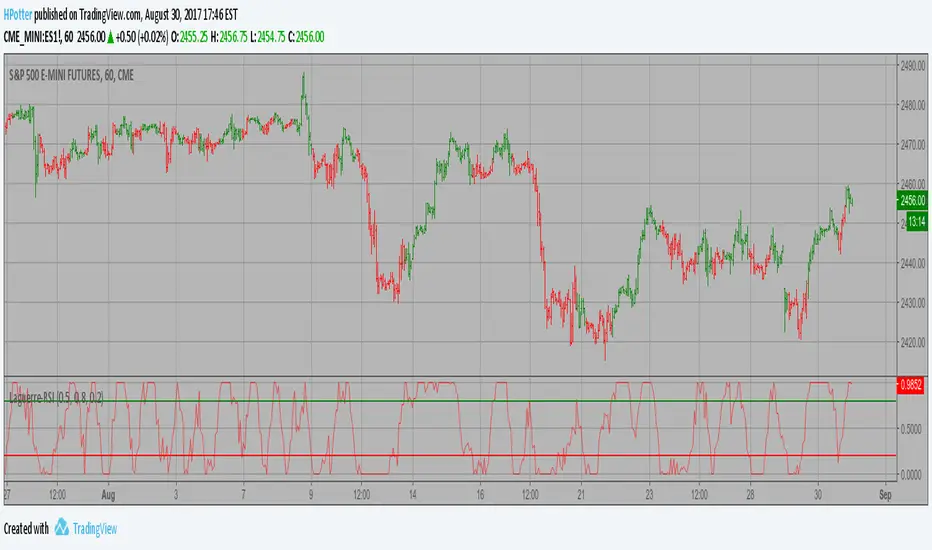
Laguerre-based RSI Backtest This is RSI indicator which is more sesitive to price changes. It is based upon a modern math tool - Laguerre transform filter. With help of Laguerre filter one becomes able to create superior indicators using very short data lengths as well. The use of shorter data lengths means you can make the indicators more responsive to changes in the price. You can change long to short in the Input Settings WARNING: - For purpose educate only - This script to change bars colors.Strategia Pine Script®od HPotter336
Laguerre-based RSI Strategy This is RSI indicator which is more sesitive to price changes. It is based upon a modern math tool - Laguerre transform filter. With help of Laguerre filter one becomes able to create superior indicators using very short data lengths as well. The use of shorter data lengths means you can make the indicators more responsive to changes in the price. WARNING: This script to change bars colors.Wskaźnik Pine Script®od HPotter221