Algo + Trendlines :: Long PeriodThis indicator helps me to avoid overlooking Trendlines / Algolines. So far it doesn't search explicitly for Algolines (I don't consider volume at all), but it's definitely now already not horribly bad.
These are meant to be used on logarithmic charts btw! The lines would be displayed wrong on linear charts.
The biggest challenge is that there are some technical restrictions in TradingView, f. e. a script stops executing if a for-loop would take longer than 0.5 sec.
So in order to circumvent this and still be able to consider as many candles from the past as possible, I've created multiple versions for different purposes that I use like this:
Algo + Trendlines :: Medium Period : This script looks for "temporary highs / lows" (meaning the bar before and after has lower highs / lows) on the daily chart, connects them and shows the 5 ones that are the closest to the current price (=most relevant). This one is good to find trendlines more thoroughly, but only up to 4 years ago.
Algo + Trendlines :: Long Period : This version looks instead at the weekly charts for "temporary highs / lows" and finds out which days caused these highs / lows and connects them, Taking data from the weekly chart means fewer data points to check whether a trendline is broken, which allows to detect trendlines from up to 12 years ago! Therefore it misses some trendlines. Personally I prefer this one with "Only Confirmed" set to true to really show only the most relevant lines. This means at least 3 candle highs / lows touched the line. These are more likely stronger resistance / support lines compared to those that have been touched only twice.
Very important: sometimes you might see dotted lines that suddenly stop after a few months (after 100 bars to be precise). This indicates you need to zoom further out for TradingView to be able to load the full line. Unfortunately TradingView doesn't render lines if the starting point was too long ago, so this is my workaround. This is also the script's biggest advantage: showing you lines that you might have missed otherwise since the starting bars were outside of the screen, and required you to scroll f. e back to 2015..
One more thing to know:
Weak colored line = only 2 "collision" points with candle highs/lows (= not confirmed)
Usual colored line = 3+ "collision" points (= confirmed)
Make sure to move this indicator above the ticker in the Object Tree, so that it is drawn on top of the ticker's candles!
More infos: www.reddit.com
Wyszukaj w skryptach "通达信+选股公式+换手率+0.5+源码"

Smart Money Precision Structure [BullByte]Smart Money Precision Structure
Advanced Market Structure Analysis Using Institutional Order Flow Concepts
---
OVERVIEW
Smart Money Precision Structure (SMPS) is a comprehensive market analysis indicator that combines six analytical frameworks to identify high-probability market structure patterns. The indicator uses multi-dimensional scoring algorithms to evaluate market conditions through institutional order flow concepts, providing traders with professional-grade market analysis.
---
PURPOSE AND ORIGINALITY
Why This Indicator Was Developed
• Addresses the gap between retail and institutional analysis methods
• Consolidates multiple analysis techniques that professionals use separately
• Automates complex market structure evaluation into actionable insights
• Eliminates the need for multiple indicators by providing comprehensive analysis
What Makes SMPS Original
• Six-Layer Confluence System - Unique combination of market regime, structure, volume flow, momentum, price action, and adaptive filtering
• Institutional Pattern Recognition - Identifies smart money accumulation and distribution patterns
• Adaptive Intelligence - Parameters automatically adjust based on detected market conditions
• Real-Time Market Scoring - Proprietary algorithm rates market quality from 0-100%
• Structure Break Detection - Advanced pivot analysis identifies trend reversals early
---
HOW IT WORKS - TECHNICAL METHODOLOGY
1. Market Regime Analysis Engine
The indicator evaluates five core market dimensions:
• Volatility Score - Measures current volatility against 50-period historical baseline
• Trend Score - Analyzes alignment between 8, 21, and 50-period EMAs
• Momentum Score - Combines RSI divergence with MACD signal alignment
• Structure Score - Evaluates pivot point formation clarity
• Efficiency Score - Calculates directional movement efficiency ratio
These scores combine to classify markets into five regimes:
• TRENDING - Strong directional movement with aligned indicators
• RANGING - Sideways movement with mixed directional signals
• VOLATILE - Elevated volatility with unpredictable price swings
• QUIET - Low volatility consolidation periods
• TRANSITIONAL - Market shifting between different regimes
2. Market Structure Analysis
Advanced pivot point analysis identifies:
• Higher Highs and Higher Lows for bullish structure
• Lower Highs and Lower Lows for bearish structure
• Structure breaks when established patterns fail
• Dynamic support and resistance from recent pivot points
• Key level proximity detection using ATR-based buffers
3. Volume Flow Decoding
Institutional activity detection through:
• Volume surge identification when volume exceeds 2x average
• Buy versus sell pressure analysis using price-volume correlation
• Flow strength measurement through directional volume consistency
• Divergence detection between volume and price movements
• Institutional threshold alerts when unusual volume patterns emerge
4. Multi-Period Momentum Synthesis
Weighted momentum calculation across four timeframes:
• 1-period momentum weighted at 40%
• 3-period momentum weighted at 30%
• 5-period momentum weighted at 20%
• 8-period momentum weighted at 10%
Result smoothed with 6-period EMA for noise reduction.
5. Price Action Quality Assessment
Each bar evaluated for:
• Range quality relative to 20-period average
• Body-to-range ratio for directional conviction
• Wick analysis for rejection pattern identification
• Pattern recognition including engulfing and hammer formations
• Sequential price movement analysis
6. Adaptive Parameter System
Parameters automatically adjust based on detected regime:
• Trending markets reduce sensitivity and confirmation requirements
• Volatile markets increase filtering and require additional confirmations
• Ranging markets maintain neutral settings
• Transitional markets use moderate adjustments
---
COMPLETE SETTINGS GUIDE
Section 1: Core Analysis Settings
Analysis Sensitivity (0.3-2.0)
• Default: 1.0
• Lower values require stronger price movements
• Higher values detect more subtle patterns
• Scalpers use 0.8-1.2, swing traders use 1.5-2.0
Noise Reduction Level (2-7)
• Default: 4
• Controls filtering of false patterns
• Higher values reduce pattern frequency
• Increase in volatile markets
Minimum Move % (0.05-0.50)
• Default: 0.15%
• Sets minimum price movement threshold
• Adjust based on instrument volatility
• Forex: 0.05-0.10%, Stocks: 0.15-0.25%, Crypto: 0.20-0.50%
High Confirmation Mode
• Default: True (Enabled)
• Requires all technical conditions to align
• Reduces frequency but increases reliability
• Disable for more aggressive pattern detection
Section 2: Market Regime Detection
Enable Regime Analysis
• Default: True (Enabled)
• Activates market environment evaluation
• Essential for adaptive features
• Keep enabled for best results
Regime Analysis Period (20-100)
• Default: 50 bars
• Determines regime calculation lookback
• Shorter for responsive, longer for stable
• Scalping: 20-30, Swing: 75-100
Minimum Market Clarity (0.2-0.8)
• Default: 0.4
• Quality threshold for pattern generation
• Higher values require clearer conditions
• Lower for more patterns, higher for quality
Adaptive Parameter Adjustment
• Default: True (Enabled)
• Enables automatic parameter optimization
• Adjusts based on market regime
• Highly recommended to keep enabled
Section 3: Market Structure Analysis
Enable Structure Validation
• Default: True (Enabled)
• Validates patterns against support/resistance
• Confirms trend structure alignment
• Essential for reliability
Structure Analysis Period (15-50)
• Default: 30 bars
• Period for structure pattern analysis
• Affects support/resistance calculation
• Match to your trading timeframe
Minimum Structure Alignment (0.3-0.8)
• Default: 0.5
• Required structure score for valid patterns
• Higher values need stronger structure
• Balance with desired frequency
Section 4: Analysis Configuration
Minimum Strength Level (3-5)
• Default: 4
• Minimum confirmations for pattern display
• 5 = Maximum reliability, 3 = More patterns
• Beginners should use 4-5
Required Technical Confirmations (4-6)
• Default: 5
• Number of aligned technical factors
• Higher = fewer but better patterns
• Works with High Confirmation Mode
Pattern Separation (3-20 bars)
• Default: 8 bars
• Minimum bars between patterns
• Prevents clustering and overtrading
• Increase for cleaner charts
Section 5: Technical Filters
Momentum Validation
• Default: True (Enabled)
• Requires momentum alignment
• Filters counter-trend patterns
• Essential for trend following
Volume Confluence Analysis
• Default: True (Enabled)
• Requires volume confirmation
• Identifies institutional participation
• Critical for reliability
Trend Direction Filter
• Default: True (Enabled)
• Only shows patterns with trend
• Reduces counter-trend signals
• Disable for reversal hunting
Section 6: Volume Flow Analysis
Institutional Activity Threshold (1.2-3.5)
• Default: 2.0
• Multiplier for unusual volume detection
• Lower finds more institutional activity
• Stock: 2.0-2.5, Forex: 1.5-2.0, Crypto: 2.5-3.5
Volume Surge Multiplier (1.8-4.5)
• Default: 2.5
• Defines significant volume increases
• Adjust per instrument characteristics
• Higher for stocks, lower for forex
Volume Flow Period (12-35)
• Default: 18 bars
• Smoothing for volume analysis
• Shorter = responsive, longer = smooth
• Match to timeframe used
Section 7: Analysis Frequency Control
Maximum Analysis Points Per Hour (1-5)
• Default: 3
• Limits pattern frequency
• Prevents overtrading
• Scalpers: 4-5, Swing traders: 1-2
Section 8: Target Level Configuration
Target Calculation Method
• Default: Market Adaptive
• Three modes available:
- Fixed: Uses set point distances
- Dynamic: ATR-based calculations
- Market Adaptive: Structure-based levels
Minimum Target/Risk Ratio (1.0-3.0)
• Default: 1.5
• Minimum acceptable reward vs risk
• Higher filters lower probability setups
• Professional standard: 1.5-2.0
Fixed Mode Settings:
• Fixed Target Distance: 50 points default
• Fixed Invalidation Distance: 30 points default
• Use for consistent instruments
Dynamic Mode Settings:
• Dynamic Target Multiplier: 1.8x ATR default
• Dynamic Invalidation Multiplier: 1.0x ATR default
• Adapts to volatility automatically
Market Adaptive Settings:
• Use Structure Levels: True (default)
• Structure Level Buffer: 0.1% default
• Places levels at actual support/resistance
Section 9: Visual Display Settings
Color Theme Options
• Professional (Teal/Red)
- Bullish: Teal (#26a69a)
- Bearish: Red (#ef5350)
- Neutral: Gray (#78909c)
- Best for: Traditional traders, clean appearance
• Dark (Neon Green/Pink)
- Bullish: Neon Green (#00ff88)
- Bearish: Hot Pink (#ff0044)
- Neutral: Dark Gray (#333333)
- Best for: Dark theme users, high contrast
• Light (Green/Red Classic)
- Bullish: Green (#4caf50)
- Bearish: Red (#f44336)
- Neutral: Light Gray (#9e9e9e)
- Best for: Light backgrounds, traditional colors
• Vibrant (Cyan/Magenta)
- Bullish: Cyan (#00ffff)
- Bearish: Magenta (#ff00ff)
- Neutral: Medium Gray (#888888)
- Best for: High visibility, modern appearance
Dashboard Position
• Options: Top Left, Top Right, Bottom Left, Bottom Right, Middle Left, Middle Right
• Default: Top Right
• Choose based on chart layout preference
Dashboard Size
• Full: Complete information display (desktop)
• Mobile: Compact view for small screens
• Default: Full
Analysis Display Style
• Arrows : Simple directional markers
• Labels : Detailed text information
• Zones : Colored areas showing pattern regions
• Default: Labels (most informative)
Display Options:
• Display Analysis Strength: Shows star rating
• Display Target Levels: Shows target/invalidation lines
• Display Market Regime: Shows regime in pattern labels
---
HOW TO USE SMPS - DETAILED GUIDE
Understanding the Dashboard
Top Row - Header
• SMPS Dashboard title
• VALUE column: Current readings
• STATUS column: Condition assessments
Market Regime Row
• Shows: TRENDING, RANGING, VOLATILE, QUIET, or TRANSITIONAL
• Color coding: Green = Favorable, Red = Caution
• Status: FAVORABLE or CAUTION trading conditions
Market Score Row
• Percentage from 0-100%
• Above 60% = Strong conditions
• 40-60% = Moderate conditions
• Below 40% = Weak conditions
Structure Row
• Direction: BULLISH, BEARISH, or NEUTRAL
• Status: INTACT or BREAK
• Orange BREAK indicates structure failure
Volume Flow Row
• Direction: BUYING or SELLING
• Intensity: STRONG or WEAK
• Color indicates dominant pressure
Momentum Row
• Numerical momentum value
• Positive = Upward pressure
• Negative = Downward pressure
Volume Status Row
• INST = Institutional activity detected
• HIGH = Above average volume
• NORM = Normal volume levels
Adaptive Mode Row
• ACTIVE = Parameters adjusting
• STATIC = Fixed parameters
• Shows required confirmations
Analysis Level Row
• Minimum strength level setting
• Pattern separation in bars
Market State Row
• Current analysis: BULLISH, BEARISH, NEUTRAL
• Shows analysis price level when active
T:R Ratio Row
• Current target to risk ratio
• GOOD = Meets minimum requirement
• LOW = Below minimum threshold
Strength Row
• BULL or BEAR dominance
• Numerical strength value 0-100
Price Row
• Current price
• Percentage change
Last Analysis Row
• Previous pattern direction
• Bars since last pattern
Reading Pattern Signals
Bullish Structure Pattern
• Upward triangle or "Bullish Structure" label
• Star rating shows strength (★★★★★ = strongest)
• Green line = potential target level
• Red dashed line = invalidation level
• Appears below price bars
Bearish Structure Pattern
• Downward triangle or "Bearish Structure" label
• Star rating indicates reliability
• Green line = potential target level
• Red dashed line = invalidation level
• Appears above price bars
Pattern Strength Interpretation
• ★★★★★ = 6 confirmations (exceptional)
• ★★★★☆ = 5 confirmations (strong)
• ★★★☆☆ = 4 confirmations (moderate)
• ★★☆☆☆ = 3 confirmations (minimum)
• Below minimum = filtered out
Visual Elements on Chart
Lines and Levels:
• Gray Line = 21 EMA trend reference
• Green Stepline = Dynamic support level
• Red Stepline = Dynamic resistance level
• Green Solid Line = Active target level
• Red Dashed Line = Active invalidation level
Pattern Markers:
• Triangles = Arrow display mode
• Text Labels = Label display mode
• Colored Boxes = Zone display mode
Target Completion Labels:
• "Target" = Price reached target level
• "Invalid" = Pattern invalidated by price
---
RECOMMENDED USAGE BY TIMEFRAME
1-Minute Charts (Scalping)
• Sensitivity: 0.8-1.2
• Noise Reduction: 3-4
• Pattern Separation: 3-5 bars
• High Confirmation: Optional
• Best for: Quick intraday moves
5-Minute Charts (Precision Intraday)
• Sensitivity: 1.0 (default)
• Noise Reduction: 4 (default)
• Pattern Separation: 8 bars
• High Confirmation: Enabled
• Best for: Day trading
15-Minute Charts (Short Swing)
• Sensitivity: 1.0-1.5
• Noise Reduction: 4-5
• Pattern Separation: 10-12 bars
• High Confirmation: Enabled
• Best for: Intraday swings
30-Minute to 1-Hour (Position Trading)
• Sensitivity: 1.5-2.0
• Noise Reduction: 5-7
• Pattern Separation: 15-20 bars
• Regime Period: 75-100
• Best for: Multi-day positions
Daily Charts (Swing Trading)
• Sensitivity: 1.8-2.0
• Noise Reduction: 6-7
• Pattern Separation: 20 bars
• All filters enabled
• Best for: Long-term analysis
---
MARKET-SPECIFIC SETTINGS
Forex Pairs
• Minimum Move: 0.05-0.10%
• Institutional Threshold: 1.5-2.0
• Volume Surge: 1.8-2.2
• Target Mode: Dynamic or Market Adaptive
Stock Indices (ES, NQ, YM)
• Minimum Move: 0.10-0.15%
• Institutional Threshold: 2.0-2.5
• Volume Surge: 2.5-3.0
• Target Mode: Market Adaptive
Individual Stocks
• Minimum Move: 0.15-0.25%
• Institutional Threshold: 2.0-2.5
• Volume Surge: 2.5-3.5
• Target Mode: Dynamic
Cryptocurrency
• Minimum Move: 0.20-0.50%
• Institutional Threshold: 2.5-3.5
• Volume Surge: 3.0-4.5
• Target Mode: Dynamic
• Increase noise reduction
---
PRACTICAL APPLICATION EXAMPLES
Example 1: Strong Trending Market
Dashboard Reading:
• Market Regime: TRENDING
• Market Score: 75%
• Structure: BULLISH, INTACT
• Volume Flow: BUYING, STRONG
• Momentum: +0.45
Interpretation:
• Strong uptrend environment
• Institutional buying present
• Look for bullish patterns as continuation
• Higher probability of success
• Consider using lower sensitivity
Example 2: Range-Bound Conditions
Dashboard Reading:
• Market Regime: RANGING
• Market Score: 35%
• Structure: NEUTRAL
• Volume Flow: SELLING, WEAK
• Momentum: -0.05
Interpretation:
• No clear direction
• Low opportunity environment
• Patterns are less reliable
• Consider waiting for regime change
• Or switch to a range-trading approach
Example 3: Structure Break Alert
Dashboard Reading:
• Previous: BULLISH structure
• Current: Structure BREAK
• Volume: INST flag active
• Momentum: Shifting negative
Interpretation:
• Trend reversal potentially beginning
• Institutional participation detected
• Watch for bearish pattern confirmation
• Adjust bias accordingly
• Increase caution on long positions
Example 4: Volatile Market
Dashboard Reading:
• Market Regime: VOLATILE
• Market Score: 45%
• Adaptive Mode: ACTIVE
• Confirmations: Increased to 6
Interpretation:
• Choppy conditions
• Parameters auto-adjusted
• Fewer but higher quality patterns
• Wider stops may be needed
• Consider reducing position size
Below are a few chart examples of the Smart Money Precision Structure (SMPS) indicator in action.
• Example 1 – Bullish Structure Detection on SOLUSD 5m
• Example 2 – Bearish Structure Detected with Strong Confluence on SOLUSD 5m
---
TROUBLESHOOTING GUIDE
No Patterns Appearing
Check these settings:
• High Confirmation Mode may be too restrictive
• Minimum Strength Level may be too high
• Market Clarity threshold may be too high
• Regime filter may be blocking patterns
• Try increasing sensitivity
Too Many Patterns
Adjust these settings:
• Enable High Confirmation Mode
• Increase Minimum Strength Level to 5
• Increase Pattern Separation
• Reduce Sensitivity below 1.0
• Enable all technical filters
Dashboard Shows "CAUTION"
This indicates:
• Market conditions are unfavorable
• Regime is RANGING or QUIET
• Market score is low
• Consider waiting for better conditions
• Or adjust expectations accordingly
Patterns Not Reaching Targets
Consider:
• Market may be choppy
• Volatility may have changed
• Try Dynamic target mode
• Reduce target/risk ratio requirement
• Check if regime is VOLATILE
---
ALERTS CONFIGURATION
Alert Message Format
Alerts include:
• Pattern type (Bullish/Bearish)
• Strength rating
• Market regime
• Analysis price level
• Target and invalidation levels
• Strength percentage
• Target/Risk ratio
• Educational disclaimer
Setting Up Alerts
• Click Alert button on TradingView
• Select SMPS indicator
• Choose alert frequency
• Customize message if desired
• Alerts fire on pattern detection
---
DATA WINDOW INFORMATION
The Data Window displays:
• Market Regime Score (0-100)
• Market Structure Bias (-1 to +1)
• Bullish Strength (0-100)
• Bearish Strength (0-100)
• Bull Target/Risk Ratio
• Bear Target/Risk Ratio
• Relative Volume
• Momentum Value
• Volume Flow Strength
• Bull Confirmations Count
• Bear Confirmations Count
---
BEST PRACTICES AND TIPS
For Beginners
• Start with default settings
• Use High Confirmation Mode
• Focus on TRENDING regime only
• Paper trade first
• Learn one timeframe thoroughly
For Intermediate Users
• Experiment with sensitivity settings
• Try different target modes
• Use multiple timeframes
• Combine with price action analysis
• Track pattern success rate
For Advanced Users
• Customize per instrument
• Create setting templates
• Use regime information for bias
• Combine with other indicators
• Develop systematic rules
---
IMPORTANT DISCLAIMERS
• This indicator is for educational and informational purposes only
• Not financial advice or a trading system
• Past performance does not guarantee future results
• Trading involves substantial risk of loss
• Always use appropriate risk management
• Verify patterns with additional analysis
• The author is not a registered investment advisor
• No liability accepted for trading losses
---
VERSION NOTES
Version 1.0.0 - Initial Release
• Six-layer confluence system
• Adaptive parameter technology
• Institutional volume detection
• Market regime classification
• Structure break identification
• Real-time dashboard
• Multiple display modes
• Comprehensive settings
## My Final Thoughts
Smart Money Precision Structure represents an advanced approach to market analysis, bringing institutional-grade techniques to retail traders through intelligent automation and multi-dimensional evaluation. By combining six analytical frameworks with adaptive parameter adjustment, SMPS provides comprehensive market intelligence that single indicators cannot achieve.
The indicator serves as an educational tool for understanding how professional traders analyze markets, while providing practical pattern detection for those seeking to improve their technical analysis. Remember that all trading involves risk, and this tool should be used as part of a complete analysis approach, not as a standalone trading system.
- BullByte

Index Position Size Calculator for [US30 / US100 / SP500]What it does
This tool helps you size positions consistently for index trades on US30 (Dow Jones), NAS100 (Nasdaq-100), and SP500 (S&P 500). Enter your account balance, risk %, and your planned Entry / Stop-Loss / Target and the script calculates:
• Position Size (rounded to your lot/contract step)
• Risk-to-Reward (R/R)
• Potential P/L in USD based on your inputs
• Visual Entry / SL / TP lines with green/red zones and concise labels
Supported contract styles
Choose a preset for common products (e.g., CFD $1/pt, YM/NQ/ES futures, MYM/MNQ/MES micros) or override the economics yourself. You remain in control of the two key levers:
• $/point — how many dollars you gain/lose per 1 index point per contract/lot
• Point size — how many price units equal 1 index point on your chart (often 1.0, but some brokers use 0.1 or 0.5)
Inputs
• Account Balance ($) and Risk % per trade
• Index: US30 / NAS100 / SP500
• Contract: CFD / Futures (YM, NQ, ES) / Micros (MYM, MNQ, MES)
• $/point: auto from Contract or manual override
• Point size: auto from Index or manual override
• Position size step: rounding (e.g., 1 for futures, 0.01 for CFDs)
• Entry / SL / TP: typed values (snapped to tick), with on-chart zones and labels
• Display toggles for lines and labels
How the math works
• StopPoints = |Entry − SL| ÷ PointSize
• ProfitPoints = |TP − Entry| ÷ PointSize
• Position Size = (AccountBalance × Risk%) ÷ (StopPoints × $/point)
• R/R = ProfitPoints ÷ StopPoints
• Potential P/L = PositionSize × Points × $/point
How to use (quick start)
1. Select Index and Contract.
2. Confirm $/point and Point size match your broker’s specs.
3. Enter Entry / SL / TP for the trade idea.
4. Read the Position Size, R/R, and Potential P/L in the info box.
5. Adjust for fees, spreads, and slippage as needed.
Notes & limitations
• Broker symbols can vary. Always verify $/point and Point size for your instrument before risking capital.
• The script does not place orders and does not generate trade signals; it’s a sizing/visualization tool.
• Results can differ across brokers due to pricing, spreads, minimum lot sizes, and execution rules.
• Use on the intended indices; you’ll see a reminder if you load it elsewhere.
Changelog highlights
• Pine v6, constant-safe inputs, tick-snapping, global fills (no local-scope errors).
• Robust label handling and optional minimal chart markers.
Disclaimer
This script is provided for educational purposes only and does not constitute financial advice or a recommendation to buy or sell any security or derivative. Trading involves risk, including the possible loss of principal. Always do your own research, verify contract specifications with your broker, and consider testing in a demo environment before trading live.

EdgeFlow Pullback [CHE]EdgeFlow Pullback \ — Icon & Visual Guide (Deep Dive)
TL;DR (1-minute read)
⏳ Hourglass = Pending verdict. A countdown runs from the signal bar until your Evaluation Window ends.
✔ Checkmark (green) = OK. After the evaluation window, price (HLC3) is on the correct side of the EMA144 for that signal’s direction.
✖ Cross (red) = Fail. After the evaluation window, price (HLC3) is on the wrong side of the EMA144.
▲ / ▼ Triangles = the actual PB Long/Short signal bar (sequence completed in time).
Small lime/red crosses = visual markers when HLC3 crosses EMA144 (context, not trade signals).
Orange line = EMA144 (baseline/trend filter).
T3 line color = Context signal: green when T3 is below HLC3, red when T3 is above HLC3.
Icon Glossary (What each symbol means)
1) ⏳ Hourglass — “Pending / Countdown”
Appears immediately when a PB signal fires (Long or Short).
Shows `⏳ currentBars / EvaluationBars` (e.g., `⏳ 7/30`).
The label stays anchored at the signal bar and its original price level (it does not drift with price).
During ⏳ you get no verdict yet. It’s simply the waiting period before grading.
2) ✔ Checkmark (green) — “Condition met”
Appears after the Evaluation Window completes.
Logic:
Long signal: HLC3 (typical price) is above EMA144 → ✔
Short signal: HLC3 is below EMA144 → ✔
The label turns green and text says “✔ … Condition met”.
This is rules-based grading, not PnL. It tells you if the post-signal structure behaved as expected.
3) ✖ Cross (red) — “Condition failed”
Appears after the Evaluation Window completes if the condition above is not met.
Label turns red with “✖ … Condition failed”.
Again: rules-based verdict, not a guarantee of profit or loss.
4) ▲ “PB Long” triangle (below bar)
Marks the exact bar where the 4-step Long sequence completed within the allowed window.
That bar is your signal bar for Long setups.
5) ▼ “PB Short” triangle (above bar, red)
Same as above, for Short setups.
6) Lime/Red “+” crosses (tiny cross markers)
Lime cross (below bar): HLC3 crosses above EMA144 (crossover).
Red cross (above bar): HLC3 crosses below EMA144 (crossunder).
These crosses are context markers; they’re not entry signals by themselves.
The Two Clocks (Don’t mix them up)
There are two different time windows at play:
1. Signal Window — “Max bars for full sequence”
A pullback signal (Long or Short) only fires if the 4-step sequence completes within this many bars.
If it takes too long: reset (no signal, no triangle, no label).
Purpose: avoid stale setups.
2. Evaluation Window — “Evaluation window after signal (bars)”
Starts after the signal bar. The label shows an ⏳ countdown.
When it reaches the set number of bars, the indicator checks whether HLC3 is on the correct side of EMA144 for the signal direction.
Then it stamps the signal with ✔ (OK) or ✖ (Fail).
Timeline sketch (Long example):
```
→ ▲ PB Long at bar t0
Label shows: ⏳ 0/EvalBars
t0+1, t0+2, ... t0+EvalBars-1 → still ⏳
At t0+EvalBars → Check HLC3 vs EMA144
Result → ✔ (green) or ✖ (red)
(Label remains anchored at t0 / signal price)
```
What Triggers the PB Signal (so you know why triangles appear)
LONG sequence (4 steps in order):
1. T3 falling (the pullback begins)
2. HLC3 crosses under EMA144
3. T3 rising (pullback ends)
4. HLC3 crosses over EMA144 → PB Long triangle
SHORT sequence (mirror):
1. T3 rising
2. HLC3 crosses over EMA144
3. T3 falling
4. HLC3 crosses under EMA144 → PB Short triangle
If steps 1→4 don’t complete in time (within Max bars for full sequence), the sequence is abandoned (no signal).
Lines & Colors (quick interpretation)
EMA144 (orange): your baseline trend filter.
T3 (green/red):
Green when T3 < HLC3 (price above the smoothed path; often supportive in up-moves)
Red when T3 > HLC3 (price below the smoothed path; often pressure in down-moves)
HLC3 (gray): the typical price the logic uses ( (H+L+C)/3 ).
Label Behavior (anchoring & cleanup)
Each signal creates one label at the signal bar with ⏳.
The label is position-locked: it stays at the same bar index and y-price it was born at.
After the evaluation check, the label text and color update to ✔/✖, but position stays fixed.
The indicator keeps only the last N labels (your “Show only the last N labels” input). Older ones are deleted to reduce clutter.
What You Can (and Can’t) Infer from ✔ / ✖
✔ OK: Structure behaved as intended during the evaluation window (HLC3 finished on the correct side of EMA144).
Inference: The pullback continued in the expected direction post-signal.
✖ Fail: Structure ended up opposite the expectation.
Inference: The pullback did not continue cleanly (chop, reversal, or insufficient follow-through).
> Important: ✔/✖ is not profit or loss. It’s an objective rule check. Use it to identify market regimes where your entries perform best.
Input Settings — How they change the visuals
T3 length:
Shorter → faster turns, more signals (and more noise).
Longer → smoother turns, fewer but cleaner sequences.
T3 volume factor (0–1, default 0.7):
Higher → more curvature/smoothing.
Typical sweet spot: 0.5–0.9.
EMA length (baseline) default 144:
Smaller → faster baseline, more cross events, more aggressive signals.
Larger → slower, stricter trend confirmation.
Max bars for full sequence (signal window):
Smaller → only fresh, snappy pullbacks can signal.
Larger → allows slower pullbacks to complete.
Evaluation window (after signal):
Smaller → verdict arrives quickly (less tolerance).
Larger → gives the trade more time to prove itself structurally.
Show only the last N labels:
Controls chart clutter. Increase for more history, decrease for focus.
(FYI: The “Debug” toggle exists but doesn’t draw extra overlays in this version.)
Practical Reading Flow (how to use visuals in seconds)
1. Triangles catch your eye: ▲ for Long, ▼ for Short. That’s the setup completion.
2. ⏳ label starts—don’t judge yet; let the evaluation run.
3. Watch EMA slope and T3 color for context (trend + pressure).
4. After the window: ✔/✖ stamps the outcome. Log what the market was like when you got ✔.
Common “Why did…?” Questions
Q: Why did I get no triangle even though T3 turned and EMA crossed?
A: The 4 steps must happen in order and within the Signal Window. If timing breaks, the sequence resets.
Q: Why did my label stay ⏳ for so long?
A: That’s by design until the Evaluation Window completes. The verdict only happens at the end of that window.
Q: Why is ✔/✖ different from my PnL?
A: It’s a structure check, not a profit check. It doesn’t know your entries/exits/stops.
Q: Do the small lime/red crosses mean buy/sell?
A: No. They’re context markers for HLC3↔EMA crosses, useful inside the sequence but not standalone signals.
Pro Tips (turn visuals into decisions)
Entry: Use the ▲/▼ triangle as your trigger, in trend direction (check EMA slope/market structure).
Stop: Behind the pullback swing around the signal bar.
Exit: Structure levels, R-multiples, or a reverse HLC3↔EMA cross as a trailing logic.
Tuning:
Intraday/volatile: shorter T3/EMA + tighter Signal Window.
Swing/slow: default 144 EMA + moderate windows.
Learn quickly: Filter your chart to show only ✔ or only ✖ windows in your notes; see which sessions, assets, and volatility regimes suit the system.
Disclaimer
No indicator guarantees profits. Sweep2Trade Pro \ is a decision aid; always combine with solid risk management and your own judgment. Backtest, forward test, and size responsibly.
The content provided, including all code and materials, is strictly for educational and informational purposes only. It is not intended as, and should not be interpreted as, financial advice, a recommendation to buy or sell any financial instrument, or an offer of any financial product or service. All strategies, tools, and examples discussed are provided for illustrative purposes to demonstrate coding techniques and the functionality of Pine Script within a trading context.
Any results from strategies or tools provided are hypothetical, and past performance is not indicative of future results. Trading and investing involve high risk, including the potential loss of principal, and may not be suitable for all individuals. Before making any trading decisions, please consult with a qualified financial professional to understand the risks involved.
By using this script, you acknowledge and agree that any trading decisions are made solely at your discretion and risk.
Enhance your trading precision and confidence 🚀
Happy trading
Chervolino

VPOC Harmonics - Liquidity-Weighted Price / Time RatiosVPOC Harmonics - Liquidity-Weighted Price / Time Ratios
Summary
This indicator transforms a swing’s price range, duration, and liquidity profile into a structured set of price-per-bar ratios. By anchoring two points and manually entering the swing’s VPOC (highest-volume price), it generates candidate compression values that unify price, time, and liquidity structure. These values can be applied to chart scaling, harmonic testing, and liquidity-aware market geometry.
________________________________________
Overview
Most swing analysis tools only consider price (ΔP) and time (N bars). This script goes further by incorporating the VPOC (Point of Control) — the price with the highest traded volume — directly into swing geometry.
• Anchors define the swing’s Low (L), High (H), and bar count (N).
• The user manually enters the VPOC (highest-volume price).
• The indicator then computes a suite of ratios that integrate range, duration, and liquidity placement.
The output is a table of liquidity-weighted price-per-bar candidates, designed for compression testing and harmonic analysis across swings and instruments.
________________________________________
How to Use
1. Select a Swing
- Place Anchor A and Anchor B to define the swing’s Low, High, and bar count.
2. Find the VPOC
- Apply TradingView’s Fixed Range Volume Profile tool over the same swing.
- Identify the Point of Control (POC) — the price level with the highest traded volume.
3. Enter the VPOC
- Manually input the POC into the indicator settings.
4. Review Outputs
- The table will display candidate ratios expressed mainly as price-per-bar values.
5. Apply in Practice
- Use the ratios as chart compression inputs or as benchmarks for testing harmonic alignments across swings.
________________________________________
Outputs
Swing & Inputs
• Bars (N): total bar count of the swing.
• Low (L): swing low price.
• High (H): swing high price.
• ΔP = H − L: price range.
• Mid = (L + H) ÷ 2: midpoint price.
• VPOC (V): user-entered highest-volume price.
• Base slope s0 = ΔP ÷ N: average change per bar.
• π-adjusted slope sπ = (π × ΔP) ÷ (2 × N): slope adjusted for half-cycle arc geometry.
________________________________________
VPOC Harmony Ratios (L, H, V, N)
• λ = (V − L) ÷ ΔP: normalized VPOC position within the range.
• R = (V − L) ÷ (H − V): symmetry ratio comparing lower vs. upper segment.
• s1 = (V − L) ÷ N: slope from Low → VPOC.
• s2 = (H − V) ÷ N: slope from VPOC → High.
________________________________________
Blended Means (s1, s2)
These combine the two segment slopes in different ways:
• HM(s1,s2) = 2 ÷ (1/s1 + 1/s2): Harmonic mean, emphasizes the smaller slope.
• GM(s1,s2) = sqrt(s1 × s2): Geometric mean, balances both slopes proportionally.
• RMS(s1,s2) = sqrt((s1² + s2²) ÷ 2): Root-mean-square, emphasizes the larger slope.
• L2 = sqrt(s1² + s2²): Euclidean norm, the vector length of both slopes combined.
________________________________________
Slope Blends
• Quadratic weighting: s_quad = s0 × ((V−L)² + (H−V)²) ÷ (ΔP²)
• Tilted slope: s_tilt = s0 × (0.5 + λ)
• Entropy-scaled slope: s_ent = s0 × H2(λ), with H2(λ) = −
________________________________________
Curvature & Liquidity Extensions
• π-arc × λ: s_arc = sπ × λ
• Liquidity-π: s_piV = sπ × (V ÷ Mid)
________________________________________
Scale-Normalized Families
With k = sqrt(H ÷ L):
• k (scale factor) = sqrt(H ÷ L)
• s_comp = s0 ÷ k: compressed slope candidate
• s_exp = s0 × k: expanded slope candidate
• Exponentiated blends:
- s_kλ = s0 × k^(2λ−1)
- s_φλ = s0 × φ^(2λ−1), with φ = golden ratio ≈ 1.618
- s_√2λ = s0 × (√2)^(2λ−1)
________________________________________
Practical Application
All formulas generate liquidity-weighted price-per-bar ratios that integrate range, time, and VPOC placement.
These values are designed for:
• Chart compression settings
• Testing harmonic alignments across swings
• Liquidity-aware scaling experiments
________________________________________

Range FinderRange Finder Strategy for TradingView
Overview
The Range Finder Strategy is a sophisticated trading system designed for forex and cryptocurrency markets, leveraging dynamic range detection, wick-based rejection patterns, and EMA confluence to execute high-probability trades. This strategy identifies key price ranges using pivot points and triggers trades when price rejects from these boundaries with significant wick formations, aligning with the broader market trend as confirmed by EMA crossovers. It incorporates robust risk management, customizable parameters, and visual aids for clear trade visualization, making it suitable for both manual and automated trading on platforms like Bitget via webhook alerts.
Strategy Components
1. Dynamic Range Detection
Pivot Points: The strategy identifies range boundaries using pivot highs and lows, calculated with a user-defined Pivot Length (default: 5 bars left/right). These pivots mark significant swing points, defining the upper (range high) and lower (range low) boundaries of the price range.
Visualization: The range high is plotted as an orange line, and the range low as a purple line, using a broken line style (plot.style_linebr) to show only confirmed pivot levels, providing a clear visual of the trading range.
2. Wick-Based Rejection Pattern
Wick Detection: The strategy looks for rejection candles at the range boundaries, characterized by significant wicks. A wick is considered valid if its size is at least the user-defined Wick to Body Ratio (default: 1.1, or 10% larger than the candle body).
Sell Signal: Triggered when the high exceeds the range high, the candle closes bearish (close < open), and the upper wick meets the ratio requirement.
Buy Signal: Triggered when the low falls below the range low, the candle closes bullish (close > open), and the lower wick meets the ratio requirement.
Purpose: These wicks indicate strong rejection at key levels, often signaling a reversal back into the range, providing high-probability entry points.
3. EMA Trend Confirmation
EMA Calculation: Uses two Exponential Moving Averages (EMAs) calculated on a user-selectable timeframe (default: 5-minute):
EMA 200: Long-term trend indicator (plotted in red).
EMA 50: Short-term trend indicator (plotted in green).
Crossover Logic:
A bullish trend is confirmed when the EMA 50 crosses above the EMA 200 (ema_trend_up = true).
A bearish trend is confirmed when the EMA 50 crosses below the EMA 200 (ema_trend_down = true).
Confluence Requirement: Trades are only executed when the wick rejection aligns with the EMA trend (e.g., sell signals require close < ema200 and bearish trend; buy signals require close > ema200 and bullish trend).
4. Risk Management
Position Sizing: Calculated based on the user-defined Account Balance (default: $10,000) and Risk Per Trade (default: 2%). The position size is determined as risk_amount / stop_distance, where stop_distance is derived from the Average True Range (ATR, default period: 14).
Stop Loss (SL): Set using an ATR-based multiplier (SL Multiplier, default: 9.0). For sells, SL is placed above the high; for buys, below the low.
Take Profit (TP): Set using an ATR-based multiplier (TP Multiplier, default: 6.0) scaled by the Risk:Reward Ratio (default: 6.0), ensuring a favorable reward-to-risk profile.
Example: For a $10,000 account with 2% risk, if ATR is 0.5, the position size is 400 units, with SL and TP dynamically adjusted to market volatility.
5. Trade Execution
Sell Entry: Triggered on a wick rejection above the range high, with bearish EMA confluence (ema_trend_down and close < ema200). Enters a short position with calculated SL and TP.
Buy Entry: Triggered on a wick rejection below the range low, with bullish EMA confluence (ema_trend_up and close > ema200). Enters a long position with calculated SL and TP.
Exit Logic: Uses strategy.exit to set SL and TP levels, closing trades when either is hit.
6. Visual Feedback
Lines and Labels: Upon trade entry, the strategy plots:
Red SL line and label (e.g., "SL: 123.45").
Green TP line and label (e.g., "TP: 120.00").
Entry line (red for sell, green for buy) labeled with "Sell (Range Rejection)" or "Buy (Range Rejection)".
Customization: Users can adjust the Line Length (default: 25 bars) for how long lines persist and Label Position (left or right) for optimal chart visibility.
7. Alert Conditions
Webhook Integration: Generates alerts for Bitget webhook integration, providing JSON-formatted messages with trade details (action, contracts, market position, size, price, symbol, and timestamp).
Usage: Traders can set up automated trading by connecting these alerts to trading bots or platforms supporting webhooks.

Overnight Gap Dominance Indicator (OGDI)The Overnight Gap Dominance Indicator (OGDI) measures the relative volatility of overnight price gaps versus intraday price movements for a given security, such as SPY or SPX. It uses a rolling standard deviation of absolute overnight percentage changes divided by the standard deviation of absolute intraday percentage changes over a customizable window. This helps traders identify periods where overnight gaps predominate, suggesting potential opportunities for strategies leveraging extended market moves.
Instructions
A
pply the indicator to your TradingView chart for the desired security (e.g., SPY or SPX).
Adjust the "Rolling Window" input to set the lookback period (default: 60 bars).
Modify the "1DTE Threshold" and "2DTE+ Threshold" inputs to tailor the levels at which you switch from 0DTE to 1DTE or multi-DTE strategies (default: 0.5 and 0.6).
Observe the OGDI line: values above the 1DTE threshold suggest favoring 1DTE strategies, while values above the 2DTE+ threshold indicate multi-DTE strategies may be more effective.
Use in conjunction with low VIX environments and uptrend legs for optimal results.

Smarter Money Concepts - Wyckoff Springs & Upthrusts [PhenLabs]📊Smarter Money Concepts - Wyckoff Springs & Upthrusts
Version: PineScript™v6
📌Description
Discover institutional manipulation in real-time with this advanced Wyckoff indicator that detects Springs (accumulation phases) and Upthrusts (distribution phases). It identifies when price tests support or resistance on high volume, followed by a strong recovery, signaling potential reversals where smart money accumulates or distributes positions. This tool solves the common problem of missing these subtle phase transitions, helping traders anticipate trend changes and avoid traps in volatile markets.
By combining volume spike detection, ATR-normalized recovery strength, and a sigmoid probability model, it filters out weak signals and highlights only high-confidence setups. Whether you’re swing trading or day trading, this indicator provides clear visual cues to align with institutional flows, improving entry timing and risk management.
🚀Points of Innovation
Sigmoid-based probability threshold for signal filtering, ensuring only statistically significant Wyckoff patterns trigger alerts
ATR-normalized recovery measurement that adapts to market volatility, unlike static recovery checks in traditional indicators
Customizable volume spike multiplier to distinguish institutional volume from retail noise
Integrated dashboard legend with position and size options for personalized chart visualization
Hidden probability plots for advanced users to analyze underlying math without chart clutter
🔧Core Components
Support/Resistance Calculator: Scans a user-defined lookback period to establish dynamic levels for Spring and Upthrust detection
Volume Spike Detector: Compares current volume to a 10-period SMA, multiplied by a configurable factor to identify significant surges
Recovery Strength Analyzer: Uses ATR to measure price recovery after breaks, normalizing for different market conditions
Probability Model: Applies sigmoid function to combine volume and recovery data, generating a confidence score for each potential signal
🔥Key Features
Spring Detection: Spots accumulation when price dips below support but recovers strongly, helping traders enter longs at potential bottoms
Upthrust Detection: Identifies distribution when price spikes above resistance but falls back, alerting to possible short opportunities at tops
Customizable Inputs: Adjust lookback, volume multiplier, ATR period, and probability threshold to match your trading style and market
Visual Signals: Clear + (green) and - (red) labels on charts for instant recognition of accumulation and distribution phases
Alert System: Triggers notifications for signals and probability thresholds, keeping you informed without constant monitoring
🎨Visualization
Spring Signal: Green upward label (+) below the bar, indicating strong recovery after support break for accumulation
Upthrust Signal: Red downward label (-) above the bar, showing failed breakout above resistance for distribution
Dashboard Legend: Customizable table explaining signals, positioned anywhere on the chart for quick reference
📖Usage Guidelines
Core Settings
Support/Resistance Lookback
Default: 20
Range: 5-50
Description: Sets bars back for S/R levels; lower for recent sensitivity, higher for stable long-term zones – ideal for spotting Wyckoff phases
Volume Spike Multiplier
Default: 1.5
Range: 1.0-3.0
Description: Multiplies 10-period volume SMA; higher values filter to significant spikes, confirming institutional involvement in patterns
ATR for Recovery Measurement
Default: 5
Range: 2-20
Description: ATR period for recovery strength; shorter for volatile markets, longer for smoother analysis of post-break recoveries
Phase Transition Probability Threshold
Default: 0.9
Range: 0.5-0.99
Description: Minimum sigmoid probability for signals; higher for strict filtering, ensuring only high-confidence Wyckoff setups
Display Settings
Dashboard Position
Default: Top Right
Range: Various positions
Description: Places legend table on chart; choose based on layout to avoid overlapping price action
Dashboard Text Size
Default: Normal
Range: Auto to Huge
Description: Adjusts legend text; larger for visibility, smaller for minimal space use
✅Best Use Cases
Swing Trading: Identify Springs for long entries in downtrends turning to accumulation
Day Trading: Catch Upthrusts for short scalps during intraday distribution at resistance
Trend Reversal Confirmation: Use in conjunction with other indicators to validate phase shifts in ranging markets
Volatility Plays: Spot signals in high-volume environments like news events for quick reversals
⚠️Limitations
May produce false signals in low-volume or sideways markets where volume spikes are unreliable
Depends on historical data, so performance varies in unprecedented market conditions or gaps
Probability model is statistical, not predictive, and cannot account for external factors like news
💡What Makes This Unique
Probability-Driven Filtering: Sigmoid model combines multiple factors for superior signal quality over basic Wyckoff detectors
Adaptive Recovery: ATR normalization ensures reliability across assets and timeframes, unlike fixed-threshold tools
User-Centric Design: Tooltips, customizable dashboard, and alerts make it accessible yet powerful for all trader levels
🔬How It Works
Calculate S/R Levels:
Uses the highest high and the lowest low over the lookback period to set dynamic zones
Establishes baseline for detecting breaks in Wyckoff patterns
Detect Breaks and Recovery:
Checks for price breaking support/resistance, then recovering on volume
Measures recovery strength via ATR for volatility adjustment
Apply Probability Model:
Combines volume spike and recovery into a sigmoid function for confidence score
Triggers signal only if above threshold, plotting visuals and alerts
💡Note:
For optimal results, combine with price action analysis and test settings on historical charts. Remember, Wyckoff patterns are most effective in trending markets – use lower probability thresholds for practice, then increase for live trading to focus on high-quality setups.

Whale VWAP HeatmapWhat it does
This indicator paints a heatmap around an anchored VWAP to make market context obvious at a glance.
Above VWAP → cyan background
Below VWAP → amber background
The farther price is from VWAP (in %), the stronger the color intensity.
How it works
Uses an anchored VWAP that resets on the period you choose (Session / Week / Month / Quarter / Year / Decade / Century / Earnings / Dividends / Splits).
Computes the percentage distance between price and VWAP, then maps that distance to background opacity.
Optional VWAP line can be shown/hidden.
Inputs (Settings)
Anchor Period — choose when VWAP resets (Session→Year, plus E/D/S options).
Source — price source (default hlc3).
Hide on D/W/M (Session only) — hides the script on Daily/Weekly/Monthly when anchor=Session (avoids NA behavior).
Enable Heatmap — turn background coloring on/off.
Max distance for full color (%) — at/above this % from VWAP, color hits full intensity (typical 0.5–2% depending on volatility).
Show VWAP Line / Line Color/Width — visual preference.
How to read it (quick playbook)
Context first: color tells you if price is trading above/below “fair value” (VWAP).
Intensity = how stretched price is from VWAP.
Use it to frame bias (above/below VWAP) and to avoid chasing extended moves.
Notes & limitations
Requires volume (VWAP is volume-weighted). If the data vendor doesn’t provide volume for the symbol, the script will stop.
For intraday, Session anchor is common. For swing/context, try Week or Month.

Keltner Alım Stratejisi v6 (10, 0.5)sadece keltner kanal girdilerinin değiştirilmesiyle oluşturulmuş bir göstergedir

ATR: Body % + Ranges and AnomaliesATR: Body % + Ranges and Anomalies
This indicator provides a dual analysis of price bars to help you better understand market dynamics and volatility. It combines two powerful concepts into one tool: a candle body percentage and a range analysis with an anomaly-excluding average.
Key Features:
1. Candle Body Percentage
This feature plots the size of the candle's body as a percentage of its total high-low range.
A high percentage (e.g., above the 50% gray line) indicates strong, directional movement. The more solid the body is relative to its wicks, the more conviction is behind that move.
The 100% red line marks "Marubozu" candles—bars with no wicks, showing absolute control by buyers or sellers.
2. Range Analysis with Anomalies
This is a unique part of the indicator that helps you identify and understand normal vs. abnormal volatility.
Custom SMA: It calculates an average range of the last N bars, but it smartly excludes "anomalous" bars (spikes or unusually small ranges) from the calculation. This gives you a more reliable baseline for normal volatility.
Anomaly Detection: Bars are colored differently based on their range:
Blue: Small anomalies (range less than 0.5 * ATR). These often occur during periods of low liquidity or indecision.
Red: Large anomalies (range greater than 1.8 * ATR). These can signal a sudden burst of volatility, breakout events, or capitulation.
ATR Range % Label: The label on the chart shows the current bar's range as a percentage of the custom SMA. This tells you how much larger or smaller the current bar's range is compared to a clean average.
How to Use:
Spotting Trends: Use the Body % to confirm the strength of a trend. A series of bars with high body percentages can indicate a strong, healthy trend.
Identifying Volatility: Use the Range Analysis to find areas of interest. A large red anomaly bar could signal a significant event, while a series of blue anomalies might suggest the market is in a tight consolidation before a breakout.
Contextual Analysis: The combination of these tools can provide powerful context. For example, a bar with a high Body % and a red anomaly color suggests a strong, volatile move that could be a turning point or the start of a major trend.
Experiment with the input settings to fine-tune the ATR and SMA periods for different timeframes and assets.

Dip Hunter [BackQuant]Dip Hunter
What this tool does in plain language
Dip Hunter is a pullback detector designed to find high quality buy-the-dip opportunities inside healthy trends and to avoid random knife catches. It watches for a quick drop from a recent high, checks that the drop happened with meaningful participation and volatility, verifies short-term weakness inside a larger uptrend, then scores the setup and paints the chart so you can act with confidence. It also draws clean entry lines, provides a meter that shows dip strength at a glance, and ships with alerts that match common execution workflows.
How Dip Hunter thinks
It defines a recent swing reference, measures how far price has dipped off that high, and only looks at candidates that meet your minimum percentage drop.
It confirms the dip with real activity by requiring a volume spike and a volatility spike.
It checks structure with two EMAs. Price should be weak in the short term while the larger context remains constructive.
It optionally requires a higher-timeframe trend to be up so you focus on pullbacks in trending markets.
It bundles those checks into a score and shows you the score on the candles and on a gradient meter.
When everything lines up it paints a green triangle below the bar, shades the background, and (if you wish) draws a horizontal entry line at your chosen level.
Inputs and what they mean
Dip Hunter Settings
• Vol Lookback and Vol Spike : The script computes an average volume over the lookback window and flags a spike when current volume is a multiple of that average. A multiplier of 2.0 means today’s volume must be at least double the average. This helps filter noise and focuses on dips that other traders actually traded.
• Fast EMA and Slow EMA : Short-term and medium-term structure references. A dip is more credible if price closes below the fast EMA while the fast EMA is still below the slow EMA during the pullback. That is classic corrective behavior inside a larger trend.
• Price Smooth : Optional smoothing length for price-derived series. Use this if you trade very noisy assets or low timeframes.
• Volatility Len and Vol Spike (volatility) : The script checks both standard deviation and true range against their own averages. If either expands beyond your multiplier the market confirms the move with range.
• Dip % and Lookback Bars : The engine finds the highest high over the lookback window, then computes the percentage drawdown from that high to the current close. Only dips larger than your threshold qualify.
Trend Filter
• Enable Trend Filter : When on, Dip Hunter will only trigger if the market is in an uptrend.
• Trend EMA Period : The longer EMA that defines the session’s backbone trend.
• Minimum Trend Strength : A small positive slope requirement. In practice this means the trend EMA should be rising, and price should be above it. You can raise the value to be more selective.
Entries
• Show Entry Lines : Draws a horizontal guide from the signal bar for a fixed number of bars. Great for limit orders, scaling, or re-tests.
• Line Length (bars) : How far the entry guide extends.
• Min Gap (bars) : Suppresses new entry lines if another dip fired recently. Prevents clutter during choppy sequences.
• Entry Price : Choose the line level. “Low” anchors at the signal candle’s low. “Close” anchors at the signal close. “Dip % Level” anchors at the theoretical level defined by recent_high × (1 − dip%). This lets you work resting orders at a consistent discount.
Heat / Meter
• Color Bars by Score : Colors each candle using a red→white→green gradient. Red is overheated, green is prime dip territory, white is neutral.
• Show Meter Table : Adds a compact gradient strip with a pointer that tracks the current score.
• Meter Cells and Meter Position : Resolution and placement of the meter.
UI Settings
• Show Dip Signals : Plots green triangles under qualifying bars and tints the background very lightly.
• Show EMAs : Plots fast, slow, and the trend EMA (if the trend filter is enabled).
• Bullish, Bearish, Neutral colors : Theme controls for shapes, fills, and bar painting.
Core calculations explained simply
Recent high and dip percent
The script finds the highest high over Lookback Bars , calls it “recent high,” then calculates:
dip% = (recent_high − close) ÷ recent_high × 100.
If dip% is larger than Dip % , condition one passes.
Volume confirmation
It computes a simple moving average of volume over Vol Lookback . If current volume ÷ average volume > Vol Spike , we have a participation spike. It also checks 5-bar ROC of volume. If ROC > 50 the spike is forceful. This gets an extra score point.
Volatility confirmation
Two independent checks:
• Standard deviation of closes vs its own average.
• True range vs ATR.
If either expands beyond Vol Spike (volatility) the move has range. This prevents false triggers from quiet drifts.
Short-term structure
Price should close below the Fast EMA and the fast EMA should be below the Slow EMA at the moment of the dip. That is the anatomy of a pullback rather than a full breakdown.
Macro trend context (optional)
When Enable Trend Filter is on, the Trend EMA must be rising and price must be above it. The logic prefers “micro weakness inside macro strength” which is the highest probability pattern for buying dips.
Signal formation
A valid dip requires:
• dip% > threshold
• volume spike true
• volatility spike true
• close below fast EMA
• fast EMA below slow EMA
If the trend filter is enabled, a rising trend EMA with price above it is also required. When all true, the triangle prints, the background tints, and optional entry lines are drawn.
Scoring and visuals
Binary checks into a continuous score
Each component contributes to a score between 0 and 1. The script then rescales to a centered range (−50 to +50).
• Low or negative scores imply “overheated” conditions and are shaded toward red.
• High positive scores imply “ripe for a dip buy” conditions and are shaded toward green.
• The gradient meter repeats the same logic, with a pointer so you can read the state quickly.
Bar coloring
If you enable “Color Bars by Score,” each candle inherits the gradient. This makes sequences obvious. Red clusters warn you not to buy. White means neutral. Increasing green suggests the pullback is maturing.
EMAs and the trend EMA
• Fast EMA turns down relative to the slow EMA inside the pullback.
• Trend EMA stays rising and above price once the dip exhausts, which is your cue to focus on long setups rather than bottom fishing in downtrends.
Entry lines
When a fresh signal fires and no other signal happened within Min Gap (bars) , the indicator draws a horizontal level for Line Length bars. Use these lines for limit entries at the low, at the close, or at the defined dip-percent level. This keeps your plan consistent across instruments.
Alerts and what they mean
• Market Overheated : Score is deeply negative. Do not chase. Wait for green.
• Close To A Dip : Score has reached a healthy level but the full signal did not trigger yet. Prepare orders.
• Dip Confirmed : First bar of a fresh validated dip. This is the most direct entry alert.
• Dip Active : The dip condition remains valid. You can scale in on re-tests.
• Dip Fading : Score crosses below 0.5 from above. Momentum of the setup is fading. Tighten stops or take partials.
• Trend Blocked Signal : All dip conditions passed but the trend filter is offside. Either reduce risk or skip, depending on your plan.
How to trade with Dip Hunter
Classic pullback in uptrend
Turn on the trend filter.
Watch for a Dip Confirmed alert with green triangle.
Use the entry line at “Dip % Level” to stage a limit order. This keeps your entries consistent across assets and timeframes.
Initial stop under the signal bar’s low or under the next lower EMA band.
First target at prior swing high, second target at a multiple of risk.
If you use partials, trail the remainder under the fast EMA once price reclaims it.
Aggressive intraday scalps
Lower Dip % and Lookback Bars so you catch shallow flags.
Keep Vol Spike meaningful so you only trade when participation appears.
Take quick partials when price reclaims the fast EMA, then exit on Dip Fading if momentum stalls.
Counter-trend probes
Disable the trend filter if you intentionally hunt reflex bounces in downtrends.
Require strong volume and volatility confirmation.
Use smaller size and faster targets. The meter should move quickly from red toward white and then green. If it does not, step aside.
Risk management templates
Stops
• Conservative: below the entry line minus a small buffer or below the signal bar’s low.
• Structural: below the slow EMA if you aim for swing continuation.
• Time stop: if price does not reclaim the fast EMA within N bars, exit.
Position sizing
Use the distance between the entry line and your structural stop to size consistently. The script’s entry lines make this distance obvious.
Scaling
• Scale at the entry line first touch.
• Add only if the meter stays green and price reclaims the fast EMA.
• Stop adding on a Dip Fading alert.
Tuning guide by market and timeframe
Equities daily
• Dip %: 1.5 to 3.0
• Lookback Bars: 5 to 10
• Vol Spike: 1.5 to 2.5
• Volatility Len: 14 to 20
• Trend EMA: 100 or 200
• Keep trend filter on for a cleaner list.
Futures and FX intraday
• Dip %: 0.4 to 1.2
• Lookback Bars: 3 to 7
• Vol Spike: 1.8 to 3.0
• Volatility Len: 10 to 14
• Use Min Gap to avoid clusters during news.
Crypto
• Dip %: 3.0 to 6.0 for majors on higher timeframes, lower on 15m to 1h
• Lookback Bars: 5 to 12
• Vol Spike: 1.8 to 3.0
• ATR and stdev checks help in erratic sessions.
Reading the chart at a glance
• Green triangle below the bar: a validated dip.
• Light green background: the current bar meets the full condition.
• Bar gradient: red is overheated, white is neutral, green is dip-friendly.
• EMAs: fast below slow during the pullback, then reclaim fast EMA on the bounce for quality continuation.
• Trend EMA: a rising spine when the filter is on.
• Entry line: a fixed level to anchor orders and risk.
• Meter pointer: right side toward “Dip” means conditions are maturing.
Why this combination reduces false positives
Any single criterion will trigger too often. Dip Hunter demands a dip off a recent high plus a volume surge plus a volatility expansion plus corrective EMA structure. Optional trend alignment pushes odds further in your favor. The score and meter visualize how many of these boxes you are actually ticking, which is more reliable than a binary dot.
Limitations and practical tips
• Thin or illiquid symbols can spoof volume spikes. Use larger Vol Lookback or raise Vol Spike .
• Sideways markets will show frequent small dips. Increase Dip % or keep the trend filter on.
• News candles can blow through entry lines. Widen stops or skip around known events.
• If you see many back-to-back triangles, raise Min Gap to keep only the best setups.
Quick setup recipes
• Clean swing trader: Trend filter on, Dip % 2.0 to 3.0, Vol Spike 2.0, Volatility Len 14, Fast 20 EMA, Slow 50 EMA, Trend 100 EMA.
• Fast intraday scalper: Trend filter off, Dip % 0.7 to 1.0, Vol Spike 2.5, Volatility Len 10, Fast 9 EMA, Slow 21 EMA, Min Gap 10 bars.
• Crypto swing: Trend filter on, Dip % 4.0, Vol Spike 2.0, Volatility Len 14, Fast 20 EMA, Slow 50 EMA, Trend 200 EMA.
Summary
Dip Hunter is a focused pullback engine. It quantifies a real dip off a recent high, validates it with volume and volatility expansion, enforces corrective structure with EMAs, and optionally restricts signals to an uptrend. The score, bar gradient, and meter make reading conditions instant. Entry lines and alerts turn that read into an executable plan. Tune the thresholds to your market and timeframe, then let the tool keep you patient in red, selective in white, and decisive in green.

VG 1.0This script is an enhanced version of SMC Structures and FVG with an advanced JSON-based alert system designed for seamless integration with webhooks and external applications (such as a Swift iOS app).
What it does
It detects and plots on the chart:
Fair Value Gaps (FVG) — bullish and bearish.
Break of Structure (BOS) and Change of Character (CHOCH).
Key Fibonacci levels (0.786, 0.705, 0.618, 0.5, 0.382) based on the current structure.
Additionally, it generates custom alerts:
FVG Alerts:
When a new FVG is created (bullish or bearish).
When an existing FVG gets mitigated.
BOS & CHOCH Alerts:
Includes breakout direction (bullish or bearish).
Fibonacci Alerts:
When price touches a configured level, with adjustable tick tolerance.
Alerts can be:
Declarative (alertcondition) for manual setup inside TradingView.
Programmatic (alert() JSON) for automated webhook delivery to your system or mobile app.
Key Features
Optional close confirmation to filter out false signals.
Standardized JSON format for direct API or mobile app integration.
Webhook-ready for automated push notifications.
Full visual control with lines, boxes, and labels.
Configurable tick tolerance for Fibonacci “touch” detection.

Quant Signals: Market Sentiment Monitor HUDWavelets & Scale Spectrum
This indicator is ideal for traders who adapt their strategy to market conditions — such as swing traders, intraday traders, and system developers.
Trend-followers can use it to confirm trending conditions before entering.
Mean-reversion traders can spot choppy markets where reversals are more likely.
Risk managers can monitor volatility shifts and regime changes to adjust position size or pause trading.
It works best as a market context filter — telling you the “weather” before you decide on the trade.
Wavelets are like tiny “measuring rulers” for price changes. Instead of looking at the whole chart at once, a wavelet looks at differences in price over a specific time scale — for example, 2 bars, 4 bars, 8 bars, and so on.
The scale spectrum is what you get when you measure volatility at several of these scales and then plot them against scale size.
If the spectrum forms a straight line on a log–log chart, it means price changes follow a consistent pattern across time scales (a power-law relationship).
The slope of that line gives the Hurst exponent (H) — telling you whether moves tend to persist (trend) or reverse (mean-revert).
The height of the line gives you the volatility (σ) — the average size of moves.
This approach works like a microscope, revealing whether the market’s behaviour is consistent across short-term and long-term horizons, and when that behaviour changes.
This tool applies a wavelet-based scale-spectrum analysis to price data to estimate three key market state measures inside a rolling window:
Hurst exponent (H) — measures persistence in price moves:
H > ~0.55 → market is trending (moves tend to continue).
H < ~0.45 → market is choppy/mean-reverting (moves tend to reverse).
Values near 0.5 indicate a neutral, random-walk-like regime.
Volatility (σ) — the average size of price swings at your chart’s timeframe, optionally annualized. Rising volatility means larger price moves, falling volatility means smaller moves.
Fit residual — how well the observed multi-scale volatility fits a clean power-law line. Low residual = stable behaviour; high residual = structural change (possible regime shift).
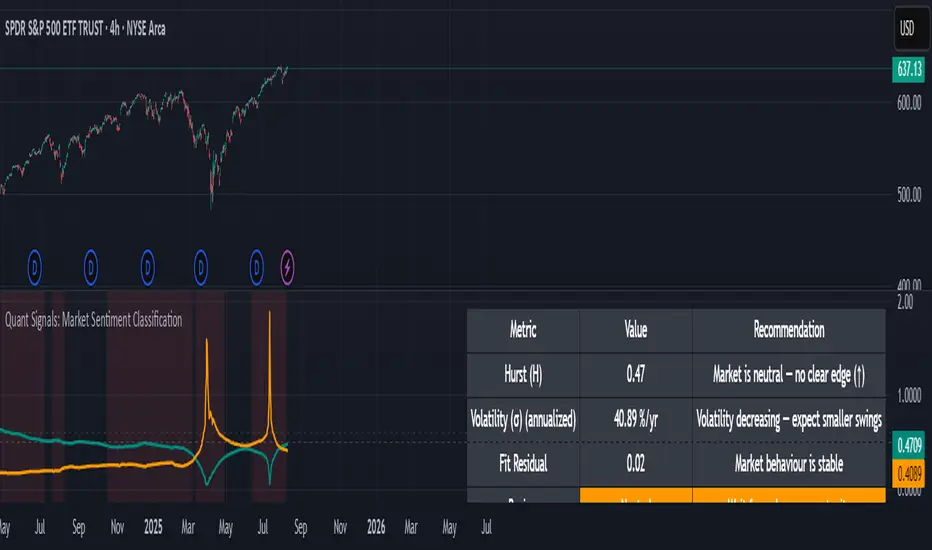
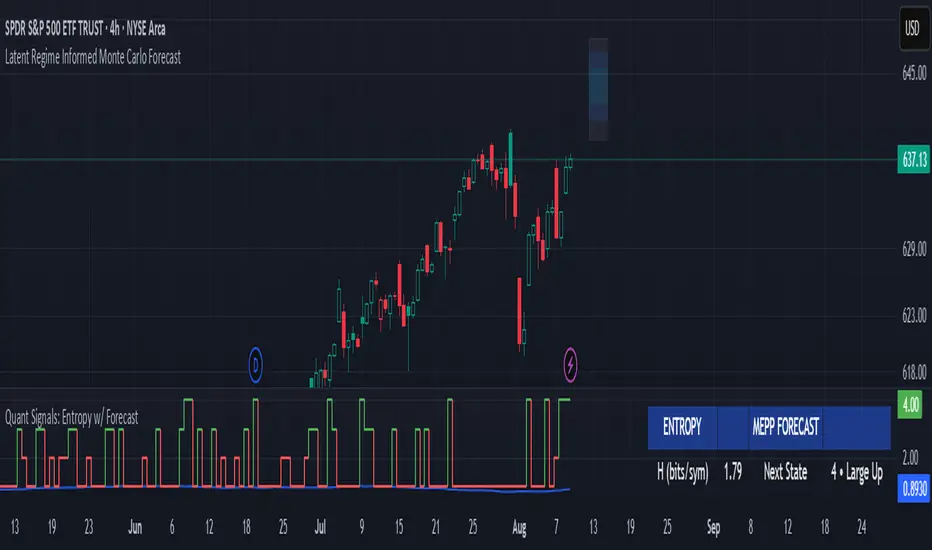
Quant Signals: Entropy w/ ForecastThis is the first of many quantitative signals I plan to create for TV users.
Most technical analysis (TA) tools—like moving averages, oscillators, or chart patterns—are heuristic: they’re based on visually identifiable shapes, threshold crossovers, or empirically chosen rules. These methods rarely quantify the information content or structural complexity of market data. By quantifying market predictability before making a forecast, this method filters out noise and focuses your trading only during statistically favorable conditions—something traditional TA cannot objectively measure.
This MEPP-based approach is quantitative and model-free:
It comes from information theory and measures Shannon entropy rate to assess how predictable the market is at any moment.
Instead of interpreting price formations, it uses a data-compression algorithm (Lempel–Ziv) to capture hidden structure in the sequence of returns.
Forecasts are generated using a principle from statistical physics (Maximum Entropy Production), not historical chart patterns.
In short, this method measures the market's predictability BEFORE deciding a directional forecast is worth trusting. This tool is to inform TA traders on the market's current regime, whether it is smooth and predictable or it is volatile and turbulent.
Technical Introduction:
In information theory, Shannon entropy measures the uncertainty (or information content) in a sequence of data. For markets, the entropy rate captures how much new information price returns generate over time:
Low entropy rate → price changes are more structured and predictable.
High entropy rate → price changes are more random and unpredictable.
By discretizing recent returns into quartile-based states, this indicator:
Calculates the normalized entropy rate as a regime filter.
Uses MEPP to forecast the next state that maximizes entropy production.
Displays both the regime status (predictable vs chaotic) and the forecast bias (bullish/bearish) in a dashboard.
Measurements & How to Use Them
TLDR: HIGH ENTROPY -> information generation/market shift -> Don't trust forecast/strategy
1. H (bits/sym)
Shannon entropy rate of the last μ discrete returns, in bits per symbol (0–2).
Lower → more predictable; higher → more random.
Use as a raw measure of market structure.
2. H_max (log₂Ω)
Theoretical maximum entropy for Ω states. Here Ω = 4 → H_max = 2.0 bits.
Reference value for normalization.
3. Entropy (norm)
H / H_max, scaled between 0 and 1.
< 0.5–0.6 → predictable regime; > 0.6 → chaotic regime.
Main regime filter — forecasts are more reliable when below your threshold.
4. Regime
Label based on Entropy (norm) vs your entThresh.
LOW (predictable) = higher odds forecast will be correct.
HIGH (chaotic) = forecasts less reliable.
5. Next State (MEPP Forecast)
Discrete return state (1–4) predicted to occur next, chosen to maximize entropy production:
Large Down (strong bearish)
Small Down (mild bearish)
Small Up (mild bullish)
Large Up (strong bullish)
Use as your bias direction.
6. Bias
Simplified label from the Next State:
States 1–2 = Bearish bias (red)
States 3–4 = Bullish bias (green)
Align strategy direction with bias only in LOW regime.
Clean Multi-Indicator Alignment System
Overview
A sophisticated multi-indicator alignment system designed for 24/7 trading across all markets, with pure signal-based exits and no time restrictions. Perfect for futures, forex, and crypto markets that operate around the clock.
Key Features
🎯 Multi-Indicator Confluence System
EMA Cross Strategy: Fast EMA (5) and Slow EMA (10) for precise trend direction
VWAP Integration: Institution-level price positioning analysis
RSI Momentum: 7-period RSI for momentum confirmation and reversal detection
MACD Signals: Optimized 8/17/5 configuration for scalping responsiveness
Volume Confirmation: Customizable volume multiplier (default 1.6x) for signal validation
🚀 Advanced Entry Logic
Initial Full Alignment: Requires all 5 indicators + volume confirmation
Smart Continuation Entries: EMA9 pullback entries when trend momentum remains intact
Flexible Time Controls: Optional session filtering or 24/7 operation
🎪 Pure Signal-Based Exits
No Forced Closes: Positions exit only on technical signal reversals
Dual Exit Conditions: EMA9 breakdown + RSI flip OR MACD cross + EMA20 breakdown
Trend Following: Allows profitable trends to run their full course
Perfect for Swing Scalping: Ideal for multi-session position holding
📊 Visual Interface
Real-Time Status Dashboard: Live alignment monitoring for all indicators
Color-Coded Candles: Instant visual confirmation of entry/exit signals
Clean Chart Display: Toggle-able EMAs and VWAP with professional styling
Signal Differentiation: Clear labels for entries, X-crosses for exits
🔔 Alert System
Entry Notifications: Separate alerts for buy/sell signals
Exit Warnings: Technical breakdown alerts for position management
Mobile Ready: Push notifications to TradingView mobile app
Market Applications
Perfect For:
Gold Futures (GC): 24-hour precious metals trading
NASDAQ Futures (NQ): High-volatility index scalping
Forex Markets: Currency pairs with continuous operation
Crypto Trading: 24/7 cryptocurrency momentum plays
Energy Futures: Oil, gas, and commodity swing trades
Optimal Timeframes:
1-5 Minutes: Ultra-fast scalping during high volatility
5-15 Minutes: Balanced approach for most markets
15-30 Minutes: Swing scalping for trend following
🧠 Smart Position Management
Tracks implied position direction
Prevents conflicting signals
Allows trend continuation entries
State-aware exit logic
⚡ Scalping Optimized
Fast-reacting indicators with shorter periods
Volume-based confirmation reduces false signals
Clean entry/exit visualization
Minimal lag for time-sensitive trades
Configuration Options
All parameters fully customizable:
EMA Lengths: Adjustable from 1-30 periods
RSI Period: 1-14 range for different market conditions
MACD Settings: Fast (1-15), Slow (1-30), Signal (1-10)
Volume Confirmation: 0.5-5.0x multiplier range
Visual Preferences: Colors, displays, and table options
Risk Management Features
Clear visual exit signals prevent emotion-based decisions
Volume confirmation reduces false breakouts
Multi-indicator confluence improves signal quality
Optional time filtering for session-specific strategies
Best Use Cases
Futures Scalping: NQ, ES, GC during active sessions
Forex Swing Trading: Major pairs during overlap periods
Crypto Momentum: Bitcoin, Ethereum trend following
24/7 Automated Systems: Algorithmic trading implementation
Multi-Market Scanning: Portfolio-wide signal monitoring

TOTAL3ES/ETH Mean ReversionTOTAL3ES/ETH Mean Reversion Indicator
Overview
The TOTAL3ES/ETH Mean Reversion indicator is a specialized tool designed exclusively for analyzing the ratio between TOTAL3 excluding stablecoins (TOTAL3ES) and Ethereum's market capitalization. This ratio provides crucial insights into the relative performance and valuation cycles between altcoins and ETH, making it an essential tool for cryptocurrency portfolio allocation and market timing decisions.
What This Indicator Measures
This indicator tracks the market cap ratio of all altcoins (excluding ETH and stablecoins) to Ethereum's market cap. When the ratio is:
Above 1.0 (Parity): Altcoins have a larger combined market cap than ETH
Below 1.0 (Parity): ETH's market cap exceeds the combined altcoin market cap
Key Features
Historical Context
Historical Range: 0.64 (July 2017 low) to 3.49 (all-time high)
Midpoint: 2.065 - the mathematical center of the historical range
Parity Line: 1.0 - the psychological level where altcoins = ETH market cap
Mean Reversion Zones
The indicator identifies extreme valuation zones based on historical data:
Upper Extreme Zone (~2.92 at 80% threshold): Suggests altcoins may be overvalued relative to ETH
Lower Extreme Zone (~1.21 at 80% threshold): Suggests altcoins may be undervalued relative to ETH
Visual Elements
Color-coded zones: Red shading for bearish reversion areas, green for bullish reversion areas
Multiple reference lines: Parity, midpoint, and historical extremes
Information table: Real-time metrics including current ratio, range position, and reversion pressure
Customizable display: Toggle zones, lines, and adjust transparency
How to Use This Indicator
Market Cycle Analysis
Extreme High Zone (Red): When ratio enters this zone, consider potential ETH outperformance
Extreme Low Zone (Green): When ratio enters this zone, consider potential altcoin season
Parity Crossovers: Monitor when ratio crosses above/below 1.0 for sentiment shifts
Portfolio Allocation Signals
High Ratio Values: May indicate overextended altcoin valuations relative to ETH
Low Ratio Values: May suggest undervalued altcoins relative to ETH
Midpoint Reversions: Historical tendency to revert toward the 2.065 midpoint
Alert Conditions
The indicator includes built-in alerts for:
Entering extreme high/low zones
Parity crossovers (above/below 1.0)
Mean reversion signals
Input Parameters
Display Settings
Show Reversion Zones: Toggle colored extreme zones on/off
Show Midpoint: Display the historical midpoint line
Show Parity Line: Show the 1.0 parity reference line
Zone Transparency: Adjust shaded area opacity (70-95%)
Calculation Settings
Reversion Strength Period: Moving average period for reversion calculations (10-50)
Extreme Threshold: Percentage of historical range defining extreme zones (0.5-1.0)
Information Table Metrics
The bottom-right table displays:
Current Ratio: Live TOTAL3ES/ETH value
Range Position: Current position within historical range (%)
From Parity: Distance from 1.0 parity level (%)
Reversion Pressure: Intensity of mean reversion forces (%)
Zone: Current market zone classification
Historical Range: Reference boundaries (0.64 - 3.49)
Midpoint: Historical center value
Important Notes
Chart Compatibility
Exclusively designed for CRYPTOCAP:TOTAL3ES/CRYPTOCAP:ETH
Built-in validation ensures proper chart usage
Will display error message if applied to incorrect charts
Trading Considerations
This is an analytical tool, not trading advice
Mean reversion is a tendency, not a guarantee
Consider multiple timeframes and confirmations
Factor in overall market conditions and trends
Risk Disclaimer
Past performance does not guarantee future results. Cryptocurrency markets are highly volatile and unpredictable. Always conduct your own research and consider your risk tolerance before making investment decisions.
Ideal Use Cases
Portfolio rebalancing between ETH and altcoins
Market cycle timing for position adjustments
Sentiment analysis of crypto market phases
Long-term allocation strategies based on historical patterns
Risk management through extreme zone identification
This indicator serves as a quantitative framework for understanding the cyclical relationship between Ethereum and the broader altcoin market, helping traders and investors make more informed allocation decisions based on historical valuation patterns.ons
- Factor in overall market conditions and trends
### Risk Disclaimer
Past performance does not guarantee future results. Cryptocurrency markets are highly volatile and unpredictable. Always conduct your own research and consider your risk tolerance before making investment decisions.

Historical Year OverlayThis script allows you to simply source any historical calendar year and overlay it over any other year (usually a historical year overlaying a year in the future). It was made using an LLM for coding help and logic.
It is great for working out potential pivots and it also maps the previous profit/loss from the source year over the plot year so that we can see the connection to price levels throughout the plot year and also with the yearly close (we get a horizontal line for the close).
It uses the year open as a price reference to plot the P&L over the plot year (if use plot year option is selected).
if the year has not started yet you can use the "manual opening price" OR it will auto set to the current price (great for "replay mode", it will catch the actual opening price once it happens).
The settings are self explanatory. Choose a source year and plot year.
Choose a multiplier if you'd like (it simply multiplies the plot year P&L by that number; ie: 1 means the same as it was, 0.5 means half of what is was, 2 means 2x the source P&L)
The resolution is max default 50 line segments but you can simplify if you'd like.
I've released the code open-source so you can see what it is doing.
Please update it with all the enhancements you can think of.
Please let me know if you do this as I will be very interested!

MTF Dashboard 9 Timeframes + Signals# MTF Dashboard Pro - Multi-Timeframe Confluence Analysis System
## WHAT THIS SCRIPT DOES
This script creates a comprehensive dashboard that simultaneously analyzes market conditions across 9 different timeframes (1m, 5m, 15m, 30m, 1H, 4H, Daily, Weekly, Monthly) using a proprietary confluence scoring methodology. Unlike simple multi-timeframe displays that show individual indicators separately, this script combines trend analysis, momentum, volatility signals, and volume analysis into unified confluence scores for each timeframe.
## WHY THIS COMBINATION IS ORIGINAL AND USEFUL
**The Problem Solved:** Most traders manually check multiple timeframes and struggle to quickly assess overall market bias when different timeframes show conflicting signals. Existing MTF scripts typically display individual indicators without synthesizing them into actionable intelligence.
**The Solution:** This script implements a mathematical confluence algorithm that:
- Weights each indicator's signal strength (trend direction, RSI momentum, MACD volatility, volume analysis)
- Calculates normalized scores across all active timeframes
- Determines overall market bias with statistical confidence levels
- Provides instant visual feedback through color-coded symbols and star ratings
**Unique Features:**
1. **Confluence Scoring Algorithm**: Mathematically combines multiple indicator signals into a single confidence rating per timeframe
2. **Market Bias Engine**: Automatically calculates overall directional bias with percentage strength across all selected timeframes
3. **Dynamic Display System**: Real-time updates with customizable layouts, color schemes, and selective timeframe activation
4. **Statistical Analysis**: Provides bullish/bearish vote counts and overall confluence percentages
## HOW THE SCRIPT WORKS TECHNICALLY
### Core Calculation Methodology:
**1. Trend Analysis (EMA-based):**
- Fast EMA (default: 9) vs Slow EMA (default: 21) crossover analysis
- Returns values: +1 (bullish), -1 (bearish), 0 (neutral)
**2. Momentum Analysis (RSI-based):**
- RSI levels: >70 (strong bullish +2), >50 (bullish +1), <30 (strong bearish -2), <50 (bearish -1)
- Provides overbought/oversold context for trend confirmation
**3. Volatility Analysis (MACD-based):**
- MACD line vs Signal line positioning
- Histogram strength comparison with previous bar
- Combined score considering both direction and momentum strength
**4. Volume Analysis:**
- Current volume vs 20-period moving average
- Thresholds: >150% MA (strong +2), >100% MA (bullish +1), <50% MA (weak -2)
**5. Confluence Calculation:**
```
Confluence Score = (Trend + RSI + MACD + Volume) / 4.0
```
**6. Market Bias Determination:**
- Counts bullish vs bearish signals across all active timeframes
- Calculates bias strength percentage: |Bullish Count - Bearish Count| / Total Active TFs * 100
- Determines overall market direction: BULLISH, BEARISH, or NEUTRAL
### Multi-Timeframe Implementation:
Uses `request.security()` calls to fetch data from each timeframe, ensuring all calculations are performed on the respective timeframe's data rather than current chart timeframe, providing accurate multi-timeframe analysis.
## HOW TO USE THIS SCRIPT
### Initial Setup:
1. **Timeframe Selection**: Enable/disable specific timeframes in "Timeframe Selection" group based on your trading style
2. **Indicator Configuration**: Adjust EMA periods (Fast: 9, Slow: 21), RSI length (14), and MACD settings (12/26/9) to match your analysis preferences
3. **Display Options**: Choose table position, text size, and color scheme for optimal visibility
### Reading the Dashboard:
**Symbol Interpretation:**
- ⬆⬆ = Strong bullish signal (score ≥ 2)
- ⬆ = Bullish signal (score > 0)
- ➡ = Neutral signal (score = 0)
- ⬇ = Bearish signal (score < 0)
- ⬇⬇ = Strong bearish signal (score ≤ -2)
**Confluence Stars:**
- ★★★★★ = Very high confidence (score > 0.75)
- ★★★★☆ = High confidence (score > 0.5)
- ★★★☆☆ = Medium confidence (score > 0.25)
- ★★☆☆☆ = Low confidence (score > 0)
- ★☆☆☆☆ = Very low confidence (score > -0.25)
**Market Bias Section:**
- Shows overall market direction across all active timeframes
- Strength percentage indicates conviction level
- Overall confluence score represents average agreement across timeframes
### Trading Applications:
**Entry Signals:**
- Look for high confluence (4-5 stars) across multiple timeframes in same direction
- Higher timeframe alignment provides stronger signal validation
- Use confluence percentage >75% for high-probability setups
**Risk Management:**
- Lower timeframe conflicts may indicate choppy conditions
- Neutral bias suggests ranging market - adjust position sizing
- Strong bias with high confluence supports larger position sizes
**Timeframe Harmony:**
- Short-term trades: Focus on 1m-1H alignment
- Swing trades: Emphasize 1H-Daily alignment
- Position trades: Prioritize Daily-Monthly confluence
## SCRIPT SETTINGS EXPLANATION
### Dashboard Settings:
- **Table Position**: Choose optimal location (Top Right recommended for most layouts)
- **Text Size**: Adjust based on screen resolution and preferences
- **Color Scheme**: Professional (default), Classic, Vibrant, or Dark themes
- **Background Color/Transparency**: Customize table appearance
### Timeframe Selection:
All timeframes optional - activate based on trading timeframe preference:
- **Lower Timeframes (1m-30m)**: Scalping and day trading
- **Medium Timeframes (1H-4H)**: Swing trading
- **Higher Timeframes (D-M)**: Position trading and long-term bias
### Indicator Parameters:
- **Fast EMA (Default: 9)**: Shorter period for trend sensitivity
- **Slow EMA (Default: 21)**: Longer period for trend confirmation
- **RSI Length (Default: 14)**: Standard momentum calculation period
- **MACD Settings (12/26/9)**: Standard MACD configuration for volatility analysis
### Alert Configuration:
- **Strong Signals**: Alerts when confluence >75% with clear directional bias
- **High Confluence**: Alerts when multiple timeframes strongly agree
- All alerts use `alert.freq_once_per_bar` to prevent spam
## VISUAL FEATURES
### Chart Elements:
- **Background Coloring**: Subtle background tint reflects overall market bias
- **Signal Labels**: Strong buy/sell labels appear on chart during high-confluence signals
- **Clean Presentation**: Dashboard overlays chart without interfering with price action
### Color Coding:
- **Green/Bullish**: Various green shades for positive signals
- **Red/Bearish**: Various red shades for negative signals
- **Gray/Neutral**: Neutral color for conflicting or weak signals
- **Transparency**: Configurable transparency maintains chart readability
## IMPORTANT USAGE NOTES
**Realistic Expectations:**
- This tool provides analysis framework, not trading signals
- Always combine with proper risk management
- Past performance does not guarantee future results
- Market conditions can change rapidly - use appropriate position sizing
**Best Practices:**
- Verify signals with additional analysis methods
- Consider fundamental factors affecting the instrument
- Use appropriate timeframes for your trading style
- Regular parameter optimization may be beneficial for different market conditions
**Limitations:**
- Effectiveness may vary across different instruments and market conditions
- Confluence scoring is mathematical model - not predictive guarantee
- Requires understanding of underlying indicators for optimal use
This script serves as a comprehensive analysis tool for traders who need quick, organized access to multi-timeframe market information with statistical confidence levels.

Hurst Exponent Adaptive Filter (HEAF) [PhenLabs]📊 PhenLabs - Hurst Exponent Adaptive Filter (HEAF)
Version: PineScript™ v6
📌 Description
The Hurst Exponent Adaptive Filter (HEAF) is an advanced Pine Script indicator designed to dynamically adjust moving average calculations based on real time market regimes detected through the Hurst Exponent. The intention behind the creation of this indicator was not a buy/sell indicator but rather a tool to help sharpen traders ability to distinguish regimes in the market mathematically rather than guessing. By analyzing price persistence, it identifies whether the market is trending, mean-reverting, or exhibiting random walk behavior, automatically adapting the MA length to provide more responsive alerts in volatile conditions and smoother outputs in stable ones. This helps traders avoid false signals in choppy markets and capitalize on strong trends, making it ideal for adaptive trading strategies across various timeframes and assets.
Unlike traditional moving averages, HEAF incorporates fractal dimension analysis via the Hurst Exponent to create a self-tuning filter that evolves with market conditions. Traders benefit from visual cues like color coded regimes, adaptive bands for volatility channels, and an information panel that suggests appropriate strategies, enhancing decision making without constant manual adjustments by the user.
🚀 Points of Innovation
Dynamic MA length adjustment using Hurst Exponent for regime-aware filtering, reducing lag in trends and noise in ranges.
Integrated market regime classification (trending, mean-reverting, random) with visual and alert-based notifications.
Customizable color themes and adaptive bands that incorporate ATR for volatility-adjusted channels.
Built-in information panel providing real-time strategy recommendations based on detected regimes.
Power sensitivity parameter to fine-tune adaptation aggressiveness, allowing personalization for different trading styles.
Support for multiple MA types (EMA, SMA, WMA) within an adaptive framework.
🔧 Core Components
Hurst Exponent Calculation: Computes the fractal dimension of price series over a user-defined lookback to detect market persistence or anti-persistence.
Adaptive Length Mechanism: Maps Hurst values to MA lengths between minimum and maximum bounds, using a power function for sensitivity control.
Moving Average Engine: Applies the chosen MA type (EMA, SMA, or WMA) to the adaptive length for the core filter line.
Adaptive Bands: Creates upper and lower channels using ATR multiplied by a band factor, scaled to the current adaptive length.
Regime Detection: Classifies market state with thresholds (e.g., >0.55 for trending) and triggers alerts on regime changes.
Visualization System: Includes gradient fills, regime-colored MA lines, and an info panel for at-a-glance insights.
🔥 Key Features
Regime-Adaptive Filtering: Automatically shortens MA in mean-reverting markets for quick responses and lengthens it in trends for smoother signals, helping traders stay aligned with market dynamics.
Custom Alerts: Notifies on regime shifts and band breakouts, enabling timely strategy adjustments like switching to trend-following in bullish regimes.
Visual Enhancements: Color-coded MA lines, gradient band fills, and an optional info panel that displays market state and trading tips, improving chart readability.
Flexible Settings: Adjustable lookback, min/max lengths, sensitivity power, MA type, and themes to suit various assets and timeframes.
Band Breakout Signals: Highlights potential overbought/oversold conditions via ATR-based channels, useful for entry/exit timing.
🎨 Visualization
Main Adaptive MA Line: Plotted with regime-based colors (e.g., green for trending) to visually indicate market state and filter position relative to price.
Adaptive Bands: Upper and lower lines with gradient fills between them, showing volatility channels that widen in random regimes and tighten in trends.
Price vs. MA Fills: Color-coded areas between price and MA (e.g., bullish green above MA in trending modes) for quick trend strength assessment.
Information Panel: Top-right table displaying current regime (e.g., "Trending Market") and strategy suggestions like "Follow trends" or "Trade ranges."
📖 Usage Guidelines
Core Settings
Hurst Lookback Period
Default: 100
Range: 20-500
Description: Sets the period for Hurst Exponent calculation; longer values provide more stable regime detection but may lag, while shorter ones are more responsive to recent changes.
Minimum MA Length
Default: 10
Range: 5-50
Description: Defines the shortest possible adaptive MA length, ideal for fast responses in mean-reverting conditions.
Maximum MA Length
Default: 200
Range: 50-500
Description: Sets the longest adaptive MA length for smoothing in strong trends; adjust based on asset volatility.
Sensitivity Power
Default: 2.0
Range: 1.0-5.0
Description: Controls how aggressively the length adapts to Hurst changes; higher values make it more sensitive to regime shifts.
MA Type
Default: EMA
Options: EMA, SMA, WMA
Description: Chooses the moving average calculation method; EMA is more responsive, while SMA/WMA offer different weighting.
🖼️ Visual Settings
Show Adaptive Bands
Default: True
Description: Toggles visibility of upper/lower bands for volatility channels.
Band Multiplier
Default: 1.5
Range: 0.5-3.0
Description: Scales band width using ATR; higher values create wider channels for conservative signals.
Show Information Panel
Default: True
Description: Displays regime info and strategy tips in a top-right panel.
MA Line Width
Default: 2
Range: 1-5
Description: Adjusts thickness of the main MA line for better visibility.
Color Theme
Default: Blue
Options: Blue, Classic, Dark Purple, Vibrant
Description: Selects color scheme for MA, bands, and fills to match user preferences.
🚨 Alert Settings
Enable Alerts
Default: True
Description: Activates notifications for regime changes and band breakouts.
✅ Best Use Cases
Trend-Following Strategies: In detected trending regimes, use the adaptive MA as a trailing stop or entry filter for momentum trades.
Range Trading: During mean-reverting periods, monitor band breakouts for buying dips or selling rallies within channels.
Risk Management in Random Markets: Reduce exposure when random walk is detected, using tight stops suggested in the info panel.
Multi-Timeframe Analysis: Apply on higher timeframes for regime confirmation, then drill down to lower ones for entries.
Volatility-Based Entries: Use upper/lower band crossovers as signals in adaptive channels for overbought/oversold trades.
⚠️ Limitations
Lagging in Transitions: Regime detection may delay during rapid market shifts, requiring confirmation from other tools.
Not a Standalone System: Best used in conjunction with other indicators; random regimes can lead to whipsaws if traded aggressively.
Parameter Sensitivity: Optimal settings vary by asset and timeframe, necessitating backtesting.
💡 What Makes This Unique
Hurst-Driven Adaptation: Unlike static MAs, it uses fractal analysis to self-tune, providing regime-specific filtering that's rare in standard indicators.
Integrated Strategy Guidance: The info panel offers actionable tips tied to regimes, bridging analysis and execution.
Multi-Regime Visualization: Combines adaptive bands, colored fills, and alerts in one tool for comprehensive market state awareness.
🔬 How It Works
Hurst Exponent Computation:
Calculates log returns over the lookback period to derive the rescaled range (R/S) ratio.
Normalizes to a 0-1 value, where >0.55 indicates trending, <0.45 mean-reverting, and in-between random.
Length Adaptation:
Maps normalized Hurst to an MA length via a power function, clamping between min and max.
Applies the selected MA type to close prices using this dynamic length.
Visualization and Signals:
Plots the MA with regime colors, adds ATR-based bands, and fills areas for trend strength.
Triggers alerts on regime changes or band crosses, with the info panel suggesting strategies like momentum riding in trends.
💡 Note:
For optimal results, backtest settings on your preferred assets and combine with volume or momentum indicators. Remember, no indicator guarantees profits—use with proper risk management. Access premium features and support at PhenLabs.

Game Theory Trading StrategyGame Theory Trading Strategy: Explanation and Working Logic
This Pine Script (version 5) code implements a trading strategy named "Game Theory Trading Strategy" in TradingView. Unlike the previous indicator, this is a full-fledged strategy with automated entry/exit rules, risk management, and backtesting capabilities. It uses Game Theory principles to analyze market behavior, focusing on herd behavior, institutional flows, liquidity traps, and Nash equilibrium to generate buy (long) and sell (short) signals. Below, I'll explain the strategy's purpose, working logic, key components, and usage tips in detail.
1. General Description
Purpose: The strategy identifies high-probability trading opportunities by combining Game Theory concepts (herd behavior, contrarian signals, Nash equilibrium) with technical analysis (RSI, volume, momentum). It aims to exploit market inefficiencies caused by retail herd behavior, institutional flows, and liquidity traps. The strategy is designed for automated trading with defined risk management (stop-loss/take-profit) and position sizing based on market conditions.
Key Features:
Herd Behavior Detection: Identifies retail panic buying/selling using RSI and volume spikes.
Liquidity Traps: Detects stop-loss hunting zones where price breaks recent highs/lows but reverses.
Institutional Flow Analysis: Tracks high-volume institutional activity via Accumulation/Distribution and volume spikes.
Nash Equilibrium: Uses statistical price bands to assess whether the market is in equilibrium or deviated (overbought/oversold).
Risk Management: Configurable stop-loss (SL) and take-profit (TP) percentages, dynamic position sizing based on Game Theory (minimax principle).
Visualization: Displays Nash bands, signals, background colors, and two tables (Game Theory status and backtest results).
Backtesting: Tracks performance metrics like win rate, profit factor, max drawdown, and Sharpe ratio.
Strategy Settings:
Initial capital: $10,000.
Pyramiding: Up to 3 positions.
Position size: 10% of equity (default_qty_value=10).
Configurable inputs for RSI, volume, liquidity, institutional flow, Nash equilibrium, and risk management.
Warning: This is a strategy, not just an indicator. It executes trades automatically in TradingView's Strategy Tester. Always backtest thoroughly and use proper risk management before live trading.
2. Working Logic (Step by Step)
The strategy processes each bar (candle) to generate signals, manage positions, and update performance metrics. Here's how it works:
a. Input Parameters
The inputs are grouped for clarity:
Herd Behavior (🐑):
RSI Period (14): For overbought/oversold detection.
Volume MA Period (20): To calculate average volume for spike detection.
Herd Threshold (2.0): Volume multiplier for detecting herd activity.
Liquidity Analysis (💧):
Liquidity Lookback (50): Bars to check for recent highs/lows.
Liquidity Sensitivity (1.5): Volume multiplier for trap detection.
Institutional Flow (🏦):
Institutional Volume Multiplier (2.5): For detecting large volume spikes.
Institutional MA Period (21): For Accumulation/Distribution smoothing.
Nash Equilibrium (⚖️):
Nash Period (100): For calculating price mean and standard deviation.
Nash Deviation (0.02): Multiplier for equilibrium bands.
Risk Management (🛡️):
Use Stop-Loss (true): Enables SL at 2% below/above entry price.
Use Take-Profit (true): Enables TP at 5% above/below entry price.
b. Herd Behavior Detection
RSI (14): Checks for extreme conditions:
Overbought: RSI > 70 (potential herd buying).
Oversold: RSI < 30 (potential herd selling).
Volume Spike: Volume > SMA(20) x 2.0 (herd_threshold).
Momentum: Price change over 10 bars (close - close ) compared to its SMA(20).
Herd Signals:
Herd Buying: RSI > 70 + volume spike + positive momentum = Retail buying frenzy (red background).
Herd Selling: RSI < 30 + volume spike + negative momentum = Retail selling panic (green background).
c. Liquidity Trap Detection
Recent Highs/Lows: Calculated over 50 bars (liquidity_lookback).
Psychological Levels: Nearest round numbers (e.g., $100, $110) as potential stop-loss zones.
Trap Conditions:
Up Trap: Price breaks recent high, closes below it, with a volume spike (volume > SMA x 1.5).
Down Trap: Price breaks recent low, closes above it, with a volume spike.
Visualization: Traps are marked with small red/green crosses above/below bars.
d. Institutional Flow Analysis
Volume Check: Volume > SMA(20) x 2.5 (inst_volume_mult) = Institutional activity.
Accumulation/Distribution (AD):
Formula: ((close - low) - (high - close)) / (high - low) * volume, cumulated over time.
Smoothed with SMA(21) (inst_ma_length).
Accumulation: AD > MA + high volume = Institutions buying.
Distribution: AD < MA + high volume = Institutions selling.
Smart Money Index: (close - open) / (high - low) * volume, smoothed with SMA(20). Positive = Smart money buying.
e. Nash Equilibrium
Calculation:
Price mean: SMA(100) (nash_period).
Standard deviation: stdev(100).
Upper Nash: Mean + StdDev x 0.02 (nash_deviation).
Lower Nash: Mean - StdDev x 0.02.
Conditions:
Near Equilibrium: Price between upper and lower Nash bands (stable market).
Above Nash: Price > upper band (overbought, sell potential).
Below Nash: Price < lower band (oversold, buy potential).
Visualization: Orange line (mean), red/green lines (upper/lower bands).
f. Game Theory Signals
The strategy generates three types of signals, combined into long/short triggers:
Contrarian Signals:
Buy: Herd selling + (accumulation or down trap) = Go against retail panic.
Sell: Herd buying + (distribution or up trap).
Momentum Signals:
Buy: Below Nash + positive smart money + no herd buying.
Sell: Above Nash + negative smart money + no herd selling.
Nash Reversion Signals:
Buy: Below Nash + rising close (close > close ) + volume > MA.
Sell: Above Nash + falling close + volume > MA.
Final Signals:
Long Signal: Contrarian buy OR momentum buy OR Nash reversion buy.
Short Signal: Contrarian sell OR momentum sell OR Nash reversion sell.
g. Position Management
Position Sizing (Minimax Principle):
Default: 1.0 (10% of equity).
In Nash equilibrium: Reduced to 0.5 (conservative).
During institutional volume: Increased to 1.5 (aggressive).
Entries:
Long: If long_signal is true and no existing long position (strategy.position_size <= 0).
Short: If short_signal is true and no existing short position (strategy.position_size >= 0).
Exits:
Stop-Loss: If use_sl=true, set at 2% below/above entry price.
Take-Profit: If use_tp=true, set at 5% above/below entry price.
Pyramiding: Up to 3 concurrent positions allowed.
h. Visualization
Nash Bands: Orange (mean), red (upper), green (lower).
Background Colors:
Herd buying: Red (90% transparency).
Herd selling: Green.
Institutional volume: Blue.
Signals:
Contrarian buy/sell: Green/red triangles below/above bars.
Liquidity traps: Red/green crosses above/below bars.
Tables:
Game Theory Table (Top-Right):
Herd Behavior: Buying frenzy, selling panic, or normal.
Institutional Flow: Accumulation, distribution, or neutral.
Nash Equilibrium: In equilibrium, above, or below.
Liquidity Status: Trap detected or safe.
Position Suggestion: Long (green), Short (red), or Wait (gray).
Backtest Table (Bottom-Right):
Total Trades: Number of closed trades.
Win Rate: Percentage of winning trades.
Net Profit/Loss: In USD, colored green/red.
Profit Factor: Gross profit / gross loss.
Max Drawdown: Peak-to-trough equity drop (%).
Win/Loss Trades: Number of winning/losing trades.
Risk/Reward Ratio: Simplified Sharpe ratio (returns / drawdown).
Avg Win/Loss Ratio: Average win per trade / average loss per trade.
Last Update: Current time.
i. Backtesting Metrics
Tracks:
Total trades, winning/losing trades.
Win rate (%).
Net profit ($).
Profit factor (gross profit / gross loss).
Max drawdown (%).
Simplified Sharpe ratio (returns / drawdown).
Average win/loss ratio.
Updates metrics on each closed trade.
Displays a label on the last bar with backtest period, total trades, win rate, and net profit.
j. Alerts
No explicit alertconditions defined, but you can add them for long_signal and short_signal (e.g., alertcondition(long_signal, "GT Long Entry", "Long Signal Detected!")).
Use TradingView's alert system with Strategy Tester outputs.
3. Usage Tips
Timeframe: Best for H1-D1 timeframes. Shorter frames (M1-M15) may produce noisy signals.
Settings:
Risk Management: Adjust sl_percent (e.g., 1% for volatile markets) and tp_percent (e.g., 3% for scalping).
Herd Threshold: Increase to 2.5 for stricter herd detection in choppy markets.
Liquidity Lookback: Reduce to 20 for faster markets (e.g., crypto).
Nash Period: Increase to 200 for longer-term analysis.
Backtesting:
Use TradingView's Strategy Tester to evaluate performance.
Check win rate (>50%), profit factor (>1.5), and max drawdown (<20%) for viability.
Test on different assets/timeframes to ensure robustness.
Live Trading:
Start with a demo account.
Combine with other indicators (e.g., EMAs, support/resistance) for confirmation.
Monitor liquidity traps and institutional flow for context.
Risk Management:
Always use SL/TP to limit losses.
Adjust position_size for risk tolerance (e.g., 5% of equity for conservative trading).
Avoid over-leveraging (pyramiding=3 can amplify risk).
Troubleshooting:
If no trades are executed, check signal conditions (e.g., lower herd_threshold or liquidity_sensitivity).
Ensure sufficient historical data for Nash and liquidity calculations.
If tables overlap, adjust position.top_right/bottom_right coordinates.
4. Key Differences from the Previous Indicator
Indicator vs. Strategy: The previous code was an indicator (VP + Game Theory Integrated Strategy) focused on visualization and alerts. This is a strategy with automated entries/exits and backtesting.
Volume Profile: Absent in this strategy, making it lighter but less focused on high-volume zones.
Wick Analysis: Not included here, unlike the previous indicator's heavy reliance on wick patterns.
Backtesting: This strategy includes detailed performance metrics and a backtest table, absent in the indicator.
Simpler Signals: Focuses on Game Theory signals (contrarian, momentum, Nash reversion) without the "Power/Ultra Power" hierarchy.
Risk Management: Explicit SL/TP and dynamic position sizing, not present in the indicator.
5. Conclusion
The "Game Theory Trading Strategy" is a sophisticated system leveraging herd behavior, institutional flows, liquidity traps, and Nash equilibrium to trade market inefficiencies. It’s designed for traders who understand Game Theory principles and want automated execution with robust risk management. However, it requires thorough backtesting and parameter optimization for specific markets (e.g., forex, crypto, stocks). The backtest table and visual aids make it easy to monitor performance, but always combine with other analysis tools and proper capital management.
If you need help with backtesting, adding alerts, or optimizing parameters, let me know!

Mig Trade Model - Kill Zones
Key features:
Liquidity Hunt Detection: Spots aggressive moves that "hunt" stops beyond recent swing highs/lows.
Consolidation Filter: Requires 1-3 small-range candles after a hunt before confirming with a strong candle.
Bias Application: Uses daily open/close to auto-detect bias or allows manual override.
Kill Zone Restriction: Limits signals to London (default: 7-10 AM UTC) and NY (default: 12-3 PM UTC) sessions for better relevance in active markets.
This strategy is inspired by smart money concepts (SMC) and ICT (Inner Circle Trader) methodologies, aiming to capture venom-like "stings" in price action where liquidity is grabbed before reversals.
How It Works
ATR Calculation: Uses a user-defined ATR length (default: 14) to measure volatility, which scales candle body and range thresholds.
Bias Determination:
Auto: Compares daily close to open (bullish if close > open).
Manual: User selects "Bullish" or "Bearish."
Strong Candles:
Bullish: Green candle with body > 2x ATR (configurable).
Bearish: Red candle with body > 2x ATR.
Small Range Candles:
Candles where high-low < 0.5x ATR (configurable).
Liquidity Hunt:
Bullish Hunt: Strong bearish candle making a new low below the past swing low (default: 10 bars).
Bearish Hunt: Strong bullish candle making a new high above the past swing high.
Signal Generation:
After a hunt, counts 1-3 small-range candles.
Confirms with a strong candle in the opposite direction (e.g., strong bullish after bearish hunt).
Resets if >3 small candles or an opposing strong candle appears.
Kill Zone Filter:
Checks if the current bar's time (in UTC) falls within London or NY Kill Zones.
Only allows final "Buy" (bullish entry) or "Sell" (bearish entry) if bias matches and in Kill Zone.
Plots:
Yellow circle (below): Bullish liquidity hunt.
Orange circle (above): Bearish liquidity hunt.
Blue diamond (below): Raw bullish signal.
Purple diamond (above): Raw bearish signal.
Green triangle up ("Buy"): Filtered bullish entry.
Red triangle down ("Sell"): Filtered bearish entry.
Inputs
Bias: "Auto" (default), "Bullish", or "Bearish" – Controls signal direction based on daily trend.
ATR Length: 14 (default) – Period for ATR calculation.
Swing Length for Liquidity Hunt: 10 (default) – Bars to look back for swing highs/lows.
Strong Candle Body Multiplier (x ATR): 2.0 (default) – Threshold for strong candle bodies.
Small Range Multiplier (x ATR): 0.5 (default) – Threshold for small-range candles.
London Kill Zone Start/End Hour (UTC): 7/10 (default) – Customize London session hours.
NY Kill Zone Start/End Hour (UTC): 12/15 (default) – Customize New York session hours.
Usage Tips
Timeframe: Best on lower timeframes (e.g., 5-15 min) for intraday trading, especially forex pairs like EURUSD or GBPUSD.
Timezone Adjustment: Inputs are in UTC. If your chart is in a different timezone (e.g., EST = UTC-5), adjust hours accordingly (e.g., London: 2-5 AM EST → 7-10 UTC).
Risk Management: Use with stop-loss (e.g., beyond the hunt low/high) and take-profit based on ATR multiples. Not financial advice—backtest thoroughly.
Customization: Tweak multipliers for different assets; higher for volatile cryptos, lower for stocks.
Limitations: Relies on historical data; may generate false signals in ranging markets. Combine with other indicators like volume or support/resistance.
This indicator is for educational purposes. Always use discretion and proper risk management in live trading. If you find it useful, feel free to share feedback or suggestions!

Trend Strength Index [Alpha Extract]The Trend Strength Index leverages Volume Weighted Moving Average (VWMA) and Average True Range (ATR) to quantify trend intensity in cryptocurrency markets, particularly Bitcoin. The combination of VWMA and ATR is particularly powerful because VWMA provides a more accurate representation of the market's true average price by weighting periods of higher trading volume more heavily—capturing genuine momentum driven by increased participation rather than treating all price action equally, which is crucial in volatile assets like Bitcoin where volume spikes often signal institutional interest or market shifts.
Meanwhile, ATR normalizes this measurement for volatility, ensuring that trend strength readings remain comparable across different market conditions; without ATR's adjustment, raw price deviations from the mean could appear artificially inflated during high-volatility periods (like during news events or liquidations) or understated in low-volatility sideways markets, leading to misleading signals. Together, they create a volatility-adjusted, volume-sensitive metric that reliably distinguishes between meaningful trend developments and noise.
This indicator measures the normalized distance between price and its volume-weighted mean, providing a clear visualization of trend strength while accounting for market volatility. It helps traders identify periods of strong directional movement versus consolidation, with color-coded gradients for intuitive interpretation.
🔶 CALCULATION
The indicator processes price data through these analytical stages:
Volume Weighted Moving Average: Computes a smoothed average weighted by trading volume
Volatility Normalization: Uses ATR to account for market volatility
Distance Measurement: Calculates absolute deviation between current price and VWMA
Strength Normalization: Divides price deviation by ATR for a volatility-adjusted metric
Formula:
VWMA = Volume-Weighted Moving Average of Close over specified length
ATR = Average True Range over specified length
Price Distance = |Close - VWMA|
Trend Strength = Price Distance / ATR
🔶 DETAILS Visual Features:
VWMA Line: Blue line overlay on the price chart representing the volume-weighted mean
Trend Strength Area: Histogram-style area plot with dynamic color gradient (red for weak trends, transitioning through orange and yellow to green for strong trends)
Threshold Line: Horizontal red line at the customizable Trend Enter level
Background Highlight: Subtle green background when trend strength exceeds the enter threshold for strong trend visualization
Alert System: Triggers notifications for strong trend detection
Interpretation:
0-Weak (Red): Minimal trend strength, potential consolidation or ranging market
Mid-Range (Orange/Yellow): Building momentum, watch for breakout potential
At/Above Enter Threshold (Green): Strong trend conditions, potential for continued directional moves
Threshold Crossing: Trend strength crossing above the enter level signals increasing conviction in the current direction
Color Transitions: Gradual shifts from warm (red/orange) to cool (green) tones indicate strengthening trends
🔶 EXAMPLES
Strong Trend Entry: When trend strength crosses above the enter threshold (e.g., 1.2), it identifies the onset of a powerful move where price deviates significantly from the mean.
Example: During a rally, trend strength rising from yellow (around 1.0) to green (1.2+) often precedes sustained upward momentum, providing entry opportunities for trend followers.
Consolidation Detection: Low trend strength values in red shades (below 0.5) highlight periods of low volatility and mean reversion potential.
Example: After a sharp sell-off, persistent red values signal a likely sideways phase, allowing traders to avoid whipsaws and wait for orange/yellow transitions as a precursor to recovery.
Volatility-Adjusted Pullbacks: In volatile markets, the ATR component ensures trend strength remains accurate; a dip back to yellow from green during minor corrections can indicate healthy pullbacks within a strong trend.
Example: Trend strength briefly falling to yellow levels (e.g., 0.8-1.1) after hitting green provides profit-taking signals without invalidating the overall bullish bias if the VWMA holds as support.
Threshold Alert Integration: The alert condition combines strength value with the enter threshold for timely notifications.
Example: Receiving a "Strong Trend Detected" alert when the area plot turns green helps confirm Bitcoin's breakout from consolidation, aligning with increased volume for higher-probability trades.
🔶 SETTINGS
Customization Options:
Lengths: VWMA length (default 14), ATR length (default 14)
Thresholds: Trend enter (default 1.2, step 0.1), trend exit (default 1.15, for potential future signal enhancements)
Visuals: Automatic color scaling with red at 0, transitioning to green at/above enter threshold
Alert Conditions: Strong trend detection (when strength > enter)
The Trend Strength Index equips traders with a robust, easy-to-interpret tool for gauging trend intensity in volatile markets like Bitcoin. By normalizing price deviations against volatility, it delivers reliable signals for identifying high-momentum opportunities while the gradient coloring and alerts facilitate quick assessments in both trending and choppy conditions.
