VOLX+ VWAP Range BandsVOLX+ plots multiple VWAP-weighted high/low channels across different lookback periods to show how price behaves relative to short-term and long-term value zones.
Instead of using a single VWAP line, this tool creates four rolling VWAP envelopes:
Short-term range (fast reaction)
Mid-term range
Mid-mid range (transitional layer)
Long-term range (macro context)
Each band is computed as:
VWAP-High = SMA(high × volume, length) ÷ SMA(volume, length)
VWAP-Low = SMA(low × volume, length) ÷ SMA(volume, length)
This produces dynamic price channels that account for both price and traded volume, offering a clearer sense of where the market is accepting or rejecting value.
What It Shows
Four VWAP-weighted high/low bands
A short-term VWAP midline
Price line
Three SMAs for trend context
Optional visibility switches for each VWAP band
The filled regions between VWAP highs and lows create a layered “value map,” helping you interpret:
Trend continuation (price hugging outer VWAP bands)
Mean reversion (price returning toward inner bands)
Volatility contraction/expansion
Shifts in short-term vs long-term balance
🧠 How to Use
Use the short-term band for day-trading context or detecting short-term excess.
Use mid-term and mid-mid bands to confirm developing structure.
Use the long-term VWAP band to understand broader value zones.
Combine VWAP bands with SMAs and structure analysis for confluence.
This indicator is intended for price interpretation and analytical support.
✔ Does Not Repaint
The script uses rolling VWAP formulas and standard MAs; everything is stable and non-repainting.
Wyszukaj w skryptach "西班牙人VS奥萨苏纳"

3D Globe - World Stock MarketsA real-time 3D rotating globe visualization showing 19 major stock exchanges worldwide with their current trading status.
█ OVERVIEW
This indicator displays an interactive 3D Earth globe that rotates in sync with the sun (sun-synchronous rotation), providing an intuitive view of which markets are currently in daylight/trading hours. Each stock exchange is plotted at its geographic location with color-coded status indicators.
█ FEATURES
- 3D Globe Rendering
- Spherical projection with proper visibility culling (hidden side not drawn)
- 27 country/region polygons derived from Natural Earth 110m data
- Optional latitude/longitude grid (meridians every 20°, parallels every 20°)
- Sun-synchronous auto-rotation: the globe rotates 15° per hour to follow real-world daylight
- 19 Stock Exchanges Tracked
NYSE, NASDAQ, TSX (Toronto), BMV (Mexico), B3 (São Paulo), LSE (London), EURONEXT (Paris), XETRA (Frankfurt), SIX (Zurich), MOEX (Moscow), TADAWUL (Riyadh), JSE (Johannesburg), NSE (Mumbai), SSE (Shanghai), HKEX (Hong Kong), TSE (Tokyo), KRX (Seoul), SGX (Singapore), ASX (Sydney)
- Real-Time Market Table (10 columns)
- Status indicator (● open / ○ closed)
- Exchange name and country with flag
- Local time with seconds (HH:MM:SS)
- Opening time
- Time to open (for closed markets)
- Time since open (for open markets)
- Time to close (for open markets)
- Index name (S&P500, FTSE, DAX, CAC40, N225, HSI, etc.)
- Daily % change with color coding
█ HOW IT WORKS
The globe uses standard 3D mathematics:
1. Geographic coordinates (lat/lon) are converted to 3D Cartesian points on a unit sphere
2. Rotation matrices are applied for X-axis tilt and Y-axis rotation (sun position)
3. Points are projected onto 2D screen space
4. Visibility culling hides points on the far side of the globe (z < 0)
Performance optimization: The globe redraws only when the minute changes, while the market table updates every tick for accurate second-by-second timing.
█ SETTINGS
Globe Group:
- Globe Size: Adjustable radius (15-60)
- Show Grid: Toggle latitude/longitude lines
- Fill Continents: Toggle solid land fill vs outline only
Style Group:
- Background, Ocean, Land, Land Border, Grid colors
- Open/Closed market indicator colors
- Globe border color
Table Group:
- Position: Left or Right side
- Show/Hide market table
█ DATA SOURCES
- Geographic data: Simplified polygons derived from Natural Earth (public domain)
- Market hours: Standard trading sessions (does not account for holidays)
- Index data: Real-time from TradingView (TVC, MOEX, TADAWUL, NSE, SSE, ASX providers)
█ LIMITATIONS
- Market hours are based on regular sessions only (no pre/post market, no holiday calendar)
- UTC offsets are fixed (no automatic DST adjustment)
- Some index symbols may not be available in all regions
█ USE CASES
- Quick visual overview of global market activity
- Identifying trading opportunities across time zones
- Understanding market session overlaps
- Educational tool for learning about world markets
Open-source under Mozilla Public License 2.0.

5MA+スーパートレンド + Disparity Scalping (SIMPLE FILTER)5MA + ATR Trend Filter + Disparity Scalping
This indicator combines a five-EMA trend framework, an ATR-based trailing trend line, a volatility breakout detector, and an ultra-fast scalping module using RSI and custom momentum prediction.
It is designed for both trend continuation and rapid reversal trading.
🔹 Main Components
1️⃣ Five-EMA Trend Framework
Uses 9 / 20 / 50 / 100 / 200 EMAs
Identifies short-term and long-term market direction
Provides dynamic support and resistance
Helpful for determining breakout vs. pullback conditions
2️⃣ ATR-Based Trailing Trend Line
Uses ATR multiplier to build a trailing stop line
Color change indicates directional shift
Works as a trend filter or trailing stop reference
Helps avoid counter-trend trades during strong trends
3️⃣ High-Volatility Breakout Detector (Optimized for Fast Markets)
Uses ATR expansion, Bollinger band breakout, and volatility comparison (HV vs RV)
Detects sudden market acceleration
Generates breakout BUY/SELL signals when volatility pressure aligns with direction
Useful for explosive markets such as gold or crypto, but compatible with all assets
4️⃣ Ultra-Fast Disparity Scalper
Measures price distance from EMA5 and EMA10
Uses RSI for exhaustion filtering
Predicts momentum turns with a custom RVI-based algorithm
Generates early reversal BUY/SELL signals before full market reaction
Designed for scalping in high-speed environments
5️⃣ Simple Overheat Filter
Blocks trades in extremely overbought/oversold zones
Gray signals indicate low-quality trade setups to avoid
Helps remove “chasing” entries during excessive deviation
🎯 Best Use Cases
Scalping fast reversals
Entering trends after confirmed volatility breakouts
Filtering entries during extreme overbought/oversold phases
Combining EMA structure with breakout momentum
⚠️ Important Notice
This tool is designed to support decision making, not guarantee trade results.
For best performance, combine with:
Price action (market structure)
Volume/volatility context
Support and resistance analysis
🏷️ Short Description (for compact summary)
Five-EMA trend structure with ATR trailing filter, volatility breakout detection, and ultra-fast scalping using RSI + momentum prediction. Suitable for both rapid reversals and trend continuation setups.

5MA+TrendMagic + Disparity Scalping (SIMPLE FILTER)5MA + Trend Filter + Disparity Scalping
This multi-purpose indicator combines a five-EMA trend structure, a volatility-based trend filter, and an ultra-fast scalping module to detect both trend continuation and sharp reversal opportunities.
It is suitable for scalping, day trading, and trend-following strategies.
🔹 Main Components
1️⃣ Five-EMA Trend Structure
Displays 9 / 20 / 50 / 100 / 200 EMA levels
Helps identify short-term and long-term market direction
Useful for support and resistance during trending markets
2️⃣ Volatility-Driven Trend Filter
Uses CCI and ATR to form a dynamic trailing line
The line switches color based on momentum direction
Can act as a trailing stop or trend confirmation filter
Helps avoid counter-trend entries
3️⃣ High-Volatility GOLD Signal
Detects sudden volatility expansions using ATR, Bollinger metrics, and volatility comparison (HV vs RV)
Marks rapid breakout situations with potential continuation setups
Available for all assets, optimized for highly volatile markets
4️⃣ Ultra-Fast Disparity Scalper
Measures price deviation from EMA5 and EMA10
Confirms exhaustion using RSI + momentum prediction from a custom RVI model
Generates early BUY/SELL reversal markers
Detects momentum shifts before price fully reacts
5️⃣ Simple Overheat Filter
Prevents trades in extremely overbought/oversold zones
Gray-colored signals indicate unsafe trades to avoid
🎯 Best Use Cases
Catching early reversals during fast movement
Identifying strong trend continuation after volatility expansion
Avoiding low-probability scalps in overheated conditions
Applying EMA structure for confluence with price action
⚠️ Note
This indicator is a decision-support tool, not a standalone signal generator.
For best precision, combine with:
Market structure
Volume analysis
Support / resistance levels
🏷️ Short Description (for compact field)
Multi-function tool combining 5EMA structure, volatility-based trend filtering, and ultra-fast reversal scalping using RSI + custom RVI momentum. Ideal for both trend continuation and rapid reversals.

ICT Fair Value Gap Detector [Eˣ]⚡ Fair Value Gap Detector
Overview
The Fair Value Gap Detector automatically identifies price imbalances on your charts - the inefficiencies left behind when price moves too quickly. This indicator reveals where price is likely to return for "rebalancing", based on ICT (Inner Circle Trader) concepts of market efficiency.
━━━━━━━━━━━━━━━━━━━━━━━━━━━━
🎯 What This Indicator Does
Detects Fair Value Gaps:
• 🟢 Bullish FVG - Gap left below during aggressive upward move
• 🔴 Bearish FVG - Gap left above during aggressive downward move
• Automatically identifies 3-candle price inefficiencies
• Works on all timeframes and instruments
Smart Fill Tracking:
• Full Fill - Price completely fills the gap
• 50% Fill - Price fills half the gap (critical level)
• Partial Fill - Price touches gap edge
• Real-time fill percentage tracking
• Auto-removes filled gaps (optional)
Professional Features:
• Active Gap Highlighting - Shows nearest unfilled gap
• Distance Calculator - Displays how far price is from gaps
• Market Bias - Analysis based on gap balance
• Size Filtering - Minimum gap size to avoid noise
• Visual Clarity - Clean boxes with color-coding
━━━━━━━━━━━━━━━━━━━━━━━━━━━━
📚 Understanding Fair Value Gaps
What Are Fair Value Gaps?
Fair Value Gaps (FVGs), also known as imbalances or inefficiencies, are zones where price moved so quickly that normal trading didn't occur. They represent:
• Price Imbalance - One-sided aggressive buying or selling
• Unfair Pricing - Some participants didn't get to trade at these levels
• Market Inefficiency - Supply/demand equilibrium was disrupted
• Rebalancing Zones - Price often returns to "fill" these gaps
The ICT Concept:
Markets constantly seek equilibrium (fair value). When price moves too fast:
1. It leaves gaps where normal trading didn't happen
2. These gaps represent unfair/inefficient pricing
3. Market has a tendency to return and "rebalance"
4. Smart money knows this and trades the fills
Why FVGs Work:
• Unfilled Orders - Traders who missed the move have pending orders in the gap
• Algorithmic Trading - Algos programmed to exploit inefficiencies
• Market Psychology - Traders notice gaps and place orders there
• Institutional Behavior - Smart money uses gaps for entries/exits
FVG vs Regular Gaps:
• Regular Gaps - Occur at market open, between daily closes
• Fair Value Gaps - Occur intraday, between 3 consecutive candles
• FVGs happen more frequently and on all timeframes
• FVGs are more tradeable for intraday/swing traders
━━━━━━━━━━━━━━━━━━━━━━━━━━━━
🟢 Bullish Fair Value Gaps Explained
How They Form:
Bullish FVG requires 3 candles:
1. Candle 1 - Any candle (sets the high reference)
2. Candle 2 - Strong bullish candle (aggressive buying)
3. Candle 3 - Continuation candle
The Gap: Candle 3's LOW is above Candle 1's HIGH = Gap left unfilled
Visual Example:
```
Candle 3: Low at $105 ──────────┐
│ ← GAP (Bullish FVG)
Candle 2: Strong bullish │
│
Candle 1: High at $100 ──────────┘
```
What It Means:
• Price jumped from $100 to $105+ so fast, no trading occurred in between
• This $100-$105 zone is "unfair" - buyers/sellers didn't get to trade there
• Market may return to this zone to "rebalance"
• When price returns, it often acts as support
Trading Bullish FVGs:
Strategy:
• Wait for price to retrace down into the bullish FVG (green box)
• Look for rejection/bounce from the gap zone
• Enter long when price respects the FVG as support
• Stop loss: Below the FVG
• Target: Previous high or opposite FVG
Best Entry Points:
• 50% Fill: Price enters middle of gap (highest probability)
• Full Fill: Price touches bottom of gap (aggressive entry)
• Tap & Reject: Price quickly enters and exits gap (strong signal)
Example Trade:
• Bullish FVG forms: $50,000 - $50,500 (500 point gap)
• Price rallies to $52,000 then retraces
• Price drops to $50,250 (50% of gap filled)
• Bullish reversal candle appears
• Enter long at $50,500, stop at $49,800
• Target: $52,000+
━━━━━━━━━━━━━━━━━━━━━━━━━━━━
🔴 Bearish Fair Value Gaps Explained
How They Form:
Bearish FVG requires 3 candles:
1. Candle 1 - Any candle (sets the low reference)
2. Candle 2 - Strong bearish candle (aggressive selling)
3. Candle 3 - Continuation candle
The Gap: Candle 3's HIGH is below Candle 1's LOW = Gap left unfilled
Visual Example:
```
Candle 1: Low at $100 ───────────┐
│ ← GAP (Bearish FVG)
Candle 2: Strong bearish │
│
Candle 3: High at $95 ───────────┘
```
What It Means:
• Price dropped from $100 to $95 so fast, no trading occurred in between
• This $95-$100 zone is "unfair" - buyers/sellers didn't get to trade there
• Market may return to this zone to "rebalance"
• When price returns, it often acts as resistance
Trading Bearish FVGs:
Strategy:
• Wait for price to retrace up into the bearish FVG (red box)
• Look for rejection/reversal from the gap zone
• Enter short when price respects the FVG as resistance
• Stop loss: Above the FVG
• Target: Previous low or opposite FVG
Best Entry Points:
• 50% Fill: Price enters middle of gap (highest probability)
• Full Fill: Price touches top of gap (aggressive entry)
• Tap & Reject: Price quickly enters and exits gap (strong signal)
Example Trade:
• Bearish FVG forms: $48,000 - $48,500 (500 point gap)
• Price drops to $46,000 then retraces
• Price rallies to $48,250 (50% of gap filled)
• Bearish reversal candle appears
• Enter short at $48,000, stop at $48,700
• Target: $46,000-
━━━━━━━━━━━━━━━━━━━━━━━━━━━━
📊 How To Use This Indicator
Strategy 1: FVG Rebalancing (Classic)
Best For: Swing trading, reversal trading
Timeframes: 15min, 1H, 4H
Win Rate: 65-75%
Entry Rules:
1. Identify unfilled FVG (bright color, not gray)
2. Wait for price to return to the gap
3. Best entry: 50% fill of the gap
4. Look for reversal confirmation:
• Bullish FVG: Pin bar, engulfing, hammer
• Bearish FVG: Shooting star, bearish engulfing
5. Enter when price bounces/rejects from FVG
6. Stop: Beyond opposite side of FVG
7. Target: 2-3R or previous high/low
Why It Works: 70%+ of FVGs get filled, and 60%+ show reaction
Strategy 2: FVG + Order Block Confluence
Best For: High-probability setups
Timeframes: 1H, 4H
Win Rate: 75-85%
Entry Rules:
1. Find FVG that overlaps with Order Block
2. This creates a "super zone" of confluence
3. Wait for price to return to this zone
4. Enter on first touch of confluence zone
5. Stop: Beyond the confluence zone
6. Target: 3-4R
Why It Works: Double institutional concepts = highest probability
Strategy 3: Multi-Timeframe FVG
Best For: Position trading, major moves
Timeframes: Combine Daily + 4H or 4H + 1H
Win Rate: 70-80%
Entry Rules:
1. Identify large FVG on higher timeframe (Daily/4H)
2. Wait for price to enter this HTF FVG
3. Switch to lower timeframe (4H/1H)
4. Look for LTF FVG within HTF FVG in same direction
5. Trade the LTF FVG fill
6. Stop: Below LTF FVG
7. Target: Exit HTF FVG or beyond
Why It Works: Timeframe alignment = institutional consensus
Strategy 4: FVG Rejection Trade
Best For: Quick scalps, day trading
Timeframes: 5min, 15min
Win Rate: 60-70%
Entry Rules:
1. Price enters FVG zone
2. Immediate rejection (strong reversal candle)
3. Enter on close of rejection candle
4. Tight stop beyond FVG
5. Quick target: 1-2R
Why It Works: Strong rejection = institutional defense of level
Strategy 5: FVG-to-FVG Trading
Best For: Momentum trading
Timeframes: 15min, 1H
Win Rate: 55-65%
Entry Rules:
1. Identify bullish FVG below and bearish FVG above
2. Enter long at bullish FVG, target bearish FVG
3. Or enter short at bearish FVG, target bullish FVG
4. Price often moves from one imbalance to another
5. Stop: Beyond trading FVG
6. Target: Opposite FVG
Why It Works: Price rebalances from one inefficiency to another
━━━━━━━━━━━━━━━━━━━━━━━━━━━━
⚙️ Settings Explained
Display Settings
Show Bullish/Bearish FVG
• Toggle each type on/off independently
• Customize colors for each FVG type
• Default: Green (bullish), Red (bearish)
• Tip: Use colors that contrast with your chart
Max FVG to Display (Default: 20)
• Limits how many gaps are shown at once
• Lower (10-15): Cleaner chart, recent gaps only
• Higher (30-50): More historical context
• Recommended: 15-25 for most trading
Show FVG Labels (Default: ON)
• Displays "FVG+" and "FVG-" text on gaps
• Shows 🎯 on active (nearest) gap
• Shows fill percentage (e.g., "FVG+ 35%")
• Turn OFF for minimal appearance
• Recommended: Keep ON for clarity
Extend Gaps (bars) (Default: 50)
• How far to extend gap boxes to the right
• Lower (20-30): Shorter boxes
• Higher (100+): Longer boxes, easier to see
• Gaps auto-extend until filled or limit reached
• Recommended: 40-60 bars
Filters
Min Gap Size % (Default: 0.05)
• Minimum gap size as percentage of price
• Filters out tiny, insignificant gaps
• Crypto: 0.05-0.15% (high volatility)
• Forex: 0.03-0.10% (moderate volatility)
• Stocks: 0.05-0.20% (varies by stock)
• Indices: 0.05-0.15%
• Adjust based on instrument's average move
Show Filled Gaps (Default: OFF)
• When ON: Shows gray boxes for filled gaps
• When OFF: Gaps disappear after mitigation
• Use ON: For learning and backtesting
• Use OFF: For clean, active trading view
Advanced Settings
Auto-Detect Mitigation (Default: ON)
• Automatically tracks when gaps are filled
• Updates fill percentage in real-time
• Marks gaps as "mitigated" when filled
• Recommended: Keep ON
Mitigation Type (Default: Full)
• Full: Gap considered filled when price closes through entire gap
• 50%: Gap considered filled at 50% (critical level)
• Partial: Gap considered filled on first touch
• For learning: Use "Full"
• For aggressive trading: Use "50%"
• For conservative trading: Use "Partial"
Highlight Nearest Gap (Default: ON)
• Highlights the closest unfilled gap to current price
• Active gap shown with 🎯 emoji and brighter color
• Helps focus on most relevant opportunity
• Recommended: Keep ON
━━━━━━━━━━━━━━━━━━━━━━━━━━━━
📱 Info Panel Guide
Bullish FVG Count
• Number of active (unfilled) bullish fair value gaps
• Higher number = More potential support zones below
• Multiple bullish FVGs = Strong rebalancing demand
Bearish FVG Count
• Number of active (unfilled) bearish fair value gaps
• Higher number = More potential resistance zones above
• Multiple bearish FVGs = Strong rebalancing supply
Bias Indicator
• ⬆ Bullish: More bullish FVGs than bearish
• ⬇ Bearish: More bearish FVGs than bullish
• ↔ Neutral: Equal FVGs on both sides
• Market tends to fill nearby gaps first
Target Indicator
• Shows nearest unfilled gap and distance
• Example: "Bull FVG -1.25%" = Bullish gap is 1.25% below price
• Example: "Bear FVG +0.85%" = Bearish gap is 0.85% above price
• Watch for price to reach these targets
━━━━━━━━━━━━━━━━━━━━━━━━━━━━
📱 Alert Setup
This indicator includes 4 alert types:
1. Price Entering Bullish FVG
• Fires when price drops into a bullish gap
• Action: Watch for bounce/reversal
• High-probability long setup developing
2. Price Entering Bearish FVG
• Fires when price rallies into a bearish gap
• Action: Watch for rejection/reversal
• High-probability short setup developing
3. New Bullish FVG Detected
• Fires when a new bullish gap forms
• Action: Mark zone for future fill
• New rebalancing target below identified
4. New Bearish FVG Detected
• Fires when a new bearish gap forms
• Action: Mark zone for future fill
• New rebalancing target above identified
To Set Up Alerts:
1. Click "Alert" button (clock icon)
2. Select "Fair Value Gap Detector"
3. Choose your alert condition
4. Configure notification method
5. Click "Create"
Pro Tip: Set "Price Entering" alerts to catch fills in real-time
━━━━━━━━━━━━━━━━━━━━━━━━━━━━
💎 Pro Tips & Best Practices
✅ DO:
• Wait for 50% fill - Middle of gap has highest win rate (65-70%)
• Use confirmation - Don't trade just because price touched gap
• Combine with structure - FVG + support/resistance = high probability
• Trade first fill - Unfilled gaps have better success rate than refilled
• Respect full fills - Once fully filled, gap is less reliable
• Use multiple timeframes - HTF FVGs are stronger than LTF
• Check session timing - FVGs work best during London/NY sessions
• Follow the bias - More bullish FVGs = favor longs
⚠️ DON'T:
• Don't blindly fade gaps - Wait for price action confirmation
• Don't ignore momentum - Strong trends can blow through FVGs
• Don't trade every gap - Quality over quantity
• Don't assume all gaps fill - About 70-80% fill, 20-30% don't
• Don't use tight stops - Allow room for wick into gap
• Don't overtrade - Wait for confluence and confirmation
• Don't fight trends - Best FVG trades are with higher TF trend
• Don't ignore fill percentage - 50% is often the sweet spot
🎯 Best Timeframes:
• Scalpers: 1min, 5min (many gaps, quick fills)
• Day Traders: 5min, 15min, 1H (balanced)
• Swing Traders: 1H, 4H, Daily (larger, more reliable gaps)
• Position Traders: 4H, Daily, Weekly (major imbalances)
🔥 Best Instruments:
• Excellent: BTC, ETH, ES, NQ, Forex majors (clean price action)
• Good: Gold, Oil, Major indices, Large-cap stocks
• Moderate: Altcoins, small-cap stocks (more noise)
• Best Markets: Trending markets with clear swings
⏰ Best Times for FVG Trading:
• London Session: High volume = reliable gap fills
• NY Session: Strong moves create quality gaps
• London-NY Overlap: Best time for gap creation and fills
• Asian Session: Lower probability, wait for London
━━━━━━━━━━━━━━━━━━━━━━━━━━━━
🎓 Advanced FVG Concepts
FVG Mitigation Levels
Understanding fill percentages:
• 0-25% Fill: Gap barely touched, often continues without fill
• 25-50% Fill: Partial rebalancing, may reverse here
• 50% Fill: CRITICAL LEVEL - Highest probability reversal zone
• 50-75% Fill: Deep rebalancing, strong reversal likely
• 75-100% Fill: Full rebalancing, gap's purpose fulfilled
Why 50% Matters: Market seeks equilibrium, and 50% represents perfect balance
FVG Inversions
When price breaks through a gap completely:
• Bullish FVG that's broken becomes bearish (support → resistance)
• Bearish FVG that's broken becomes bullish (resistance → support)
• Inverted gaps are weaker than fresh gaps
• Trading: Can fade the inverted gap but with caution
FVG Confluence Zones
Multiple FVGs at similar level:
• Creates "super gap" or confluence zone
• Much higher probability of reaction
• Wider zone for entries (more room for stops)
• Often aligns with other institutional concepts
FVG + Order Block Combo
When FVG overlaps with Order Block:
• Double institutional concept
• Extremely high probability setup (75-85% win rate)
• Price drawn to fill gap AND test order block
• Use tight stops, generous targets (3-5R possible)
Nested FVGs (Multi-Timeframe)
Small FVG inside larger FVG:
• Daily FVG contains 4H FVG contains 1H FVG
• Trade the smallest FVG in direction of larger ones
• Highest probability when all aligned
• Progressive targets: Fill small → medium → large gaps
FVG Exhaustion
When price creates multiple FVGs in same direction:
• Indicates strong momentum/impulsive move
• Each gap represents acceleration
• Last gap often signals exhaustion
• Watch for reversal after filling final gap
━━━━━━━━━━━━━━━━━━━━━━━━━━━━
📈 Common FVG Patterns
Pattern 1: The Perfect Rebalance
• FVG forms during strong move
• Price continues 100+ pips
• Clean return to 50% of gap
• Immediate reversal
• Textbook setup, 70%+ win rate
Pattern 2: The Double Fill
• Price partially fills gap (25%)
• Weak reaction, continues
• Returns again for deeper fill (75%)
• Strong reversal on second fill
• Second fill often better entry
Pattern 3: The Blow-Through
• Price approaches gap
• Completely ignores it, no reaction
• Keeps going in same direction
• Sign of very strong momentum
Pattern 4: The Magnet Effect
• Price slowly grinds toward gap
• Accelerates as it gets close
• Quickly fills and reverses
• Common in ranging markets
Pattern 5: The False Fill
• Price wicks into gap briefly
• Immediately reverses without filling
• "Stop hunt" or liquidity grab
• Gap remains unfilled
• Often precedes strong move
━━━━━━━━━━━━━━━━━━━━━━━━━━━━
🚀 What Makes This Different?
Unlike basic gap indicators, Fair Value Gap Detector:
• ICT Methodology - Based on proven institutional concepts
• Real-Time Fill Tracking - Shows percentage filled as it happens
• 3 Mitigation Types - Full, 50%, Partial for different strategies
• Active Gap Highlighting - Shows most relevant opportunity
• Smart Filtering - Minimum size to avoid noise
• Visual Clarity - Clean, professional appearance
• Auto-Management - Removes filled gaps automatically
• Distance Tracking - Know exactly where price needs to go
Based On Professional Concepts:
• ICT Fair Value Gap theory
• Market efficiency principles
• Price rebalancing dynamics
• Institutional order flow analysis
━━━━━━━━━━━━━━━━━━━━━━━━━━━━
📈 FVG Statistics & Probabilities
Based on ICT concepts and trader observations:
Gap Fill Rates:
• 70-80% of FVGs get filled eventually
• 60-70% show some reaction when filled
• 50% fill level has ~65% reversal rate
• Full fills have ~55% reversal rate
Timeframe Reliability:
• Daily FVGs: ~75-85% fill rate, strongest reactions
• 4H FVGs: ~70-80% fill rate, strong reactions
• 1H FVGs: ~65-75% fill rate, good reactions
• 15min FVGs: ~60-70% fill rate, moderate reactions
• 5min FVGs: ~55-65% fill rate, weaker reactions
Best Practices:
• First touch of gap = 65-70% win rate
• 50% fill = 65% win rate
• FVG + Order Block = 75-85% win rate
• Multi-timeframe aligned FVG = 70-80% win rate
• FVG in trending market = 60-70% win rate
Common Failures:
• Strong momentum blows through gaps (20-30% of time)
• Gaps in low-volume periods less reliable
• Very small gaps (<0.05%) often ignored
• Counter-trend gaps have lower success rate
━━━━━━━━━━━━━━━━━━━━━━━━━━━━
🙏 If You Find This Helpful
• ⭐ Leave your feedback
• 💬 Share your experience in the comments
• 🔔 Follow for updates and new tools
Questions about Fair Value Gaps? Feel free to ask in the comments.
━━━━━━━━━━━━━━━━━━━━━━━━━━━━
Version History
• v1.0 - Initial release with 3-candle FVG detection and real-time fill tracking

Buy vs Sell Volume EMA + Smart Momentum Shift (Crypto)This is a volume-based momentum indicator for crypto that:
Splits total volume into buy vs. sell volume based on candle direction.
Applies EMAs to buy/sell volume and tracks slope and acceleration of those EMAs.
Looks for moments where buyer volume momentum is improving and seller momentum is fading.
Optionally requires RSI and/or MACD confirmation, a “near recent low” location filter, and a score threshold based on several micro-conditions.
Outputs:
Colored background depending on whether buy or sell volume dominates.
EMA crossover arrows (“Buy” and “Sell”) for simpler regime shifts.
Green dots (“Strong Buy Momentum Shift”) when all filters are satisfied.
Alert conditions for the above signals.
It runs in a separate pane (overlay=false) and is explicitly designed for crypto, but works on any symbol/interval.

Combined: Net Volume, RSI & ATR# Combined: Net Volume, RSI & ATR Indicator
## Overview
This custom TradingView indicator overlays **Net Volume** and **RSI (Relative Strength Index)** on the same chart panel, with RSI scaled to match the visual range of volume spikes. It also displays **ATR (Average True Range)** values in a table.
## Key Features
### Net Volume
- Calculates buying vs selling pressure by analyzing lower timeframe data
- Displays as a **yellow line** centered around zero
- Automatically selects optimal timeframe or allows manual override
- Shows net buying pressure (positive values) and selling pressure (negative values)
### RSI (Relative Strength Index)
- Traditional 14-period RSI displayed as a **blue line**
- **Overlays directly on the volume chart** - scaled to match volume spike heights
- Includes **70/30 overbought/oversold levels** (shown as dotted red/green lines)
- Adjustable scale factor to fine-tune visual sizing relative to volume
- Optional **smoothing** with multiple moving average types (SMA, EMA, RMA, WMA, VWMA)
- Optional **Bollinger Bands** around RSI smoothing line
- **Divergence detection** - identifies regular bullish/bearish divergences with labels
### ATR (Average True Range)
- Displays current ATR value in a **table at top-right corner**
- Configurable period length (default: 50)
- Multiple smoothing methods: RMA, SMA, EMA, or WMA
- Helps assess current market volatility
## Use Cases
- **Momentum & Volume Confirmation**: See if RSI trends align with net volume flows
- **Divergence Trading**: Automatically spots when price makes new highs/lows but RSI doesn't
- **Volatility Assessment**: Monitor ATR for position sizing and stop-loss placement
- **Overbought/Oversold + Volume**: Identify exhaustion when RSI hits extremes with volume spikes
## Customization
All components can be toggled on/off independently. RSI scale factor allows you to adjust how prominent the RSI line appears relative to volume bars.

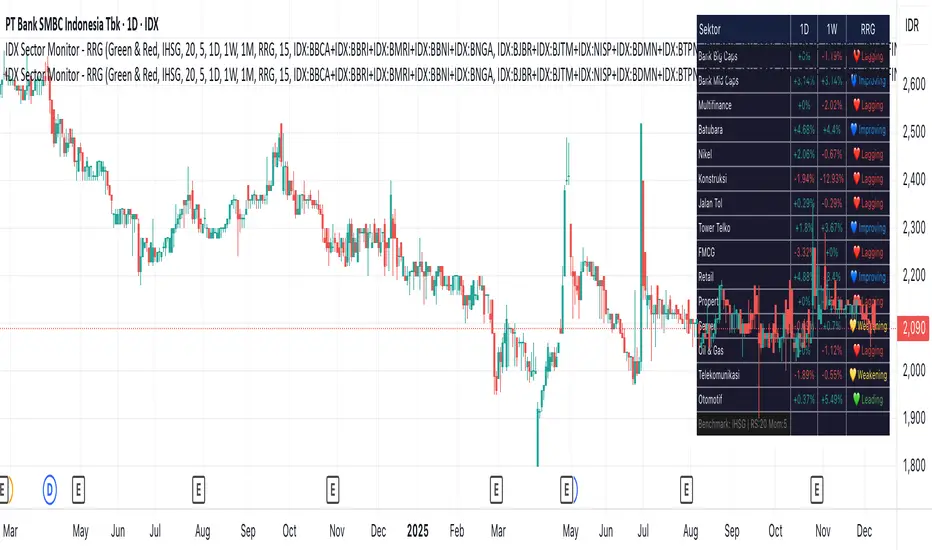
IDX Sector Monitor - RRG
// ═══════════════════════════════════════════════════════════════════════════════
// IDX SECTOR MONITOR - RRG EDITION
// ═══════════════════════════════════════════════════════════════════════════════
// Track Indonesian stock sectors with Relative Rotation Graph (RRG) analysis.
//
// Features:
// • Custom sector indices (equal-weighted)
// • Multi-timeframe performance (1D, 1W, 1M, etc.)
// • RRG status vs IHSG/LQ45 benchmark
//
// RRG Quadrants:
// 💚 Leading - Outperforming, strong momentum (BUY zone)
// 💛 Weakening - Still strong but slowing down (TAKE PROFIT)
// 💙 Improving - Weak but gaining momentum (WATCHLIST)
// ❤️ Lagging - Underperforming, avoid (SELL zone)
//
// ═══════════════════════════════════════════════════════════════════════════════
Crypto Market Pulse: Dom vs Vol AnalyzerConcept & Methodology
The core logic of this indicator is based on the "Money Flow" theory. It aggregates data from multiple sources (CRYPTOCAP:TOTAL, BTC.D, BINANCE:BTCUSDT) to provide a comprehensive market overview in a single panel.
Key Calculations:
Total Market Cap & Volume: Fetches real-time data to determine the overall health of the market.
Inverse Dominance Logic: Unlike standard indicators, this script applies inverse color coding to Bitcoin Dominance (BTC.D).
When BTC Dominance drops, it is colored Green (indicating liquidity flowing into Altcoins).
When BTC Dominance rises, it is colored Red (indicating risk for Altcoins).
Volume Delta: Compares the current timeframe's volume against the previous candle to calculate the percentage change, highlighting sudden liquidity injections.
█ Features
Real-time Dashboard: Displays Cap, Volume, BTC Price, and BTC Dominance.
Altcoin-Focus Coloring: Automatically interprets data to favor Altcoin traders (Green Signals = Good for Alts).
Dynamic Alerts:
Volume Surge Alert: Triggers when volume exceeds a user-defined threshold (default +50%), signaling potential breakout activity.
Dominance Drop Alert: Triggers when BTC Dominance falls significantly, signaling the start of potential Altcoin movement.
█ How to Use
Look for Confluence: The ideal "Altseason" signal is when the Total Cap is Green (Market up) AND BTC Dominance is Green (Dominance down). This indicates money is moving from BTC to Alts.
Volume Confirmation: Use the Volume row to confirm the strength of the move. A price rise without volume is often a fakeout.
Customization: You can adjust the table position and text size from the settings menu to fit your screen setup.

Magic Moving AveragesThis indicator plots up to three adaptive “Magic MAs” plus a weighted combo line, with optional traditional SMAs for comparison.
Instead of averaging only closes, each Magic MA:
looks at the midpoints of highs/lows and opens/closes
decides whether recent behaviour favours the highs or the lows
builds a series of either highs or lows, then smooths it over your chosen length
You can run:
Short / Medium / Long Magic MAs
A weighted combo line (using 1–10 weights)
Optional traditional short/long SMAs on close
How I use it:
Price above the combo line → bullish bias
Price below the combo line → bearish bias
Short/medium/long Magic MAs together → dynamic support/resistance and trend structure
Traditional SMAs on for comparison with “classic” moving average behaviour
Inputs:
Magic MA lengths control how reactive vs smooth each regime is
Weights (1–10) let you emphasise short, medium or long regimes in the combo
This is a free / educational version of the Magic MAs.
It’s not financial advice – always manage your own risk.

Profitable Pair Correlation Divergence Scanner v6This strategy identifies divergence opportunities between two correlated assets using a combination of Z-Score spread analysis, trend confirmation, RSI & MACD momentum checks, correlation filters, and ATR-based stop-loss/take-profit management. It’s optimized for positive P&L and realistic trade execution.
Key Features:
Pair Divergence Detection:
Measures deviation between returns of two assets and identifies overbought/oversold spread conditions using Z-Score.
Trend Alignment:
Trades only in the direction of the primary asset’s trend using a fast EMA vs slow EMA filter.
Momentum Confirmation:
Confirms trades with RSI and MACD to reduce false signals.
Correlation Filter:
Ensures the pair is strongly correlated before taking trades, avoiding noisy signals.
Risk Management:
Dynamic ATR-based stop-loss and take-profit ensures proper reward-to-risk ratio.
Exit Conditions:
Automatically closes positions when Z-Score normalizes, or ATR-based exits are hit.
How It Works:
Calculate Returns:
Computes returns for both assets over the selected timeframe.
Z-Score Spread:
Calculates the spread between returns and normalizes it using moving average and standard deviation.
Trend Filter:
Only takes long trades if the fast EMA is above the slow EMA, and short trades if the fast EMA is below the slow EMA.
Momentum Confirmation:
Confirms trade direction with RSI (>50 for longs, <50 for shorts) and MACD alignment.
Correlation Check:
Ensures the pair’s recent correlation is strong enough to validate divergence signals.
Trade Execution:
Opens positions when Z-Score crosses thresholds and all conditions align. Positions close when Z-Score normalizes or ATR-based SL/TP is hit.
Plot Explanation:
Z-Score: Blue line shows divergence magnitude.
Entry Levels: Red/Green lines mark long/short thresholds.
Exit Zone: Gray lines show normalization zone.
EMA Trend Lines: Purple (fast), Orange (slow) for trend alignment.
Correlation: Teal overlay shows current correlation strength.
Usage Tips:
Use highly correlated pairs for best results (e.g., EURUSD/GBPUSD).
Run on higher timeframe charts (1h or 4h) to reduce noise.
Adjust ATR multiplier based on volatility to avoid premature stops.
Combine with alerts for automated notifications or webhook execution.
Conclusion:
The Profitable Pair Correlation Divergence Scanner v6 is designed for traders who want systematic, low-risk, positive P&L trading opportunities with minimal manual monitoring. By combining trend alignment, momentum confirmation, correlation filters, and dynamic exits, it reduces false signals and improves execution reliability.
Run it on TradingView and watch how it captures divergence opportunities while maintaining positive P&L across trades.

Kurtosis with Skew Crossover Focused OscillatorDescription:
This indicator highlights Skewness/Kurtosis crossovers for short-term trading:
Green upward arrows: Skew crosses above Kurtosis → potential long signal.
Red downward arrows: Skew crosses below Kurtosis → potential short signal.
Yellow upward arrows: Extreme negative skew (skew ≤ -1.7) → potential oversold/reversal opportunity.
Oscillator Pane:
Orange = Skewness (smoothed)
Blue = Kurtosis (adjusted, smoothed)
Zero line = visual reference
Usage:
Primarily for 2–5 minute charts, highlighting statistical anomalies and potential short-term reversals that can be used in conjunction with OBV and/or CVD
Arrows signal potential entries based on skew/kurt dynamics.
Potential ideas???????
---------------------------------------
Add Supporting Market Context
---------------------------------------
Currently, signals are purely based on skew/kurt crossovers. Adding supporting indicators could improve reliability:
Volume / CVD: Identify when crossovers occur with real buying/selling pressure.
Wick Imbalance: Detect forced moves in price structure.
Volatility Regime (Parkinson / ATR): Filter signals during high volatility spikes or compressions.
Experimentation: Try weighting these supporting signals to dynamically confirm or filter skew/kurt crossovers and see if false signals decrease on 2–5 minute charts.
--------------------------------------
Dynamic Thresholds & Scaling
--------------------------------------
Right now, the extreme skew signal is triggered at a fixed level (skew ≤ -1.7). Future improvements could include:
Adaptive thresholds: Scale extreme skew levels based on recent standard deviation or intraday volatility.
Kurtosis thresholds: Introduce a cutoff for kurtosis to identify “fat-tail” events.
Experimentation: Backtest different adaptive thresholds for both skew and kurt, and see how it affects the precision vs. frequency of signals.
--------------------------------------------------
Multi-Timeframe or Combined Oscillator
--------------------------------------------------
Skew/kurt signals could be combined across multiple intraday timeframes (e.g., 1-min, 3-min, 5-min) to improve confirmation.
Create a composite oscillator that blends short-term and slightly longer-term skew/kurt values to reduce noise.
Experimentation: Compare a single timeframe approach vs multi-timeframe composite, and measure signal reliability and lag.
I'm leaving this open so anyone can experiment with it as this project may be on the backburner, but these are my thoughts so far

Trend Gazer: Unified ICT Trading System with Signals# Trend Gazer User Guide (English)
## 📖 Table of Contents
1. (#about-this-indicator)
2. (#quick-start-guide-3-steps)
3. (#detailed-usage)
4. (#settings-customization)
5. (#why-combine-multiple-features)
6. (#faq)
---
## About This Indicator
**Trend Gazer** is an integrated trading system designed to read institutional order flow like professional traders.
### 🎯 3 Problems This Indicator Solves
#### ❌ Problem 1: Too Many Indicators = Information Overload
```
Normal: RSI + MACD + Moving Average + Bollinger Bands... → Cluttered chart
Solution: All integrated into ONE indicator → Clean & Clear
```
#### ❌ Problem 2: Single Indicators Give False Signals
```
Normal: Enter based on RSI alone → Frequent stop-outs
Solution: Structure × Zone × Momentum multi-angle confirmation → Higher win rate
```
#### ❌ Problem 3: Unclear Entry Timing
```
Normal: Know the trend but don't know WHERE to enter
Solution: LS Bounce Signal shows EXACT entry points
```
---
## Quick Start Guide (3 Steps)
### 🚀 STEP 1: Confirm Trend Direction
**Look for CHoCH (Change of Character)**
```
📍 (1.CHoCH) label = Uptrend starting
📍 (a.CHoCH) label = Downtrend starting
```
**Important**: Wait for CHoCH! No direction without it.
---
### 🎯 STEP 2: Find Entry Points
**Wait for LS Bounce Signal (green/red labels)**
```
🟢 "Long@ HL only" label → LONG (buy) candidate
🔴 "Short@ LH only" label → SHORT (sell) candidate
```
**Label text color meaning**:
- **White text**: Clean trend (high confidence)
- **Yellow text**: Trend transition (moderate caution)
---
### 🛡️ STEP 3: Final Confirmation with Bar Color
**Bar color shows market state**
```
🔴 Red bar: BUY zone (buying is favored)
🟢 Green bar: SELL zone (selling is favored)
⚪ White bar: Neutral (wait and see)
```
---
## Detailed Usage
### 📊 Understanding the Chart
#### 1. Labels (Market Structure Changes)
```
(1.CHoCH) / (a.CHoCH) : Trend reversal
(2.SiMS) / (b.SiMS) : Momentum confirmation
(3.BoMS) / (c.BoMS) : Trend continuation
```
#### 2. Boxes (Institutional Order Zones)
```
📦 Blue boxes: Bullish OB (buy orders accumulated)
📦 Red boxes: Bearish OB (sell orders accumulated)
📦 Black transparent boxes: Liquidity Sweep
```
**How to use Order Blocks**:
- Function as support/resistance
- Signals within OB have higher reliability
- Use for stop-loss placement
#### 3. Lines (Trends and Support/Resistance)
```
━━━ Red lines: EMA20, EMA50, EMA100 (short to mid-term trends)
━━━ Blue lines: 60min NPR/BB bands (support/resistance)
```
#### 4. Bar Colors (Filter 6)
```
Bar color = Real-time market state
🔴 Red: Buying is favored
🟢 Green: Selling is favored
⚪ White: Neutral
```
---
### 🎯 Practical Trading Flow
#### 📍 Preparation Phase
```
1. Open chart (recommended: 5min or 15min)
2. Add Trend Gazer to chart
3. Start in observation mode (don't enter yet)
```
#### 📍 Entry Decision
```
✅ CHoCH confirms direction → Uptrend starting
✅ LS Bounce Signal "Long@ HL only" appears
→ Entry point candidate
✅ Bar turns red → Market supports buying
→ Entry decision 🎯
✅ Place stop below nearest Order Block (blue box)
```
#### 📍 Exit Decision
```
🔴 Opposite LS Bounce Signal "Short@ LH only" appears
→ Consider taking profit
🔴 Bar turns green
→ Potential trend reversal, review position
🔴 Stop loss hit
→ Exit with loss
```
---
### 💡 Tips for Higher Win Rate
#### ✅ DO's
```
1. Enter AFTER CHoCH appears
2. Prioritize white-text LS Bounce Signals
3. Check higher timeframe (1H or Daily) trend
4. Emphasize signals within Order Blocks
5. Use bar color as final confirmation
```
#### ❌ DON'Ts
```
1. Enter before CHoCH → No clear direction
2. Enter only on yellow text → Unstable transition period
3. Ignore bar color → Trading against market state
4. Don't check Order Blocks → Unclear support/resistance
5. Enter same direction consecutively → Overtrading
```
---
## Settings Customization
### 🔧 How to Open Settings
```
1. Right-click on indicator name on chart
2. Select "Settings..."
3. Settings panel opens
```
---
### 📋 Recommended Setting Profiles
#### 🔰 Beginner Settings (Simple)
**Goal**: Reduce noise, show only important signals
```
【FILTERS】
✅ Bonus Filter: ON
✅ Filter 6 (OB/BB/NPR Zone Filter): ON
❌ Direction Filter: OFF
❌ Liquidation Reversal Filter: OFF
❌ ICT Market Structure Filter: OFF
❌ EMA Trend Filter: OFF
❌ OB/FVG Filter 1: OFF
❌ OB/FVG Filter 2: OFF
【SIGNALS】
✅ Signal 0 (Bonus): ON
✅ Signal 1 (VWC Change): ON
✅ Signal 2 (Liq Rev): ON
❌ Signal 3 (LS): OFF (complex alone)
❌ Signal 4 (LS Break): OFF
❌ Signal 5 (OB+LS NPR): OFF
❌ Signal 6 (OB+LS EMA): OFF
【LS BOUNCE SIGNAL】
✅ Exclude EMA50 from touch detection: OFF
❌ Only show when EMA fills are mixed: OFF
```
**What happens with this setup**:
- Only Bonus (black background) signals display
- LS Bounce Signals clearly visible
- Noisy signals filtered out
---
#### 💪 Intermediate Settings (Balanced)
**Goal**: Enable key filters for better accuracy
```
【FILTERS】
✅ Bonus Filter: ON
✅ Filter 6 (OB/BB/NPR Zone Filter): ON
✅ ICT Market Structure Filter: ON
❌ Direction Filter: OFF
❌ Liquidation Reversal Filter: OFF
❌ EMA Trend Filter: OFF
❌ OB/FVG Filter 1: OFF
❌ OB/FVG Filter 2: OFF
【SIGNALS】
✅ Signal 0 (Bonus): ON
✅ Signal 1 (VWC Change): ON
✅ Signal 2 (Liq Rev): ON
✅ Signal 3 (LS): ON
❌ Signal 4 (LS Break): OFF
❌ Signal 5 (OB+LS NPR): OFF
❌ Signal 6 (OB+LS EMA): OFF
【LS BOUNCE SIGNAL】
✅ Exclude EMA50 from touch detection: OFF
❌ Only show when EMA fills are mixed: OFF
```
**What happens with this setup**:
- Signals only after CHoCH (trend confirmed)
- Filter 6 changes bar colors
- Liquidity Sweeps also displayed
---
#### 🚀 Advanced Settings (Full Utilization)
**Goal**: Master all features
```
【FILTERS】
✅ Bonus Filter: ON
✅ Filter 6 (OB/BB/NPR Zone Filter): ON
✅ ICT Market Structure Filter: ON
✅ Direction Filter: ON
✅ EMA Trend Filter: ON
❌ Liquidation Reversal Filter: OFF (optional)
✅ OB/FVG Filter 1: ON
✅ OB/FVG Filter 2: ON
【SIGNALS】
✅ All ON
【LS BOUNCE SIGNAL】
✅ Exclude EMA50 from touch detection: ON (reduce EMA50 noise)
✅ Only show when EMA fills are mixed: ON (show only transition zones)
```
**What happens with this setup**:
- Fewer signals (precision-focused)
- Multiple confirmations greatly reduce false signals
- Only signals confirmed by trend, momentum, and zones
---
### 🎨 Display Customization
#### Change Label Size
```
【BUY/SELL SIGNAL APPEARANCE】
→ "BUY/SELL Label Size"
→ Choose from: tiny / small / normal / large / huge
Recommended: small (default)
```
#### Order Block Display Settings
```
【ORDER BLOCK (OB) SETTINGS】
✅ Show Current TF OB: Current timeframe OB
✅ Show 1min OB: 1-minute OB
✅ Show 5min OB: 5-minute OB
✅ Show 15min OB: 15-minute OB
Recommended: Only 15min OB ON (simple)
```
#### Liquidity Sweep Display
```
【LIQUIDITY SWEEPS SETTINGS】
→ "Sweep Length": Sensitivity (small=frequent, large=selective)
→ "Sweep Option": Standard / Maximum
Recommended: Length=40, Option=Standard
```
#### NPR/BB Bands Display
```
【NPR (NON-REPAINT STDEV) SETTINGS】
✅ Display 60min NPR Bands: 60-minute support/resistance
❌ Display Current TF NPR Bands: Current timeframe (optional)
Recommended: Only 60min ON
```
---
### ⚙️ Advanced Settings
#### Fine-tune Filter 6
```
【FINAL FILTERS】
→ "Enable Filter 6 (OB/BB/NPR Zone Filter)"
When ON:
- Bars color-coded red/green/white
- Behavior at OB, NPR/BB touches controlled
```
#### LS Bounce Signal Adjustments
```
【LS BOUNCE SIGNAL】
→ "Exclude EMA50 from touch detection"
OFF: Detect NPR/BB/EMA50 (all 3)
ON: Detect NPR/BB only (exclude EMA50)
→ "Only show when EMA fills are mixed"
OFF: Show all LS Bounce Signals
ON: Show only transition zone signals (yellow text)
```
#### MTF (Multi-Timeframe) Control
```
【ORDER BLOCK (OB) SETTINGS】
→ "Disable MTF on 1hr+ Charts"
ON: Disable MTF on 1H+ (save memory)
OFF: MTF enabled on all timeframes
Recommended: ON (unnecessary on larger timeframes)
```
---
### 🎯 Purpose-Based Configuration Guide
#### 🔍 Goal 1: Reduce Signal Count
```
✅ Bonus Filter: ON
✅ ICT Market Structure Filter: ON
✅ Filter 6: ON
✅ All Signals OFF, only Signal 0 ON
```
#### 🔍 Goal 2: Get More Signals
```
❌ All Filters OFF
✅ All Signals ON
```
#### 🔍 Goal 3: Trend Following Only
```
✅ ICT Market Structure Filter: ON
✅ Direction Filter: ON
✅ EMA Trend Filter: ON
```
#### 🔍 Goal 4: Counter-Trend Trading
```
✅ LS Bounce Signal: ON
✅ Filter 6: ON
❌ ICT Market Structure Filter: OFF
```
#### 🔍 Goal 5: Day Trading (5-15min charts)
```
✅ Show 15min OB: ON
✅ Display 60min NPR Bands: ON
✅ LS Bounce Signal: ON
❌ Show 1min/5min OB: OFF
```
#### 🔍 Goal 6: Scalping (1-5min charts)
```
✅ Show 5min OB: ON
✅ Show 15min OB: ON
✅ Display 60min NPR Bands: ON
✅ All Signals: ON
```
---
### 💾 Saving and Loading Settings
#### Save Settings
```
1. Click "..." in top-right of Settings screen
2. Select "Save as default"
→ Same settings auto-applied next time
```
#### Reset Settings
```
1. Click "..." in top-right of Settings screen
2. Select "Reset settings"
→ Return to default settings
```
---
## Why Combine Multiple Features?
### 🎯 Problem: Single Indicator Limitations
Common trader problems:
```
❌ RSI alone → Trade against trend, lose
❌ Moving Average alone → Late entry timing
❌ Support/Resistance alone → Caught by false breakouts
```
**Markets are complex**. One angle isn't enough.
---
### 💡 Solution: Multi-Angle Integrated Approach
#### 1️⃣ Structure × Zone × Momentum
```
📐 Structure (ICT CHoCH)
→ "Which direction is likely?"
📦 Zone (OB/NPR/BB)
→ "Where will price react?"
💨 Momentum (EMA/VWC)
→ "Is there momentum now?"
```
**When all 3 align = Highest win-rate timing**
---
#### 2️⃣ Multi-Timeframe Analysis
```
Big picture: Confirm Daily direction
Medium-term: Check 1H Order Blocks
Short-term: Time entry on 5min
```
**Short-term entries aligned with higher timeframes = Better win rate**
---
#### 3️⃣ Understanding Liquidity
```
🎣 Institutional strategy:
1. Intentionally move price opposite to stop out retail
2. Then, move in real direction
💡 Liquidity Sweep = Visualize this "trap"
→ Read institutional order flow
```
---
### 🧠 Integration Examples
#### Case 1: RSI Alone vs Integrated System
**Scenario**: RSI at 30 (oversold)
```
❌ RSI-only decision:
→ "Buy!"
→ But downtrend continues, loss 😢
✅ Trend Gazer:
CHoCH check → Still downtrend ❌
Order Block → In Bearish OB ❌
LS Bounce → SHORT signal only ❌
→ Skip or SHORT
→ Avoid loss ✅
```
**Result**: Multiple filters block wrong entry
---
#### Case 2: LS Bounce Signal 2-Stage Logic
**Scenario**: Price touches 60min NPR lower band
```
🔍 Traditional method:
Touched → Buy!
→ But price continues down 😢
✅ Trend Gazer:
Stage 1: NPR touch + red bar → Flag ON
Stage 2: EMA20 crosses above EMA50 → Confirm bounce
→ Now "Long@ HL only" displays
→ Entry → Success ✅
```
**Result**: Not just "touch" but "touch + bounce confirmation" improves accuracy
---
### 🎓 Progressive Learning Design
This indicator is designed for **beginners to advanced**:
```
📖 Beginner (Month 1):
Use only CHoCH + LS Bounce Signal
→ Learn trend and entry points
📖 Intermediate (Months 2-3):
Add Order Block + Bar Color
→ Learn support/resistance and filtering
📖 Advanced (Month 6+):
Master all features
→ Read institutional order flow
```
**Ultimate goal**: Indicator becomes confirmation tool. Your market sense becomes primary.
---
### 🔬 Technical Advantages
#### 1. Non-Repaint STDEV (NPR)
```
Normal Bollinger Bands:
→ Past data changes (repaints)
→ Inaccurate backtesting
NPR:
→ Past data doesn't change (non-repaint)
→ Reliable verification possible
```
#### 2. 2-Stage Signal Logic
```
Traditional: Condition met → Immediate signal
→ Many false signals
Trend Gazer: Condition1 → Flag ON → Condition2 → Signal
→ Confirmation step improves accuracy
```
#### 3. Alternating Filter
```
Problem: Same-direction signals spam
→ Overtrading
Solution: LONG → SHORT → LONG alternating only
→ Prevent unnecessary entries
```
---
### 💎 Conclusion: Why Integration?
```
Single indicator = "Partial truth"
Integrated system = "3D market perspective"
```
**Markets are multifaceted**. One angle isn't enough.
Trend Gazer **integrates multiple screens pros watch simultaneously into ONE**,
allowing beginners to read charts with institutional perspective.
---
## FAQ
### ❓ Q1: Which timeframe is best?
**A**: Depends on trading style
```
Scalping: 1min ~ 5min
Day Trading: 5min ~ 15min
Swing: 1H ~ 4H
```
**Important**: LS Bounce Signal only works on 30min and below.
---
### ❓ Q2: Too many signals, confused
**A**: Enable filters
```
【Recommended Settings】
✅ Bonus Filter: ON
✅ Filter 6: ON
✅ ICT Market Structure Filter: ON
→ Show only Signal 0
```
This significantly reduces signal count.
---
### ❓ Q3: No CHoCH appearing, what to do?
**A**: Wait or check higher timeframe
```
Method 1: Wait for CHoCH (recommended)
Method 2: Check higher timeframe (e.g., Daily) for trend
Method 3: Disable ICT Filter (not recommended)
```
**When trend is unclear, sitting out is also strategy**.
---
### ❓ Q4: LS Bounce Signal not appearing
**A**: Checkpoints
```
1. Are you on 30min or below chart?
→ Doesn't show on 1H+
2. Are NPR/BB bands displayed?
→ Check Settings "Display 60min NPR Bands"
3. Is EMA50 excluded?
→ If "Exclude EMA50" is ON, EMA50 signals won't show
```
---
### ❓ Q5: Bar color not changing?
**A**: Check Filter 6
```
Settings → FINAL FILTERS
→ Confirm "Enable Filter 6 (OB/BB/NPR Zone Filter)" is ON
If ON but still not changing:
→ Current price may be outside OB/NPR/BB zones
```
---
### ❓ Q6: Too many Order Blocks, hard to see
**A**: Narrow down displayed OBs
```
Settings → ORDER BLOCK (OB) SETTINGS
Recommended:
❌ Show Current TF OB: OFF
❌ Show 1min OB: OFF
❌ Show 5min OB: OFF
✅ Show 15min OB: ON (only this)
```
---
### ❓ Q7: How to improve win rate?
**A**: Thorough multiple confirmations
```
Checklist:
✅ CHoCH appeared
✅ LS Bounce Signal (white text)
✅ Bar color matches (red bar=LONG, green bar=SHORT)
✅ Signal within Order Block
✅ Aligns with higher timeframe trend
Enter ONLY when all align
```
---
### ❓ Q8: Want to practice on demo
**A**: Recommended practice method
```
Week 1: Observation only
→ Watch signals and chart movement
→ Resist entering
Weeks 2-3: Keep records
→ Screenshot when signal appears
→ Record subsequent movement
Week 4+: Start demo trading
→ Start with small amounts
→ Continue keeping records
```
---
### ❓ Q9: Are there alert features?
**A**: Yes, multiple alerts available
```
Setup method:
1. Right-click indicator on chart
2. Select "Add Alert..."
3. Choose from:
- ANY ALERT: BUY/SELL Signals
- BUY ONLY ALERT
- SELL ONLY ALERT
- MS UP / MS DOWN
- BAR COLOR: RED / LIME
- LS BOUNCE: LONG / SHORT Signal
```
---
### ❓ Q10: Works on other markets?
**A**: Yes, works on all markets
```
✅ Cryptocurrency (BTC, ETH, etc.)
✅ Forex (EUR/USD, USD/JPY, etc.)
✅ Stocks (individual stocks, indices)
✅ Futures (oil, gold, etc.)
```
Works on any market with price and volume data.
---
## 📋 Disclaimer
### ⚠️ Important Notice
This indicator is for **educational and informational purposes only**.
```
❌ NOT investment advice
❌ Does NOT guarantee profits
❌ Past results do NOT guarantee future performance
```
### Risk Warning
```
⚠️ Trading involves substantial risk
⚠️ Only trade with funds you can afford to lose
⚠️ Practice extensively on demo account before live trading
⚠️ Make your own informed decisions and act at your own risk
```
---
## 📞 Support
### Feedback & Questions
Feel free to ask questions in TradingView comments section.
### Bug Reports
Please report with specific details (timeframe, symbol, screenshots).
---
**Author**: rasukaru666
**License**: Mozilla Public License 2.0
**Last Updated**: December 2025
**Version**: Latest
---
**Thank you for using Trend Gazer!**
**Happy Trading! 📈**
---------------

Relative Strength Line by QuantxThe Relative Strength Line compares the price performance of a stock against a benchmark index (e.g., NIFTY, S&P 500, Bank Nifty, etc.).
It does not indicate momentum of the stock itself — it indicates whether the stock is outperforming or underperforming the market.
🔍 How To Read It
RSL Behavior Meaning
RSL moving up Stock is outperforming the benchmark (strong leadership)
RSL moving down Stock is underperforming the benchmark (weakness vs market)
RSL breaking above previous highs Strong institutional demand, leadership candidate
RSL trending sideways Stock is performing similar to the index (no leadership)
📈 Why It Matters
Institutional traders and top-performing strategies focus on stocks showing relative strength BEFORE price breakout.
A stock making new RSL highs even before a price breakout often becomes a top performer in the coming trend.
🧠 Core Trading Edge
You don’t need to predict the market.
Just identify which stocks are being accumulated and leading the market right now — that’s what the Relative Strength Line reveals.

Impulse Trend Suite (LITE) — v2🚀 Impulse Trend Suite (LITE) — v2
Smart trend visualization with precise flip arrows. A lightweight, momentum-filtered trend tool designed to stay clean, avoid repeated signals, and keep you focused only on real market direction.
✨ What’s New in v2
*Minor upgrades mostly visual
*Added Blue fill between MA lines
*clearer labels
📌 Core Features
*Trend flip arrows (no spam, 1 signal per turn)
*Continuous background zones (gap-free trend shading)
*Adaptive Baseline + ATR structure channel
*RSI + MACD momentum filter (suppresses weak signals)
*Trend Status Panel (UP, DOWN, NEUTRAL)
🔍 Quick Guide
BUY setup = green arrow + green background
SELL setup = red arrow + red background
Stay in the move while color doesn’t change
ATR channel helps avoid chasing overextended candles
🆚 LITE vs PRO
========================================================
Feature LITE PRO
--------------------- -------- ------------------------------
Trend shading + arrows ✔ ✔ + confirmations
Neutral trend state ✔ ✔ enhanced
Alerts ✖ ✔ full suite
Reversal Zones ✖ ✔ predictive boxes
HTF Filter ✖ ✔ smarter trend bias
Included strategies ✖ ✔ + PDF training
🔓 Upgrade to PRO
Reversal Zones • Alerts • HTF Filter • Trend Continuation Strategy
📈 Works on Forex, Stocks, Crypto, Indices, Metals
⌚ Scalping • Intraday • Swing • Long-term
==========================================================
🌠FULL PRO VERSION --> fxsharerobots.com/impulse-trend-pro/
💾 ALL DOWNLOADS --> fxsharerobots.com/downloads/
Happy trading! — FxShareRobots Team


⭐ Silver HUD v15.1 — Full Notes Version (3-Column HUD)Silver HUD v15.1 is a comprehensive Pine Script v5 indicator designed for micro silver futures (SIL) trading on TradingView. It overlays a 3-column HUD table displaying real-time analysis across multiple engines including trend, flow, momentum, pullback, turbo (breakout), divergence, volume, and 2H structure. The system generates weighted BUY/SELL scores and final signals with risk warnings, optimized for 5m charts with 30m support/resistance levels.
Core Components
Support/Resistance & Trade Levels
Pulls 30m lowest low (support) and highest high (resistance) for entry/stop/TP calculation. Entry defaults to support, stop loss at support - 0.10, with ATR-based TPs (1x/2x/3x). Risk per lot factors SIL contract specs (1000oz, $5/tick). Alerts when price nears support within 0.05.
Multi-Engine Analysis
TREND: EMA20/50 + VWAP direction (UP/DOWN/MIXED).
FLOW: CCIOBV (CCI+OBV) + QQE momentum sync.
MOMENTUM: RSI/MFI >55 (UP) or <45 (DOWN).
PB (Pullback): EMA20 deviation (-0.4% to +1.2% = OK; flags CHASE/DEEP).
TURBO: ATR percentile + BB width squeeze for BREAKOUT/EXHAUST.
Scores weight flow (30%), momentum (25%), PB (25%), trend/turbo (10-20%). BUY ≥75, SELL ≥72 triggers raw signals.
Advanced Features
2H Structure: Detects HH/HL/LL/LH swings for macro bias (UP/DOWN/MIXED).
SELL System: Distinguishes SELL-ALERT (exhaustion) vs full SELL-REVERSAL (multi-condition bear flip).
Divergence & Volume: RSI-based bear/bull div on swing highs/lows; surge detection (>2x vol MA or 80th percentile).
Final Signal: Combines raw scores with filters (no DEEP PB for BUY, 2H tiebreaker); RISK flags conflicts like div or trend mismatches.
HUD Display & Usage
Renders a bottom-right table with metric, status (color-coded), and Chinese explanations. Stars rate scores (★★★★★=90+). Ideal for high-frequency SIL traders monitoring multi-timeframe confluence on 5m charts.

MTF S/R Array - Full CustomA clean, institutional-style multi-timeframe support and resistance indicator designed for precision trading decisions. Plots previous and current period levels with full customization for backtesting and live trading.
━━━━━━━━━━━━━━━━━━━━━━
WHAT IT PLOTS
━━━━━━━━━━━━━━━━━━━━━━
MONTHLY
- Previous Month High / Low / Close
- Previous Month Highest Closing Price
- Current Month High / Low / Highest Close
WEEKLY
- Previous Week High / Low / Close
- Current Week High / Low
DAILY
- Previous Day High / Low / Close
- Current Day High / Low
SESSIONS (Full Session - EST)
- Asian: 7pm - 4am
- London: 3am - 12pm
- New York: 8am - 5pm
OPENING RANGE
- Monday/Tuesday combined high and low
- Clean box visualization for weekly initial balance
━━━━━━━━━━━━━━━━━━━━━━
WHY THESE LEVELS MATTER
━━━━━━━━━━━━━━━━━━━━━━
Institutions and smart money reference these key levels for:
- Liquidity targets
- Stop hunts
- Reversal zones
- Trend continuation entries
Previous period levels act as magnets for price. Current levels show where the battle is happening now.
━━━━━━━━━━━━━━━━━━━━━━
FULL CUSTOMIZATION
━━━━━━━━━━━━━━━━━━━━━━
Every level type has independent controls:
- Show/Hide Previous and Current separately
- Extend Bars - control how far each level stretches
- Line Width - adjust thickness per level
- Transparency - fade previous levels for clarity
- Colors - separate colors for High/Low vs Close
Additional settings:
- Labels on/off with size and style options
- Info table with position and size controls
- Opening range box transparency and border width
━━━━━━━━━━━━━━━━━━━━━━
HOW TO USE
━━━━━━━━━━━━━━━━━━━━━━
1. Use on lower timeframes (1m, 5m, 15m) to see HTF levels
2. Watch for price reactions at previous period highs/lows
3. Look for session high/low sweeps followed by reversals
4. Use Monday/Tuesday opening range for weekly bias and targets
5. Previous levels extend further back for backtesting context
━━━━━━━━━━━━━━━━━━━━━━
TIPS
━━━━━━━━━━━━━━━━━━━━━━
- Increase "Prev Extend Bars" on monthly/weekly to see levels across more history
- Use higher transparency on previous levels to keep chart clean
- Turn off sessions you don't trade to reduce clutter
- The info table shows all values at a glance - position it where it doesn't block price action
━━━━━━━━━━━━━━━━━━━━━━
BEST FOR
━━━━━━━━━━━━━━━━━━━━━━
- ICT / Smart Money Concepts traders
- Session-based strategies
- Swing traders using HTF levels on LTF entries
- Anyone who wants clean, customizable S/R levels
Works on Forex, Crypto, Stocks, Futures, and Indices.

TMT 1M HA Scalping INDICATOR - Hitesh Nimje📊 TMT 1 Minute HA Scalping Strategy - Hitesh Nimje
🎯 Strategy Overview
A 1-minute scalping strategy designed for high-frequency trading using Heikin Ashi-inspired crossover logic with multiple filters for precision entries.
🔧 Key Components
1. Moving Averages (Trend Detection)
LineTypePeriodColorPurposeFast SMASimple MA9🔵 BluePrimary signal lineSlow SMASimple MA21🔴 RedSecondary confirmationTrend SMASMA (1H)50⚫ BlackOverall market trend bias
2. Entry Signals (Crossover Logic)
🔥 BUY Signal: Fast SMA (9) crosses ABOVE Slow SMA (21)
🔥 SELL Signal: Fast SMA (9) crosses BELOW Slow SMA (21)
3. Entry Filters (4-Layer Confirmation)
✅ LONG Entry = Crossover + Trend Up + RSI Overbought + Bar Confirmed
✅ SHORT Entry = Crossunder + Trend Down + RSI Oversold + Bar Confirmed
longCond = sma_slope > 0 AND rsi >= 70 AND buySignal
shortCond = sma_slope < 0 AND rsi <= 30 AND sellSignal
FilterLongShortPurposeTrend Slopesma_slope > 0sma_slope < 0Market directionRSI FilterRSI >= 70RSI <= 30Momentum extremeCrossoverFast > SlowFast < SlowEntry triggerBar Statebarstate.isconfirmedbarstate.isconfirmedNo repaint
⚡ Risk Management
Stop Loss (Dynamic ATR-based)
Long SL = Lowest Low (7) - 1×ATR(14)
Short SL = Highest High (7) + 1×ATR(14)
Take Profit (1:1 Risk-Reward)
Long TP = Entry + (Entry - SL distance)
Short TP = Entry - (SL distance - Entry)
⏰ Trading Hours
📅 Active: 00:00 - 14:59 (3:00 PM cutoff)
🛑 Auto-close: All positions closed at 15:00
🎨 Visual Elements
📍 BUY Labels: 🟢 Green (below bar)
📍 SELL Labels: 🔴 Red (above bar)
📈 Fast SMA: 🔵 Blue line (9-period)
📉 Slow SMA: 🔴 Red line (21-period)
📊 Trend SMA: ⚫ Black line (50-period, 1H)
⚙️ Input Parameters
ParameterDefaultPurposeEnd of Day1500 (3 PM)Auto-close timeLot Size1Position size
🚀 How It Works (Step-by-Step)
1. Monitor Fast(9) vs Slow(21) SMA crossover
2. Check 1H Trend SMA slope (up/down bias)
3. Validate RSI extreme (70+/30-)
4. Wait for bar confirmation
5. Enter with ATR-based SL & 1:1 TP
6. Auto-exit at 3 PM or SL/TP hit
💡 Strategy Strengths
* ✅ Multi-timeframe trend filter
* ✅ RSI momentum confirmation
* ✅ Dynamic ATR stop losses
* ✅ No repaint signals
* ✅ End-of-day risk control
* ✅ 1:1 Risk-Reward consistency
Perfect for 1-minute scalping on volatile instruments! 🔥
© Hitesh Nimje | Thought Magic Trading
Contact: 8087192915
TRADING DISCLAIMER
RISK WARNING
Trading involves substantial risk of loss and is not suitable for all investors. Past performance is not indicative of future results. You should carefully consider whether trading is suitable for you in light of your circumstances, knowledge, and financial resources.
NO FINANCIAL ADVICE
This indicator is provided for educational and informational purposes only. It does not constitute:
* Financial advice or investment recommendations
* Buy/sell signals or trading signals
* Professional investment advice
* Legal, tax, or accounting guidance
LIMITATIONS AND DISCLAIMERS
Technical Analysis Limitations
* Pivot points are mathematical calculations based on historical price data
* No guarantee of accuracy of price levels or calculations
* Markets can and do behave irrationally for extended periods
* Past performance does not guarantee future results
* Technical analysis should be used in conjunction with fundamental analysis
Data and Calculation Disclaimers
* Calculations are based on available price data at the time of calculation
* Data quality and availability may affect accuracy
* Pivot levels may differ when calculated on different timeframes
* Gaps and irregular market conditions may cause level failures
* Extended hours trading may affect intraday pivot calculations
Market Risks
* Extreme market volatility can invalidate all technical levels
* News events, economic announcements, and market manipulation can cause gaps
* Liquidity issues may prevent execution at calculated levels
* Currency fluctuations, inflation, and interest rate changes affect all levels
* Black swan events and market crashes cannot be predicted by technical analysis
USER RESPONSIBILITIES
Due Diligence
* You are solely responsible for your trading decisions
* Conduct your own research before using this indicator
* Verify calculations with multiple sources before trading
* Consider multiple timeframes and confirm levels with other technical tools
* Never rely solely on one indicator for trading decisions
Risk Management
* Always use proper risk management and position sizing
* Set appropriate stop-losses for all positions
* Never risk more than you can afford to lose
* Consider the inherent risks of leverage and margin trading
* Diversify your portfolio and trading strategies
Professional Consultation
* Consult with qualified financial advisors before trading
* Consider your tax obligations and legal requirements
* Understand the regulations in your jurisdiction
* Seek professional advice for complex trading strategies
LIMITATION OF LIABILITY
Indemnification
The creator and distributor of this indicator shall not be liable for:
* Any trading losses, whether direct or indirect
* Inaccurate or delayed price data
* System failures or technical malfunctions
* Loss of data or profits
* Interruption of service or connectivity issues
No Warranty
This indicator is provided "as is" without warranties of any kind:
* No guarantee of accuracy or completeness
* No warranty of uninterrupted or error-free operation
* No warranty of merchantability or fitness for a particular purpose
* The software may contain bugs or errors
Maximum Liability
In no event shall the liability exceed the purchase price (if any) paid for this indicator. This limitation applies regardless of the theory of liability, whether contract, tort, negligence, or otherwise.
REGULATORY COMPLIANCE
Jurisdiction-Specific Risks
* Regulations vary by country and region
* Some jurisdictions prohibit or restrict certain trading strategies
* Tax implications differ based on your location and trading frequency
* Commodity futures and options trading may have additional requirements
* Currency trading may be regulated differently than stock trading
Professional Trading
* If you are a professional trader, ensure compliance with all applicable regulations
* Adhere to fiduciary duties and best execution requirements
* Maintain required records and reporting
* Follow market abuse regulations and insider trading laws
TECHNICAL SPECIFICATIONS
Data Sources
* Calculations based on TradingView data feeds
* Data accuracy depends on broker and exchange reporting
* Historical data may be subject to adjustments and corrections
* Real-time data may have delays depending on data providers
Software Limitations
* Internet connectivity required for proper operation
* Software updates may change calculations or functionality
* TradingView platform dependencies may affect performance
* Third-party integrations may introduce additional risks
MONEY MANAGEMENT RECOMMENDATIONS
Conservative Approach
* Risk only 1-2% of capital per trade
* Use position sizing based on volatility
* Maintain adequate cash reserves
* Avoid over-leveraging accounts
Portfolio Management
* Diversify across multiple strategies
* Don't put all capital into one approach
* Regularly review and adjust trading strategies
* Maintain detailed trading records
FINAL LEGAL NOTICES
Acceptance of Terms
* By using this indicator, you acknowledge that you have read and understood this disclaimer
* You agree to assume all risks associated with trading
* You confirm that you are legally permitted to trade in your jurisdiction
Updates and Changes
* This disclaimer may be updated without notice
* Continued use constitutes acceptance of any changes
* It is your responsibility to stay informed of updates
Governing Law
* This disclaimer shall be governed by the laws of the jurisdiction where the indicator was created
* Any disputes shall be resolved in the appropriate courts
* Severability clause: If any part of this disclaimer is invalid, the remainder remains enforceable
REMEMBER: THERE ARE NO GUARANTEES IN TRADING. THE MAJORITY OF RETAIL TRADERS LOSE MONEY. TRADE AT YOUR OWN RISK.
Contact Information:
* Creator: Hitesh_Nimje
* Phone: Contact@8087192915
* Source: Thought Magic Trading
© HiteshNimje - All Rights Reserved
This disclaimer should be prominently displayed whenever the indicator is shared, sold, or distributed to ensure users are fully aware of the risks and limitations involved in trading.

12M Return Strategy This strategy is based on the original Dual Momentum concept presented by Gary Antonacci in his book “Dual Momentum Investing.”
It implements the absolute momentum portion of the framework using a 12-month rate of change, combined with a moving-average filter for trend confirmation.
The script automatically adapts the lookback period depending on chart timeframe, ensuring the return calculation always represents approximately one year, whether you are on daily, weekly, or monthly charts.
How the Strategy Works
1. 12-Month Return Calculation
The core signal is the 12-month price return, computed as:
(Current Price ÷ Price from ~1 year ago) − 1
This return:
Plots as a histogram
Turns green when positive
Turns red when negative
The lookback adjusts automatically:
1D chart → 252 bars
1W chart → 52 bars
1M chart → 12 bars
Other timeframes → estimated to approximate 1 calendar year
2. Trend Filter (Moving Average of Return)
To smooth volatility and avoid noise, the strategy applies a moving average to the 12M return:
Default length: 12 periods
Plotted as a white line on the indicator panel
This becomes the benchmark used for crossovers.
3. Trade Signals (Long / Short / Cash)
Trades are generated using a simple crossover mechanism:
Bullish Signal (Go Long)
When:
12M Return crosses ABOVE its MA
Action:
Close short (if any)
Enter long
Bearish Signal (Go Short or Go Flat)
When:
12M Return crosses BELOW its MA
Action:
If shorting is enabled → Enter short
If shorting is disabled → Exit position and go to cash
Shorting can be enabled or disabled with a single input switch.
4. Position Sizing
The strategy uses:
Percent of Equity position sizing
You can specify the percentage of your portfolio to allocate (default 100%).
No leverage is required, but the strategy supports it if your account settings allow.
5. Visual Signals
To improve clarity, the strategy marks signals directly on the indicator panel:
Green Up Arrows: return > MA
Red Down Arrows: return < MA
A status label shows the current mode:
LONG
SHORT
CASH
6. Backtest-Ready
This script is built as a full TradingView strategy, not just an indicator.
This means you can:
Run complete backtests
View performance metrics
Compare long-only vs long/short behavior
Adjust inputs to tune the system
It provides a clean, rule-driven interpretation of the classic absolute momentum approach.
Inspired By: Gary Antonacci – Dual Momentum Investing
This script reflects the absolute momentum side of Antonacci’s original research:
Uses 12-month momentum (the most statistically validated lookback)
Applies a trend-following overlay to control downside risk
Recreates the classic signal structure used in academic studies
It is a simplified, transparent version intended for practical use and educational clarity.
Disclaimer
This script is for educational and research purposes only.
Historical performance does not guarantee future results.
Always use proper risk management.

Obsidian Flux Matrix# Obsidian Flux Matrix | JackOfAllTrades
Made with my Senior Level AI Pine Script v6 coding bot for the community!
Narrative Overview
Obsidian Flux Matrix (OFM) is an open-source Pine Script v6 study that fuses social sentiment, higher timeframe trend bias, fair-value-gap detection, liquidity raids, VWAP gravitation, session profiling, and a diagnostic HUD. The layout keeps the obsidian palette so critical overlays stay readable without overwhelming a price chart.
Purpose & Scope
OFM focuses on actionable structure rather than marketing claims. It documents every driver that powers its confluence engine so reviewers understand what triggers each visual.
Core Analytical Pillars
1. Social Pulse Engine
Sentiment Webhook Feed: Accepts normalized scores (-1 to +1). Signals only arm when the EMA-smoothed value exceeds the `sentimentMin` input (0.35 by default).
Volume Confirmation: Requires local volume > 30-bar average × `volSpikeMult` (default 2.0) before sentiment flags.
EMA Cross Validation: Fast EMA 8 crossing above/below slow EMA 21 keeps momentum aligned with flow.
Momentum Alignment: Multi-timeframe momentum composite must agree (positive for longs, negative for shorts).
2. Peer Momentum Heatmap
Multi-Timeframe Blend: RSI + Stoch RSI fetched via request.security() on 1H/4H/1D by default.
Composite Scoring: Each timeframe votes +1/-1/0; totals are clamped between -3 and +3.
Intraday Readability: Configurable band thickness (1-5) so scalpers see context without losing space.
Dynamic Opacity: Stronger agreement boosts column opacity for quick bias checks.
3. Trend & Displacement Framework
Dual EMA Ribbon: Cyan/magenta ribbon highlights immediate posture.
HTF Bias: A higher-timeframe EMA (default 55 on 4H) sets macro direction.
Displacement Score: Body-to-ATR ratio (>1.4 default) detects impulses that seed FVGs or VWAP raids.
ATR Normalization: All thresholds float with volatility so the study adapts to assets and regimes.
4. Intelligent Fair Value Gap (FVG) System
Gap Detection: Three-candle logic (bullish: low > high ; bearish: high < low ) with ATR-sized minimums (0.15 × ATR default).
Overlap Prevention: Price-range checks stop redundant boxes.
Spacing Control: `fvgMinSpacing` (default 5) avoids stacking from the same impulse.
Storage Caps: Max three FVGs per side unless the user widens the limit.
Session Awareness: Kill zone filters keep taps focused on London/NY if desired.
Auto Cleanup: Boxes delete when price closes beyond their invalidation level.
5. VWAP Magnet + Liquidity Raid Engine
Session or Rolling VWAP: Toggle resets to match intraday or rolling preferences.
Equal High/Low Scanner: Looks back 20 bars by default for liquidity pools.
Displacement Filter: ATR multiplier ensures raids represent genuine liquidity sweeps.
Mean Reversion Focus: Signals fire when price displaces back toward VWAP following a raid.
6. Session Range Breakout System
Initial Balance Tracking: First N bars (15 default) define the session box.
Breakout Logic: Requires simultaneous liquidity spikes, nearby FVG activity, and supportive momentum.
Z-Score Volume Filter: >1.5σ by default to filter noisy moves.
7. Lifestyle Liquidity Scanner
Volume Z-Scores: 50-bar baseline highlights statistically significant spikes.
Smart Money Footprints: Bottom-of-chart squares color-code buy vs sell participation.
Panel Memory: HUD logs the last five raid timestamps, direction, and normalized size.
8. Risk Matrix & Diagnostic HUD
HUD Structure: Table in the top-right summarizes HTF bias, sentiment, momentum, range state, liquidity memory, and current risk references.
Signal Tags: Aggregates SPS, FVG, VWAP, Range, and Liquidity states into a compact string.
Risk Metrics: Swing-based stops (5-bar lookback) + ATR targets (1.5× default) keep risk transparent.
Signal Families & Alerts
Social Pulse (SPS): Volume-confirmed sentiment alignment; triangle markers with “SPS”.
Kill-Zone FVG: Session + HTF alignment + FVG tap; arrow markers plus SL/TP labels.
Local FVG: Captures local reversals when HTF bias has not flipped yet.
VWAP Raid: Equal-high/low raids that snap toward VWAP; “VWAP” label markers.
Range Breakout: Initial balance violations with liquidity and imbalance confirmation; circle markers.
Liquidity Spike: Z-score spikes ≥ threshold; square markers along the baseline.
Visual Design & Customization
Theme Palette: Primary background RGB (12,6,24). Accent shading RGB (26,10,48). Long accents RGB (88,174,255). Short accents RGB (219,109,255).
Stylized Candles: Optional overlay using theme colors.
Signal Toggles: Independently enable markers, heatmap, and diagnostics.
Label Spacing: Auto-spacing enforces ≥4-bar gaps to prevent text overlap.
Customization & Workflow Notes
Adjust ATR/FVG thresholds when volatility shifts.
Re-anchor sentiment to your webhook cadence; EMA smoothing (default 5) dampens noise.
Reposition the HUD by editing the `table.new` coordinates.
Use multiples of the chart timeframe for HTF requests to minimize load.
Session inputs accept exchange-local time; align them to your market.
Performance & Compliance
Pure Pine v6: Single-line statements, no `lookahead_on`.
Resource Safe: Arrays trimmed, boxes limited, `request.security` cached.
Repaint Awareness: Signals confirm on close; alerts mirror on-chart logic.
Runtime Safety: Arrays/loops guard against `na`.
Use Cases
Measure when social sentiment aligns with structure.
Plan ICT-style intraday rebalances around session-specific FVG taps.
Fade VWAP raids when displacement shows exhaustion.
Watch initial balance breaks backed by statistical volume.
Keep risk/target references anchored in ATR logic.
Signal Logic Snapshot
Social Pulse Long/Short: `sentimentEMA` gated by `sentimentMin`, `volSpike`, EMA 8/21 cross, and `momoComposite` sign agreement. Keeps hype tied to structural follow-through.
Kill-Zone FVG Long/Short: Requires session filter, HTF EMA bias alignment, and an active FVG tap (`bullFvgTap` / `bearFvgTap`). Labels include swing stops + ATR targets pulled from `swingLookback` and `liqTargetMultiple`.
Local FVG Long/Short: Uses `localBullish` / `localBearish` heuristics (EMA slope, displacement, sequential closes) to surface intraday reversals even when HTF bias has not flipped.
VWAP Raids: Detect equal-high/equal-low sweeps (`raidHigh`, `raidLow`) that revert toward `sessionVwap` or rolling VWAP when displacement exceeds `vwapAlertDisplace`.
Range Breakouts: Combine `rangeComplete`, breakout confirmation, liquidity spikes, and nearby FVG activity for statistically backed initial balance breaks.
Liquidity Spikes: Volume Z-score > `zScoreThreshold` logs direction, size, and timestamp for the HUD and optional review workflows.
Session Logic & VWAP Handling
Kill zone + NY session inputs use TradingView’s session strings; `f_inSession()` drives both visual shading and whether FVG taps are tradeable when `killZoneOnly` is true.
Session VWAP resets using cumulative price × volume sums that restart when the daily timestamp changes; rolling VWAP falls back to `ta.vwap(hlc3)` for instruments where daily resets are less relevant.
Initial balance box (`rangeBars` input) locks once complete, extends forward, and stays on chart to contextualize later liquidity raids or breakouts.
Parameter Reference
Trend: `emaFastLen`, `emaSlowLen`, `htfResolution`, `htfEmaLen`, `showEmaRibbon`, `showHtfBiasLine`.
Momentum: `tf1`, `tf2`, `tf3`, `rsiLen`, `stochLen`, `stochSmooth`, `heatmapHeight`.
Volume/Liquidity: `volLookback`, `volSpikeMult`, `zScoreLen`, `zScoreThreshold`, `equalLookback`.
VWAP & Sessions: `vwapMode`, `showVwapLine`, `vwapAlertDisplace`, `killSession`, `nySession`, `showSessionShade`, `rangeBars`.
FVG/Risk: `fvgMinTicks`, `fvgLookback`, `fvgMinSpacing`, `killZoneOnly`, `liqTargetMultiple`, `swingLookback`.
Visualization Toggles: `showSignalMarkers`, `showHeatmapBand`, `showInfoPanel`, `showStylizedCandles`.
Workflow Recipes
Kill-Zone Continuation: During the defined kill session, look for `killFvgLong` or `killFvgShort` arrows that line up with `sentimentValid` and positive `momoComposite`. Use the HUD’s risk readout to confirm SL/TP distances before entering.
VWAP Raid Fade: Outside kill zone, track `raidToVwapLong/Short`. Confirm the candle body exceeds the displacement multiplier, and price crosses back toward VWAP before considering reversions.
Range Break Monitor: After the initial balance locks, mark `rangeBreakLong/Short` circles only when the momentum band is >0 or <0 respectively and a fresh FVG box sits near price.
Liquidity Spike Review: When the HUD shows “Liquidity” timestamps, hover the plotted squares at chart bottom to see whether spikes were buy/sell oriented and if local FVGs formed immediately after.
Metadata
Author: officialjackofalltrades
Platform: TradingView (Pine Script v6)
Category: Sentiment + Liquidity Intelligence
Hope you Enjoy!

Ichimoku Multi-Timeframe Heatmap 12/5/2025
Multi-Timeframe Ichimoku Heatmap - Scan Your Watchlist in Seconds
This indicator displays all 5 critical Ichimoku signals (Cloud Angle, Lagging Line, Price vs Cloud, Kijun Slope, and Tenkan/Kijun Cross) across 10 timeframes (15s, 1m, 3m, 5m, 15m, 30m, 1h, 4h, Daily, Weekly) in one compact heatmap table. Instantly spot multi-timeframe trend alignment with color-coded cells: green for bullish, red for bearish, and gray for neutral. Perfect for quickly scanning through your entire watchlist to identify the strongest setups with confluent signals across all timeframes.

White Crow**White Crow — cluster reversal signals + market structure**
> Indicator that helps you read market structure (pivots, trend, last extremes) and spot potential reversals through CCI/RSI signal clusters. This is *not* a standalone trading system and does not guarantee any result — it is a tool for filtering and confirming your own market ideas.
---
## 1. Concept
White Crow combines three core blocks:
1. **Pivots & market structure**
Automatically detects **local tops/bottoms** and derives a *Bullish / Bearish / Sideways* bias from them.
In the top-right corner you see a compact panel with current trend and **Last Bottom / Last Top** prices.
2. **Momentum & overbought/oversold zones**
Inside, the indicator uses:
* **CCI** with fixed levels `+100 / -100`;
* an optional **RSI filter** with overbought/oversold levels (`80 / 20`).
These generate basic *Buy / Close* signals.
3. **Cluster signals Buy X / CloseV**
The script tracks **clusters of signals inside a 4-bar window** and highlights rarer, “amplified” events:
* **Buy X** — cluster buy signal (multiple buy conditions in a row);
* **CloseV** — cluster signal for exit/reversal.
**Buy X and CloseV are the strongest and most reliable signals in this indicator** because they are based on repeated conditions rather than a single bar. They work **best on higher timeframes (1H–4H)**, where they reflect meaningful shifts in order flow instead of noise.
> ⚠️ Important: Buy X and CloseV are *only signals*. They must be used as **one of several confirmation factors** for your own view of market structure (support/resistance, trend, price action, volume, etc.), not as standalone reasons to enter or exit trades.
---
## 2. How it works
### 2.1. Pivots and trend detection
* The indicator builds a **zigzag-like structure**:
after a local high, once price retraces down by a given percentage (`pivotSigma`), a **Top** is marked;
after a local low, once price retraces up by the same percentage, a **Bottom** is marked.
* Using the sequence of recent tops and bottoms, the script determines the trend:
* *Bullish* — the last low is higher than the previous one (HL);
* *Bearish* — the last high is lower than the previous one (LH);
* otherwise — *Sideways*.
* The info table shows:
* **Market Trend** — Bullish / Bearish / Sideways;
* **Last Bottom / Last Top** with adaptive decimal precision (works for crypto, FX, stocks, etc.).
### 2.2. Base Buy / Close signals
* **Long condition (Buy):**
* `CCI < -100` (oversold),
* if RSI filter is enabled — `RSI < 20`.
* **Short/Exit condition (Close):**
* `CCI > +100` (overbought),
* if RSI filter is enabled — `RSI > 80`.
These conditions generate the regular **Buy** and **Close** labels on the chart.
### 2.3. Clusters: Buy X and CloseV
To reduce noise, the indicator evaluates not only the current bar, but also the **last 4 bars**:
* `buy_count` — how many times the long condition was true within the last 4 bars;
* `sell_count` — how many times the short condition was true within the last 4 bars.
Then:
* **Buy X** appears when:
* `buy_count ≥ 2` (conditions for Buy were met on at least 2 of the last 4 bars),
* the time filter between two Buy X signals is satisfied (`Min Bars Between Signals`).
* **CloseV** appears when:
* `sell_count ≥ 2`,
* the required number of bars has passed since the previous CloseV.
> ✅ This is why **Buy X / CloseV are stronger and more trustworthy than single Buy/Close signals**, especially on **1H–4H** timeframes: the market confirms the same overbought/oversold condition several times in a row.
### 2.4. Order Blocks
* When `Show Order Blocks` is enabled, the indicator highlights **impulsive candles** whose body exceeds a threshold based on ATR.
* Colored rectangles mark **potential order blocks** (areas where strong buying or selling previously occurred).
## 3. Inputs and customization
Inputs are grouped in TradingView-friendly categories.
### 3.1. Pivot Settings
* `Show Pivots` — enable/disable **Top / Bottom** markers.
* `Sigma (% retracement)` — pivot sensitivity (minimum retracement in % required to confirm a pivot).
* Colors for Top/Bottom — for visual tuning.
**Tip:**
On H1–H4 you can keep near-default values.
On lower timeframes, reduce `Sigma` if you want more detailed local structure.
### 3.2. CCI / RSI Settings
* `CCI Period` — CCI length (short by default for faster reaction).
* `Enable RSI Filter` / `RSI Period` — toggle and length for RSI filter.
* RSI levels are fixed at **20 / 80** to mark strong oversold/overbought zones.
**Usage:**
* For more conservative entries — keep the RSI filter enabled.
* For more frequent signals (e.g. scalping) — you can disable the RSI filter.
### 3.3. Order Blocks
* `Show Order Blocks` — display order block zones.
* `Block Threshold (ATR multiplier)` — how large a candle must be (vs ATR) to be considered significant.
### 3.4. Signals & Filters
* `Show Buy / Show Buy X / Show Close / Show CloseV` — choose which labels you want to see.
* `Enable Time Filter` — enable minimum spacing between amplified signals.
* `Min Bars Between Signals` — how many bars must pass between two Buy X or two CloseV signals.
**Tip:**
If you see too many amplified signals, increase `Min Bars Between Signals`.
If you want more activity, decrease it.
### 3.5. Alerts
* `Buy Alerts / Buy X Alerts / Close Alerts / CloseV Alerts` — choose which signal types should trigger alerts.
* `One Alert Per Bar` — when enabled, alerts are triggered only once per bar (recommended for H1–H4).
Alerts are generated via `alert()`, with messages that include signal type, ticker, timeframe and current price.
---
## 4. How to trade with White Crow
### 4.1. Recommended timeframes
* 📌 **Main focus: 1H–4H.**
On these timeframes:
* pivots and trend are more stable;
* CCI/RSI reflect meaningful swings;
* **Buy X / CloseV clusters** filter out a lot of intrabar noise.
You can still experiment on M1–M15, but expect more signals and more sensitivity to noise.
### 4.2. Reading the signals step by step
1. **Start with context**
* Look at **Market Trend / Last Bottom / Last Top** in the info panel.
* See where price is relative to these points: near resistance, near support, inside a range, etc.
2. **Identify zones of interest**
* Use pivots and order blocks as potential support/resistance areas.
* Wait for price to approach these zones.
3. **Watch the signals**
* **Buy** — early sign of local oversold conditions.
* **Buy X** — amplified cluster signal; more weight than a single Buy.
* **Close** — early warning of potential exhaustion in the current move.
* **CloseV** — amplified cluster exit/reversal signal.
4. **Practical approach**
* In a *Bullish* trend:
* focus on **Buy / Buy X** near bottoms and demand blocks;
* use **Close / CloseV** for partial profit-taking or tightening stops.
* In a *Bearish* trend:
* focus on **Close / CloseV** near tops and supply blocks;
* use **Buy / Buy X** mainly for countertrend scalps with strict risk control.
---
## 5. Important notes and disclaimer
1. **Buy X / CloseV are stronger — but not “magic” signals.**
They are statistically more meaningful than single Buy/Close signals because:
* they require multiple confirmations within a cluster;
* they are time-filtered.
However, **false signals are still possible**, especially in news spikes and low-liquidity conditions.
2. **Best performance on higher timeframes (1H–4H).**
Here, Buy X and CloseV usually reflect genuine shifts in supply/demand rather than micro noise.
3. **This is a confirmation tool, not a complete system.**
Pro Trading White Crow:
* does not manage risk;
* does not define position size or stop-loss;
* does not replace your own analysis.
Always use its signals as **one of several confluence factors** together with structure, trend, price action, volume, and your trading plan.
4. **Educational purpose only.**
This script and description are for educational and analytical purposes only.
They **do not constitute investment advice or a guarantee of profit**.
You are fully responsible for all trading decisions and risk management.
---
---
## White Crow — кластерные сигналы разворота + структура рынка
> Индикатор помогает читать рыночную структуру (пивоты, тренд, последние экстремумы) и находить потенциальные развороты через кластеры сигналов CCI/RSI. Это *не* готовая торговая система и *не* гарантия результата — а инструмент для фильтрации и подтверждения ваших собственных идей по рынку.
---
## 1. Концепция
White Crow объединяет три ключевых блока:
1. **Пивоты и структура рынка**
Автоматически находит **локальные вершины и впадины** и на их основе формирует трендовое смещение: *Bullish / Bearish / Sideways*.
В правом верхнем углу — компактная панель с текущим трендом и ценами **Last Bottom / Last Top**.
2. **Моментум и зоны перегрева**
Внутри используются:
* **CCI** с фиксированными уровнями `+100 / -100`;
* опциональный **фильтр RSI** с уровнями перепроданности/перекупленности (`20 / 80`).
По ним строятся базовые сигналы *Buy / Close*.
3. **Кластерные сигналы Buy X / CloseV**
Скрипт отслеживает **кластеры сигналов внутри окна в 4 бара** и выделяет более редкие, «усиленные» события:
* **Buy X** — кластерный сигнал покупки (несколько buy-условий подряд);
* **CloseV** — кластерный сигнал выхода/разворота.
Именно **Buy X и CloseV являются наиболее сильными и достоверными сигналами индикатора**, так как возникают при повторяющемся выполнении условий, а не на одном баре. Лучше всего они работают **на старших таймфреймах (1–4 часа)**, где отражают реальное смещение баланса спроса/предложения, а не рыночный шум.
> ⚠️ Важно: Buy X и CloseV — *это всего лишь сигналы*. Они должны использоваться **как один из факторов подтверждения** вашего видения структуры рынка (уровни, тренд, price action, объём и т.д.), а не как единственная причина для входа или выхода.
---
## 2. Как это работает
### 2.1. Пивоты и определение тренда
* Индикатор строит **структуру в стиле зигзага**:
после локального максимума, когда цена откатывает вниз на заданный процент (`pivotSigma`), отмечается **Top**;
после локального минимума, когда цена откатывает вверх на тот же процент, отмечается **Bottom**.
* По последовательности последних вершин и впадин определяется тренд:
* *Bullish* — последний минимум выше предыдущего (HL);
* *Bearish* — последний максимум ниже предыдущего (LH);
* иначе — *Sideways*.
* В информационной таблице отображаются:
* **Market Trend** — Bullish / Bearish / Sideways;
* **Last Bottom / Last Top** с адаптивным количеством знаков (подходит под крипту, форекс, акции и т.д.).
### 2.2. Базовые сигналы Buy / Close
* **Условие для Buy (лонг):**
* `CCI < -100` (зона перепроданности),
* при включённом фильтре — `RSI < 20`.
* **Условие для Close (шорт/выход):**
* `CCI > +100` (зона перекупленности),
* при включённом фильтре — `RSI > 80`.
По этим условиям индикатор рисует обычные метки **Buy** и **Close**.
### 2.3. Кластеры: Buy X и CloseV
Чтобы отсеять лишний шум, индикатор оценивает не только текущий бар, но и **4 последних бара**:
* `buy_count` — сколько раз условие на покупку выполнялось за последние 4 бара;
* `sell_count` — сколько раз условие на продажу/выход выполнялось за последние 4 бара.
Далее:
* **Buy X** появляется, когда:
* `buy_count ≥ 2` (минимум на 2 из 4 баров были условия для покупки),
* соблюдён фильтр по времени между усиленными сигналами (`Min Bars Between Signals`).
* **CloseV** появляется, когда:
* `sell_count ≥ 2`,
* прошло достаточно баров с момента предыдущего CloseV.
> ✅ Поэтому **Buy X и CloseV заметно сильнее и надёжнее одиночных Buy/Close**, особенно на **таймфреймах 1–4 часа**: рынок несколько раз подряд подтверждает один и тот же перегрев/разрядку момента.
### 2.4. Order Blocks
* При включённом `Show Order Blocks` индикатор выделяет **импульсные свечи**, чьё тело больше заданного множителя ATR.
* По таким свечам строятся цветные прямоугольники — **потенциальные блоки ордеров** (области поддержек/сопротивлений, где ранее проходил крупный объём).
---
## 3. Настройки и кастомизация
Настройки сгруппированы в привычные разделы TradingView.
### 3.1. Pivot Settings
* `Show Pivots` — включить/выключить метки **Top / Bottom**.
* `Sigma (% retracement)` — чувствительность к пивотам (минимальная глубина отката в процентах).
* Цвета Top/Bottom — визуальная настройка.
**Совет:**
На H1–H4 можно оставить значения близкие к стандартным.
На младших ТФ уменьшайте `Sigma`, если нужна более детальная структура.
### 3.2. CCI / RSI Settings
* `CCI Period` — период CCI (по умолчанию короткий, для более быстрой реакции).
* `Enable RSI Filter` / `RSI Period` — включение и длина RSI-фильтра.
* Уровни RSI фиксированы: **20 / 80**, выделяя сильную перепроданность/перекупленность.
**Использование:**
* Для более консервативной торговли — держите фильтр RSI включённым.
* Для более частых сигналов (скальпинг и т.п.) — можно фильтр отключить.
### 3.3. Order Blocks
* `Show Order Blocks` — отображение блоков ордеров.
* `Block Threshold (ATR multiplier)` — насколько большой должна быть свеча относительно ATR, чтобы считаться значимой.
### 3.4. Signals & Filters
* `Show Buy / Show Buy X / Show Close / Show CloseV` — выбор типов отображаемых меток.
* `Enable Time Filter` — включение минимального интервала между усиленными сигналами.
* `Min Bars Between Signals` — сколько баров должно пройти между двумя Buy X или двумя CloseV.
**Совет:**
Если усиленных сигналов слишком много — увеличьте `Min Bars Between Signals`.
Если хотите больше активности — уменьшите это значение.
### 3.5. Alerts
* `Buy Alerts / Buy X Alerts / Close Alerts / CloseV Alerts` — выбор типов сигналов для алертов.
* `One Alert Per Bar` — при включении алерты отправляются один раз на бар (рекомендуется для H1–H4).
Алерты формируются через `alert()` с сообщением, включающим тип сигнала, тикер, таймфрейм и текущую цену.
---
## 4. Как использовать White Crow в торговле
### 4.1. Рекомендуемые таймфреймы
* 📌 **Основной фокус: 1–4 часа.**
На этих ТФ:
* структура по пивотам и тренд более стабильны;
* CCI/RSI отражают существенные ценовые колебания;
* кластеры **Buy X / CloseV** лучше отсеивают шум.
На M1–M15 индикатор тоже можно применять, но нужно быть готовым к большему количеству сигналов и чувствительности к микродвижениям.
### 4.2. Пошаговое чтение сигналов
1. **Начните с контекста**
* Посмотрите на **Market Trend / Last Bottom / Last Top** в панели.
* Определите, где находитесь относительно этих уровней: у сопротивления, у поддержки, внутри диапазона и т.п.
2. **Найдите зоны интереса**
* Используйте пивоты и order blocks как потенциальные области спроса/предложения.
* Ждите подхода цены к этим зонам.
3. **Отслеживайте сигналы**
* **Buy** — ранний признак локальной перепроданности.
* **Buy X** — усиленный кластерный сигнал, более значимый, чем одиночный Buy.
* **Close** — ранний сигнал возможного ослабления текущего движения.
* **CloseV** — усиленный кластерный сигнал выхода/разворота.
4. **Практическое применение**
* В *бычьем* тренде:
* фокус на **Buy / Buy X** возле впадин и зон спроса;
* **Close / CloseV** использовать для частичной фиксации и подтягивания стопа.
* В *медвежьем* тренде:
* фокус на **Close / CloseV** возле вершин и зон предложения;
* **Buy / Buy X** — для аккуратных контртрендовых входов с жестким риском.
---
## 5. Важные замечания и дисклеймер
1. **Buy X / CloseV сильнее, но не «волшебные» сигналы.**
Они статистически более значимы, чем одиночные Buy/Close, потому что:
* требуют нескольких подтверждений в кластере;
* фильтруются по времени.
Однако **ложные срабатывания всё равно возможны**, особенно на новостях и в условиях низкой ликвидности.
2. **Оптимальная область применения — старшие ТФ (1–4 часа).**
Здесь Buy X и CloseV обычно отражают реальное изменение баланса спроса/предложения, а не шум.
3. **Это инструмент подтверждения, а не полноценная система.**
Pro Trading White Crow:
* не управляет рисками;
* не считает размер позиции и уровень стоп-лосса;
* не заменяет ваше собственное видение рынка.
Всегда используйте его сигналы **как один из факторов согласованности** вместе со структурой, трендом, price action, объёмом и персональным торговым планом.
4. **Образовательный характер.**
Скрипт и описание предназначены для обучения и анализа графиков.
Они **не являются инвестиционной рекомендацией и не гарантируют прибыль**.
Вы самостоятельно принимаете все торговые решения и несёте полную ответственность за риск.
---
