Elder's Force Index Double combined by iduThe idea is to see Elder's force index smoothed EMA in different time frame simultaneously.
Default intervals are (2) and (13)
Base on samuel16 script.
Wyszukaj w skryptach "细算江西救护车家长倒赚了四万三+-医疗花费13万(家长视频)++医保报"

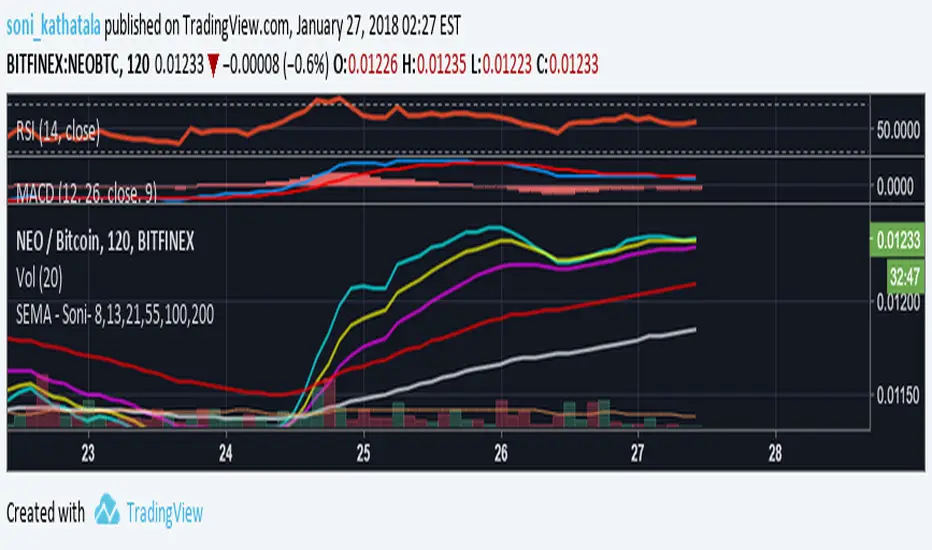
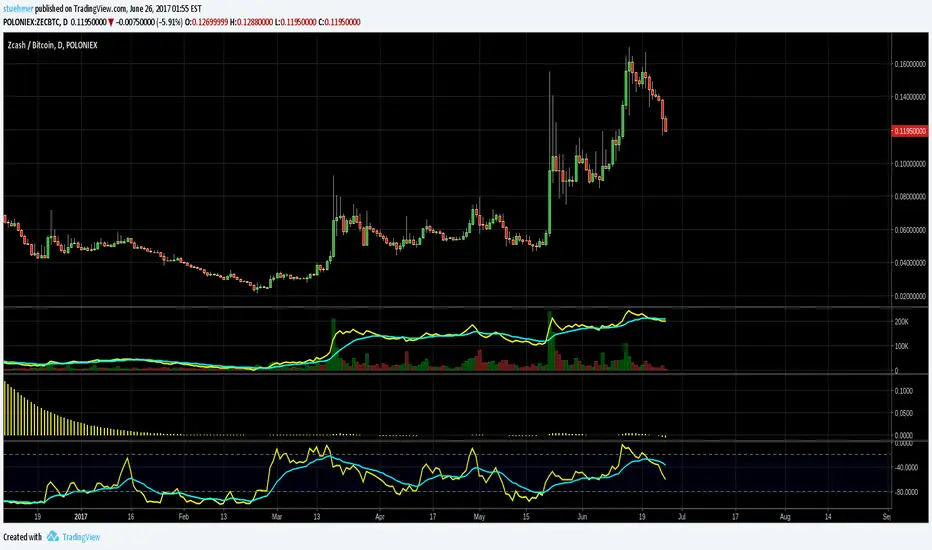
Quadruple Moving Averages For Day TradingQuadruple Moving Averages For Day Trading Crypto
Inputs of 8,13,21,55
Based on chart used by Philakone.


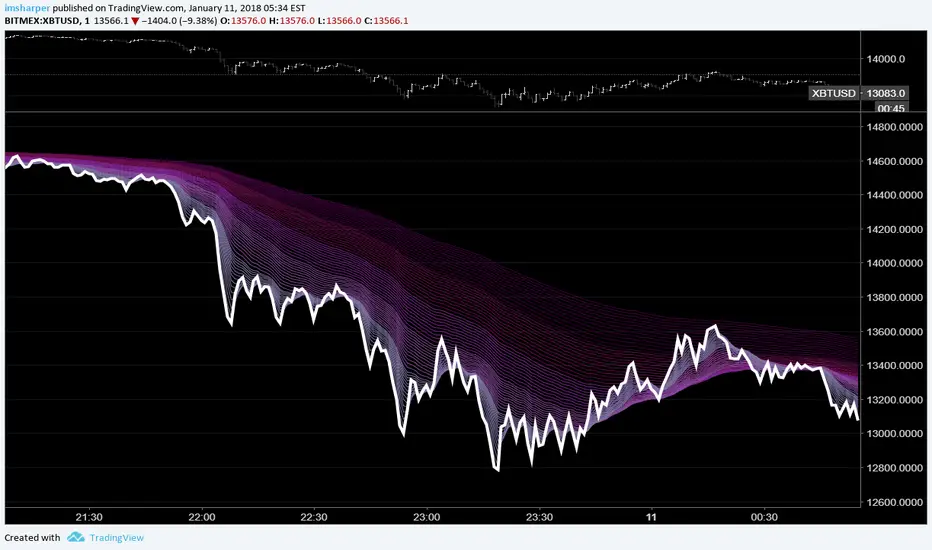
Rainbow MA StudyI've been interested in 'Multiple Moving Averages' lately and came across another script on here for a Rainbow MA.
Unfortunately its source is private and I wanted to try things out with other MA types so I put this together.
I also wanted to make it a seperate study so I could view regular bars without the clutter.
The general rule of thumb with these is the larger the price movement the wider the lines become giving you sort of a wave effect.
When the lines bunch up together you know there's going to be a breakout opportunity that will present itself.
Partly art, partly practical, entirely overkill. Enjoy!
The anchor multiplier should basically allow you to view things in relation to another time period, but it takes forever to load and will likely time out.
Since there are 63 MA's being calculated and plotted changing options on the fly takes some time to process and load.
I'm also pretty new to pine script so it's probably not the best implementation.
MA types: EMA (default), SMA, WMA, VWMA, SMMA, DEMA, TEMA, HullMA, ZEMA, TMA, SSMA
Play around with these to see some different effects.
The white line is the current close price.
Color 1 МАs: 2,3, 4, 5, 6, 7, 8, 9, 10, 11, 12, 13, 14, 15
Color 2 MAs: 17, 19, 21, 23, 25, 27, 29, 31, 33, 35, 37, 39, 41
Color 3 MAs: 44, 47, 50, 53, 56, 59, 62, 65, 68, 71, 74
Color 4 MAs: 78, 82, 86, 90, 94, 98, 102, 106, 110, 114, 118, 122
Color 5 MAs: 126, 131, 137, 143, 149, 155, 155, 161, 167, 173, 179, 185, 191, 197
You can more easily change the colors at the top of this source code instead of one by one in the settings.
If you want this on your main chart instead of a separate window you'll just need to change overlay=true in the study.
References & Thanks:
JustUncleL:
For the timeframe anchor, MA variants, and generally awesome work. This is more practical.
StickyCheeba:
For the idea.
Here's some shots to get an idea of the differences.
HullMA:
VWMA:
SSMA:
TMA:
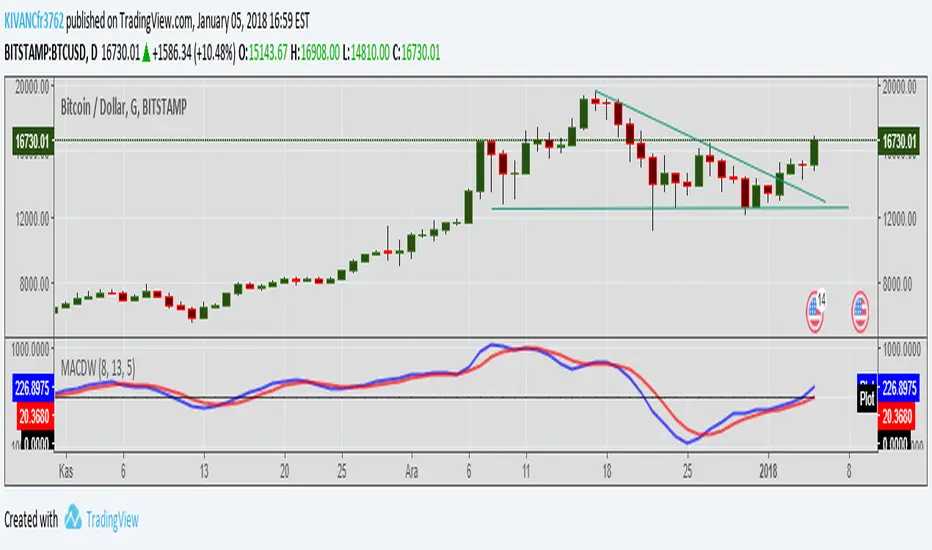
MACDeA different style of MACD indicator with different period values of WEIGHTED and EXPONENTIAL MOVING AVERAGES INSTEAD OF only EXPONENTIAL.
Default MOVING AVERAGES ARE
faster period: 8bars EMA
slower period: 13 bars EMA
signal period: 5 bars WMA
TURKISH EXPLANATION:
MACD indikatörünün sadece üssel yerine AĞIRLIKLI ve ÜSSEL hareketli ortalamalar kullanılarak daha erken sinyaller alabilmek için daha kısa periyotlarla yorumlanması
fikir @kenyaborsa on twitter
yazar: KIVANÇ @fr3762 on twitter

MACD WEIGHTEDA different style of MACD indicator with different period values of WEIGHTED MOVING AVERAGES INSTEAD OF EXPONENTIAL.
Default MOVING AVERAGES ARE
faster period: 8bars
slower period: 13 bars
signal period: 5 bars
TURKISH EXPLANATION:
MACD indikatörünün üssel yerine AĞIRLIKLI hareketli ortalamalar kullanılarak daha erken sinyaller alabilmek için daha kısa periyotlarla yorumlanması

EMA StrategyThis strategy is in testing and development.
**USE AT YOUR OWN RISK. **
This defaults to a 13/48 EMA using the closing price. When the fast EMA crosses above the slow it triggers a buy. When it crosses below the slow EMA it triggers a sell and potentially a short, but that is not implemented. Stops, trailing stops, and pyramiding to be added. The purpose of this strategy is to signal recommended entry and exit point and back test whether the strategy works. It is not intended to be an automated buy/sell script.
* stop loss added. Not yet configurable from the settings panel. Defaults to 8% from the entry price.
TODO:
Add the ability to configure the stop-loss level in the settings panel
Add trailing stop functionality
Add profit taking, likely configurable sell targets (2:1 risk to reward gain for example)
Add another signal or two to help improve odds of making a winning trade.

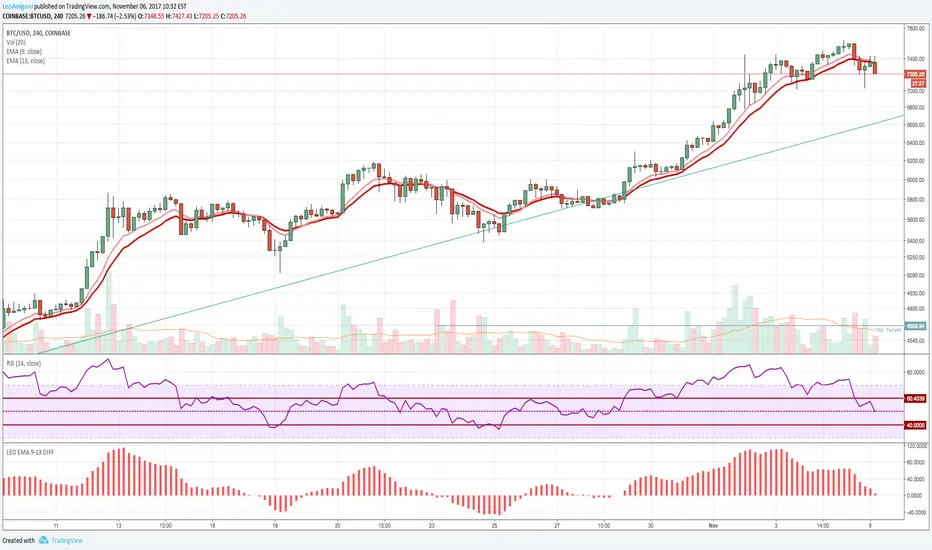
LEO EMA 9-13 DIFFI made a public version of the private one that I made since I had so many requests.
Good indicator for buy and sell signals, better for buys usually works well on any timeframes. I use it on the 15m, 1hr, 4hr mostly.
You can plot the EMA's also on the chart to see the lines crossing but this indicator gives you a much easier read. It's very simple and basic all I do is plot the difference between the EMA 9 and the EMA 13. These values seem to give a very clear signal for entries and exits.
How to use.
- When the histogram becomes positive it's a buy signal when it becomes negative it's a sell signal.
- Note: Like any moving average this doesn't work well if you have a massive dip or a massive spike as the average will signal too late. but you should get some warning right before it happens.
Big Snapper Alerts R2.0 by JustUncleLThis is a diversified Binary Option or Scalping Alert indicator originally designed for lower Time Frame Trend or Swing trading. Although you will find it a useful tool for higher time frames as well.
The Alerts are generated by the changing direction of the ColouredMA (HullMA by default), you then have the choice of selecting the Directional filtering on these signals or a Bollinger swing reversal filter.
The filters include:
Type 1 - The three MAs (EMAs 21,55,89 by default) in various combinations or by themselves. When only one directional MA selected then direction filter is given by ColouredMA above(up)/below(down) selected MA. If more than one MA selected the direction is given by MAs being in correct order for trend direction.
Type 2 - The SuperTrend direction is used to filter ColouredMA signals.
Type 3 - Bollinger Band Outside In is used to filter ColouredMA for swing reversals.
Type 4 - No directional filtering, all signals from the ColouredMA are shown.
Notes:
Each Type can be combined with another type to form more complex filtration.
Alerts can also be disabled completely if you just want one indicator with one colouredMA and/or 3xMAs and/or Bollinger Bands and/or SuperTrend painted on the chart.
Warning:
Be aware that combining Bollinger OutsideIn swing filter and a directional filter can be counter productive as they are opposites. So careful consideration is needed when combining Bollinger OutsideIn with any of the directional filters.
Hints:
For Binary Options try ColouredMA = HullMA(13) or HullMA(8) with Type 2 or 3 Filter.
When using Trend filters SuperTrend and/or 3xMA Trend, you will find if price reverses and breaks back through the Big Fat Signal line, then this can be a good reversal trade.
Some explanation about the what Hull Moving average and ideas of how the generated in Big Snapper can be used:
tradingsim.com
forextradingstrategies4u.com
Inspiration from @vdubus
Big Snapper's Bollinger OutsideIn Swing filter in Action:

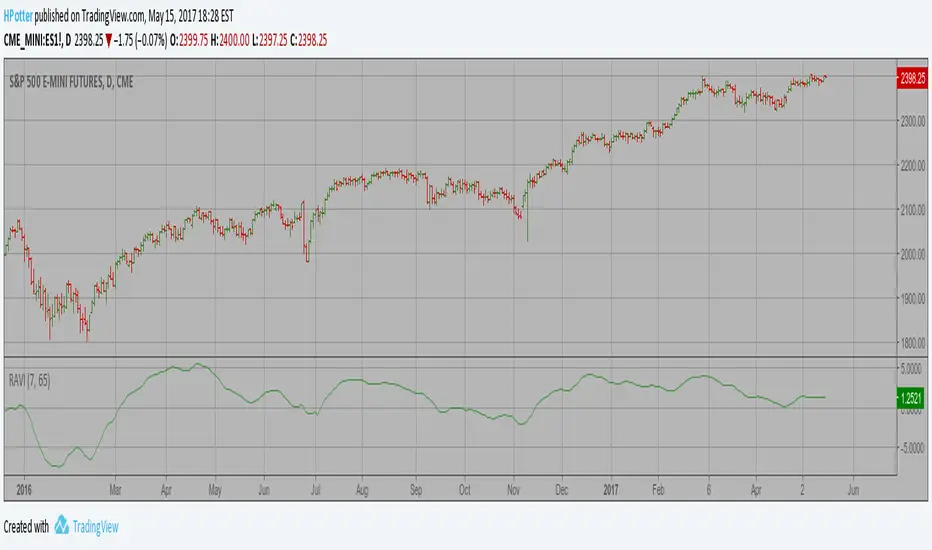
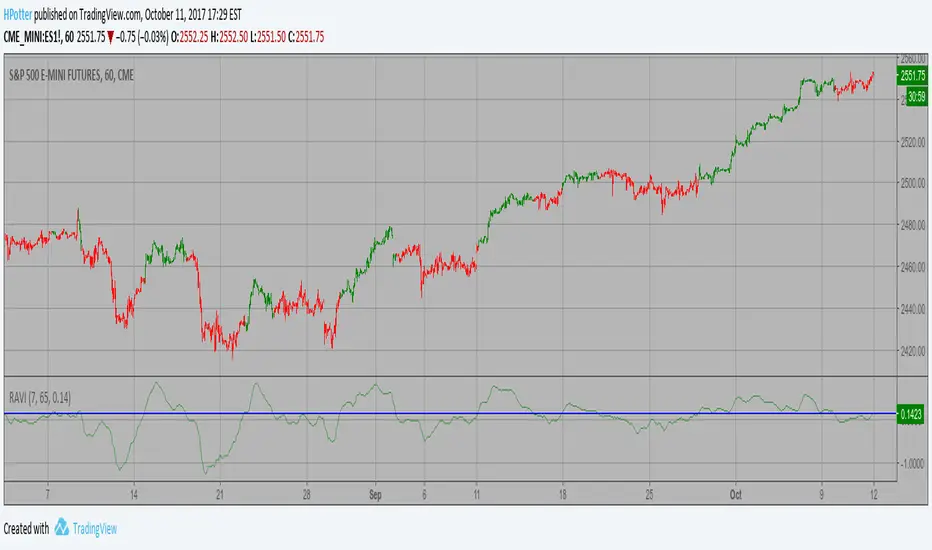
Range Action Verification Index (RAVI) Backtest The indicator represents the relative convergence/divergence of the moving
averages of the financial asset, increased a hundred times. It is based on
a different principle than the ADX. Chande suggests a 13-week SMA as the
basis for the indicator. It represents the quarterly (3 months = 65 working days)
sentiments of the market participants concerning prices. The short moving average
comprises 10% of the one and is rounded to seven.
You can change long to short in the Input Settings
WARNING:
- For purpose educate only
- This script to change bars colors.

Range Action Verification Index (RAVI) Strategy The indicator represents the relative convergence/divergence of the moving
averages of the financial asset, increased a hundred times. It is based on
a different principle than the ADX. Chande suggests a 13-week SMA as the
basis for the indicator. It represents the quarterly (3 months = 65 working days)
sentiments of the market participants concerning prices. The short moving average
comprises 10% of the one and is rounded to seven.
WARNING:
- This script to change bars colors.
True Strength Indicator BTCUSD 2HScript based on True Strength Index (TSI) and RSI
A technical momentum indicator that helps traders determine overbought and oversold conditions of a security by incorporating the short-term purchasing momentum of the market with the lagging benefits of moving averages. Generally a 25-day exponential moving average (EMA) is applied to the difference between two share prices, and then a 13-day EMA is applied to the result, making the indicator more sensitive to prevailing market conditions.
!!! IMPORTANT IN ORDER TO AVOID REPAITING ISSUES
!!! USE Chart resolution >= resCustom parameter, suggestion 2H
Yellow zones indicates that you can claim position for better profits even before a claim confirmation.
Dark zones indicates areas where RSI shows overbought and oversold conditions.
BTCUSD

Auto DayWeekMonth Fib Levels R2 by JustUncleLThis indicator automatically draws up to Three Sets of Fibonacci Pivot levels based on the previous Candle period's Range (High-Low). The HLC3 is used as the default Pivotal level. Only the most Recent period Candle Levels are displayed. The longer Weekly and Monthly sets are particularly useful in finding long term Supply and Demand levels.
The three sets of selectable periods are spit into the following sets:
Daily Set (1,2,3,4,5,7,10 or 14 Days)
Weekly Set (1,2,3,4,5,10, or 13 Weeks)
Monthly Set (1,2,3,4,5,6,9 or 12 months)
Each set has the option to display Extension levels.
The Pivotal Level HLC3 and Range = (High - Low), are extracted from previous Period Candle.
FIB LEVELS Colours (same in each period set):
Yellow = Pivot and Pivot Zone (HLC3 by default)
Fuchsia = R1,S1 Levels 0.368 * Range
Lime = R2,S2 Levels 0.618 * Range
Red = R3,S3 Levels 0.786 * Range
Aqua = R4,S4 Levels 1.000 * Range
Green = R5,S5 Levels 1.236 * Range
Orange = R6,S6 Levels 1.382 * Range
Black = R7,S7 Levels 1.618 * Range
Maroon = R8,S8 Levels 2.000 * Range

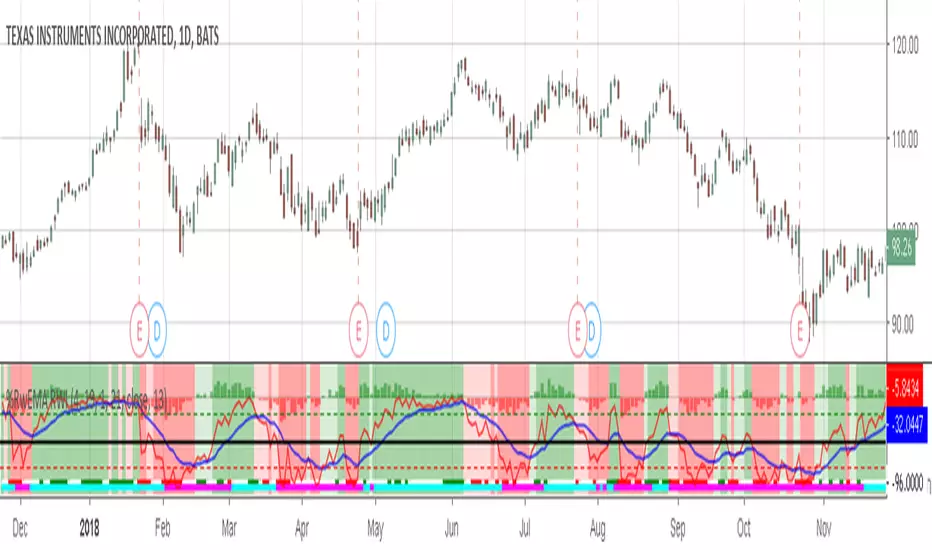
Willams %RwEMAspy
Was looking for something else when surfed into an old question
wanting %R 21 period with EMA 13 period of the %R signal
and being a rookie at this, made this code to post for them.
Tried to comment the script in such a way that other rookies
like me could make better sense of what is being done. Hope
this helps someone. I find it useful as one of my indicators for
trading.
Pinescript for tradingview.com user Tom1trader
All time frames.
Interpretation:
%R (Red) crosses above it's average (Blue) - bull
%R crosses below it's average - bear. Background
color changes green-up red-down with above crossings.
Most but not all of serious price movement takes place
from the time the %R (red) goes into oversold (or bought) and
exits again.
%R centerline crosses can also be useful.
I use various indicators and want all of the confirmation
that I can get for expectations BUT I never know what the
next bar will do and define my risks accordingly.
RinganTrend 0.4This is from SuperTrend.
But I changed manything. so now i call it ringanTrend.
now v0.4
buy at green arrow. (end of black line)
sell at red arrow. (end of blue line)
but be carefull. it may take your money.
look at the chart. left side it take trader's money often.(but small)
also i published v0.3 before
so you can use 0.3 and 0.4 at the same time.
you can change 4 value.
v0.3 setting is 4, 13, 8, 5
0.4's default setting is for shooter(maybe)
2, 4, 1, 1
you trade often in 0.4 default setting than v0.3
and i fixed small bug.
I am not sure i will make v0.5
cause ...i guess i cannot make better than this.
SuperTrend is so nice idea already!! especially for alt-coin
you can see difference.
in korean
빨간화살표에서 파세요 (파란선이 끝나는 점)
녹색화살표에서 사세요 (검은선이 끝나는 점)

On Balance VolumeThe script applies an EMA to OBV . By default, the EMA=13 periods. All calculations are based off the closing price.
Williams %RThe script applies an EMA to the Williams %R. By default, the %R=21 while the EMA=13 periods. All calculations are based off the closing price.

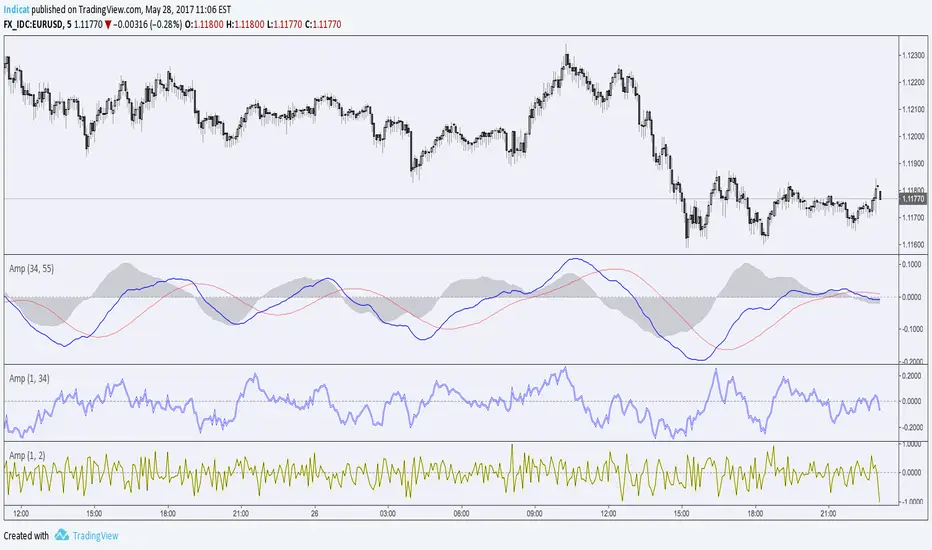
Amplitude IndicatorHello Traders,
Amplitude is the measurement of the difference between the variable's extreme values.
This indicator is based on the Balance of Power (close-open)/(high-low).
Instead of taking the value of a single candlestick, exponential moving averages are used in the formula.
On it's lowest settings (1,2) it's exactly the same as the Balance of power, by adjusting the smoothing you can seen the highs and lows in momentum of the chosen period. (highly adjustable RSI)
By adding a simple moving average (Signal Line) it turns into a cross-over type, like MACD with a histogram.
This indicator is doesn't have a default or 'best' setting, instead I use the Fibonacci numbers as input. (1,2,3,5,8,13,21,34,55,89,144).
Depending on its settings this indicator is well suited for binary options, trend and reversal trading.
Cheers, Indicat...
Range Action Verification Index (RAVI) The indicator represents the relative convergence/divergence of the moving
averages of the financial asset, increased a hundred times. It is based on
a different principle than the ADX. Chande suggests a 13-week SMA as the
basis for the indicator. It represents the quarterly (3 months = 65 working days)
sentiments of the market participants concerning prices. The short moving average
comprises 10% of the one and is rounded to seven.