4EMA (8,13,21,55) + DC (100,200) + BB + S&R by @PIXELSNAPSHOTIn this indicator you find Total 6 EMA , 4 slow and same as fibonashi & another 2 is long term + you get death cross + you get Bollenger band + you get support & resistance indicator
Wyszukaj w skryptach "细算江西救护车家长倒赚了四万三+-医疗花费13万(家长视频)++医保报"


TRI MA DominoBlue lines are first group (3,5,8,13,21) SMA and red lines are second group (35,40,45,50,55) SMA. When blue lines cross above red lines that signals bull market and vice versa. More lines we have above or bellow (creating domino effect) the stronger the signal for bull/bear.
This indicator should be used to determine where are we currently in the market and should we expect trend change/transition or continuation.
It should not be used as sole indicator for taking trades but as a tool to help you with TA and your trading plan.
Good hunting ;)

AIO EMA by bacoskunAIO EMA script contains EMA 8,13,21,34,55,89,144,200,233 together..
You can change each EMA period whatever you want
and can visible/invisible what you needed with select/deselect checkbox

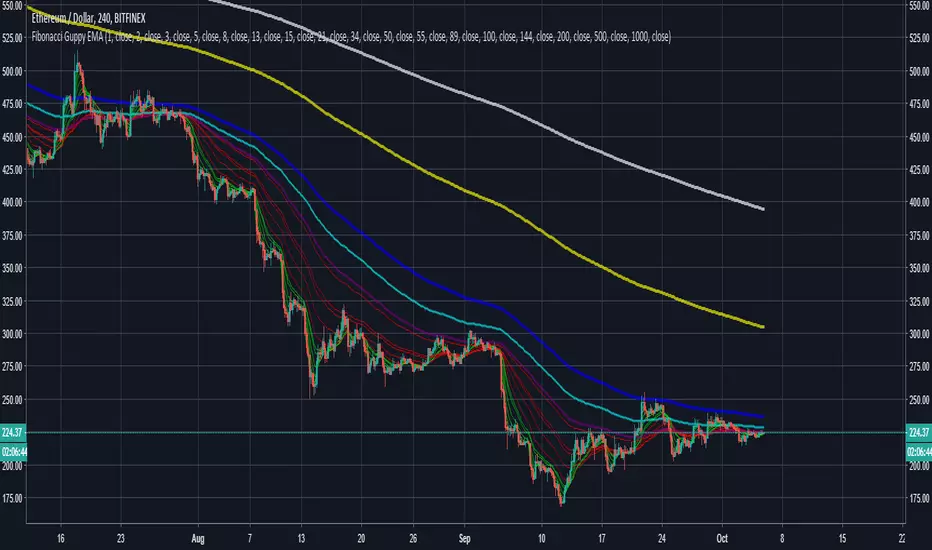
Fibonacci Guppy EMAGuppy EMA that uses fibonacci numbers instead of standard guppy numbers.
EMA's used: 1, 2, 3, 5, 8, 13, 15, 21, 34, (50), 55, 89, (100), 144, (200), (500), (1000)
Alto Basso Swing Pivots + Barry Support Resistance Levels2 indicators, 1 script: swing pivots and Barry support resistance levels
Alto
high swing pivot
Basso
low swing pivot
Dal Segno
lookback period length for swing pivots
Barry Length
length for support resistance calculation
--------------------------------------------------------------------------------------------------------------------------------------------------------------------------------------------
Use swing pivots for confirmation of new structure levels on short term
Barry support resistance levels in proximity to standard pivots or Fibonacci levels may indicate greater strength
credit to BacktestRookies and likebike
stay ♯
Example: Dal Segno 13, Barry Length 21

Willams %R with 13 EMA - TRIBased on alexpunct's work.
I simply added a second Willy plot and EMA which allows you to plot Willy and its EMA for a second time frame on the same chart.
The idea is that you will only enter a trade if there is confluence on the two time frames i.e. Willy is stupidly oversold/overbought on both the 4h and 12h or 1h and 4h time frames.
I will be testing this and will adapt

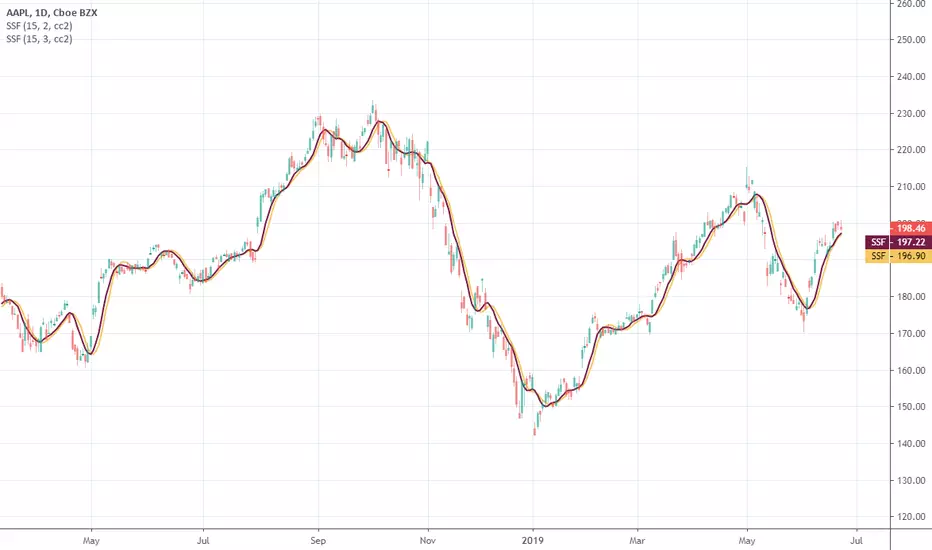
Ehlers Super Smoother FilterEhlers Super Smoother Filter script.
This indicator was originally developed by John F. Ehlers (see his book `Cybernetic Analysis for Stocks and Futures`, Chapter 13: `Super Smoothers`).
Multi SMA EMA WMA HMA BB (4x3 MAs Bollinger Bands) Pro MTF - RRBMulti SMA EMA WMA HMA 4x3 Moving Averages with Bollinger Bands Pro MTF by RagingRocketBull 2018
Version 1.0
This indicator shows multiple MAs of any type SMA EMA WMA HMA etc with BB and MTF support, can show MAs as dynamically moving levels.
There are 4 MA groups + 1 BB group. You can assign any type/timeframe combo to a group, for example:
- EMAs 50,100,200 x H1, H4, D1, W1 (4 TFs x 3 MAs x 1 type)
- EMAs 8,13,21,55,100,200 x M15, H1 (2 TFs x 6 MAs x 1 type)
- D1 EMAs and SMAs 12,26,50,100,200,400 (1 TF x 6 MAs x 2 types)
- H1 WMAs 7,77,231; H4 HMAs 50,100,200; D1 EMAs 144,169,233; W1 SMAs 50,100,200 (4 TFs x 3 MAs x 4 types)
- +1 extra MA type/timeframe for BB
compile time: 25-30 sec
full redraw time after parameter change in UI: 3 sec
There are several versions: Simple, MTF, Pro MTF, Advanced MTF and Ultimate MTF. This is the Pro MTF version. The Differences are listed below. All versions have BB
- Simple: you have 2 groups of MAs that can be assigned any type (5+5)
- MTF: +2 custom Timeframes for each group (2x5 MTF)
- Pro MTF: +4 custom Timeframes for each group (4x3 MTF), MA levels and show max bars back options
- Advanced MTF: +2 extra MAs/group (4x5 MTF), custom Ticker/Symbol, backreferences for type, TF and MA lengths in UI
- Ultimate MTF: +individual settings for each MA, custom Ticker/Symbols
Features:
- 4x3 = 12 MAs of any type including Hull Moving Average (HMA)
- 4x MTF groups with step line smoothing
- BB +1 extra TF/type for BB MAs
- 12 MA levels with adjustable group offsets, indents and shift
- show max bars back
- you can show/hide both groups of MAs/levels and individual MAs
Notes:
1. based on 3EmaBB, uses plot*, barssince and security functions
2. you can't set certain constants from input due to Pinescript limitations - change the code as needed, recompile and use as a private version
3. Levels = trackprice implementation
4. Show Max Bars Back = show_last implementation
5. uses timeframe textbox instead of input resolution to allow for 120 240 and other custom TFs. Also supports TFs in hours: 2H or H2
6. swma has a fixed length = 4, alma and linreg have additional offset and smoothing params
7. Smoothing is applied by default for visual aesthetics on MTF. To use exact ma mtf values (lines with stair stepping) - disable it
MTF Notes:
- uses simple timeframe textbox instead of input resolution dropdown to allow for 120, 240 and other custom TFs, also supports timeframes in H: 2H, H2
- Groups that are not assigned a Custom TF will use Current Timeframe (0).
- MTF will work for any MA type assigned to the group
- MTF works both ways: you can display a higher TF MA/BB on a lower TF or a lower TF MA/BB on a higher TF.
- MTF MA values are normally aligned at the boundary of their native timeframe. This produces stair stepping when a higher TF MA is viewed on a lower TF.
Therefore X Y Point Density/Smoothing is applied by default on MA MTF for visual aesthetics. Set both to 0 to disable and see exact ma mtf values (lines with stair stepping and original mtf alignment).
- Smoothing is disabled for BB MTF bands because fill doesn't work with smoothed MAs after duplicate values are replaced with na.
- MTF MA Value fluctuation is possible on the current bar due to default security lookahead
Smoothing:
- X,Y == 0 - X,Y smoothing disabled (stair stepping on high TFs)
- X == 0, Y > 0 - X,Y smoothing applied to all TFs
- Y == 0, X > 0 - X smoothing applied to all TFs < deltaX_max_tf, Y smoothing disabled
- X > 0, Y > 0 - Y smoothing applied to all TFs, then X smoothing applied to all TFs < deltaX_max_tf
X Smoothing with Y == 0 - shows only every deltaX-th point starting from the first bar.
X Smoothing with Y > 0 - shows only every deltaX-th point starting from the last shown Y point, essentially filling huge gaps remaining after Y Smoothing with points and preserving the curve's general shape
X Smoothing on high TFs with already scarce points produces weird curve shapes, it works best only on high density lower TFs
Y Smoothing reduces points on all TFs, removes adjacent points with prices within deltaY, while preserving the smaller curve details.
A combination of X,Y produces the most accurate smoothing. Higher delta value - larger range, more points removed.
Show Max Bars Back:
- can't set plot show_last from input -> implemented using a timenow based range check
- you can't delete/modify history once plotted, so essentially it just sets a start point for plotting (from num_bars bars back) that works only in realtime mode (not in replay)
Levels:
You can plot current MA value using plot trackprice=true or by checking Show Price Line in Style. Problem is:
- you can only change color (not the dashed line style, width), have both ma + price line (not just the line), and it's full screen wide
- you can't set plot trackprice from input => implemented using plotshape/plotchar with fixed text labels serving as levels
- there's no other way of creating a dynamic level: hline, plot, offset - nothing else works.
- you can't plot a text var - all text strings must be constants, so you can't change the style, width and text labels without recompiling.
- from input you can only adjust offset, indent and shift for each level group, and change color
- the dot below each level line is the exact MA value. If you want just the line swap plotshape with plotchar, recompile and save as your private version, adjust Y shift.
To speed up redraw times: reduce last_bars to ~2000, recompile and use as your own private version
Pinescript is a rudimentary language (should be called Painscript instead) that can basically only plot data. You can't do much else. Please see the code for tips and hints.
Certain things just can't be done or require shady workarounds and weeks of testing trying to resolve weird node.js compiler errors.
Feel free to learn from/reuse/change the code as needed and use as your own private version. See comments in code. Good Luck!

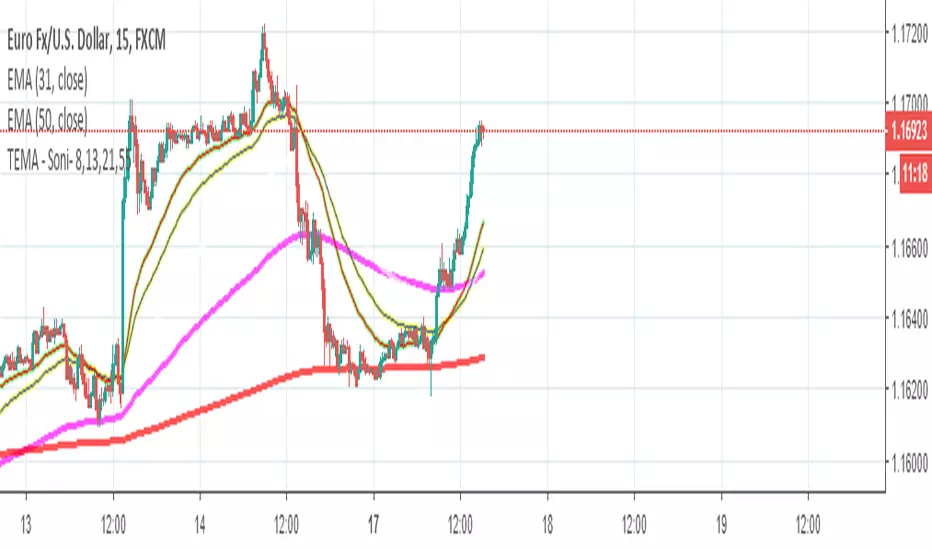
SHERRIFx (variation) IN TRENDI share this script where I made some modifications to the SHERRIF strategy to perform trend scalping.
I use:
- Bollinguer Bands (20)
- CCIs (14 and 40)
- EMAS (20, 57, 100, 200)
- Stochastics (13,3,3) in 70, 30.
I apply in low temporalities, especially M15 and M1, it can also be used to make binaries or in higher temporalities by modifying the constants.
If you improve this program, share it.
Greetings.

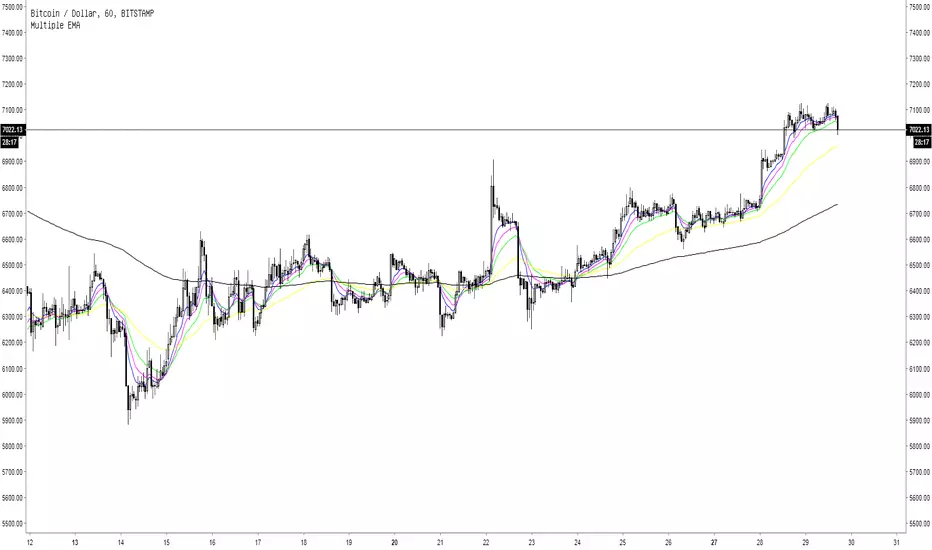
Multiple EMA5 Exponential Moving Averages
EMA 1: length 8, blue line
EMA 2: length 13, pink line
EMA 3: length 21, green line
EMA 4: length 55, yellow line
EMA 5: length 200, black line

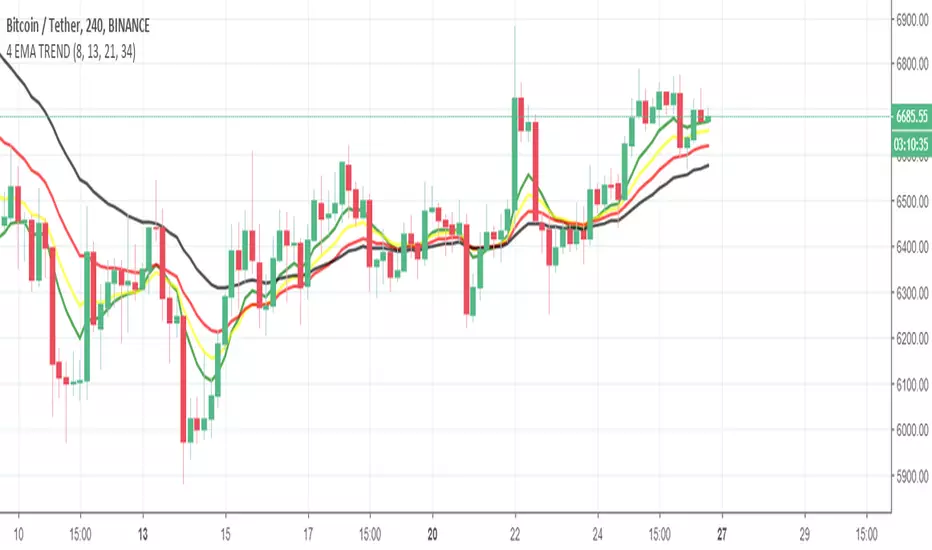
4 EMA TREND INDICATORİf GREEN > YELLOW > RED > BLACK
UPWARD TREND
If BLACK > RED > YELLOW > GREEN
DOWNWARD TREND
In upward trend , if green(fastest ema) crossunder YELLOW or RED or both of them , you can close the position . Dont wait the Downward Trend.
Lengths of EMAs are based on Fibonacci numbers ( 8,13,21,34) , if you want, you can change it based on your strategy.
Fibonacci Based EMA Ribbon3,8,13,21,55,90,124,235,386 ma/ema Can be color customized to suit you, based on fibonacci, similar to ribbon and guppy

1D & 4H MACD by mattzab1 Day MACD with a color coded area style histogram, with a black line indicating the 4H histogram with + markers to indicate true 4H crosses.
The black line is the outline of the 4H histogram, with a floating cross above to confirm that it is above 0.
4H histogram settings = 6, 13, 5 MACD. Not a true 4H resolution, but extremely close. Effectively, the black line is actually a 2X speed MACD. I prefer it over a true 4H indication.


6 EMA Crypto InvestidorExponential Moving Averages - 6 EMA Crypto Investidor
Indicator developed to facilitate the use of 6 EMAs in a single indicator.
EMAs: 9, 13, 21, 55, 100 and 200 Periods
Developed by Diego do Youtube Channel Crypto Investor

Moe's Multi EMA'sOriginal Code By Ahoudori
Values by Moe.
Yet another Multi EMA indicator. I edited Ahoudori's Multi EMA indicator to this one so I could toggle between these values, and other values in another Multi EMA indicator without having to re-enter the values into a single indicator each time.
The default values are 14, 21, 55, and 100. These are based on the Fibonacci sequence. 14 is chosen over 13 as it provides less "noise".

14/28 Day SMA Divergence and RSI - No RepaintIf you are interested in purchasing my algorithmic trading bot that receives Tradingview indicator alerts via email and then executes them in Bittrex, please visit my product page here: ilikestocks.com Additionally, I would love to create video/blog guides on creating Tradingview scripts or strategies. If you are a knowledgeable in finance or other related fields and would like to be featured on my page, please contact me at tanner@ilikestocks.com.
No crossovers were used in this script, and this is likely the reason for the no repaint(Correct me if wrong).
This strategy script uses a 14-day SMA signal line, a 28-day SMA and RSI. The strategy works by determining whether the (14-day SMA is above the 28-day SMA and the RSI levels are overbought(below 30)) or RSI is very overbought(below 13 or so). Once either of these conditions have been met, a long position is opened.
The initial long position must be partially closed by the take profit first and then the final close is executed if the 14-day signal SMA is below the 28-day SMA; you may also exclusively use take profit to close positions.
The green plotted spikes are the initial long position conditions. The orange plotted spikes are take profit signals once a long position is opened. The red plotted spikes are plotted when the SMA 14-day is below the 28-day SMA.
Please do leave constructive criticism or comments below because it helps me better create scripts!

ALL Philakone's EMA's (8,13,21,55,100, 200)These are Philakone's EMA's. I added the 100 day in there as I didn't see that anyone had done that.
The 100 might be the same color as the 200 looking at the code, I changed it on my chart, but just make sure you check the colors.

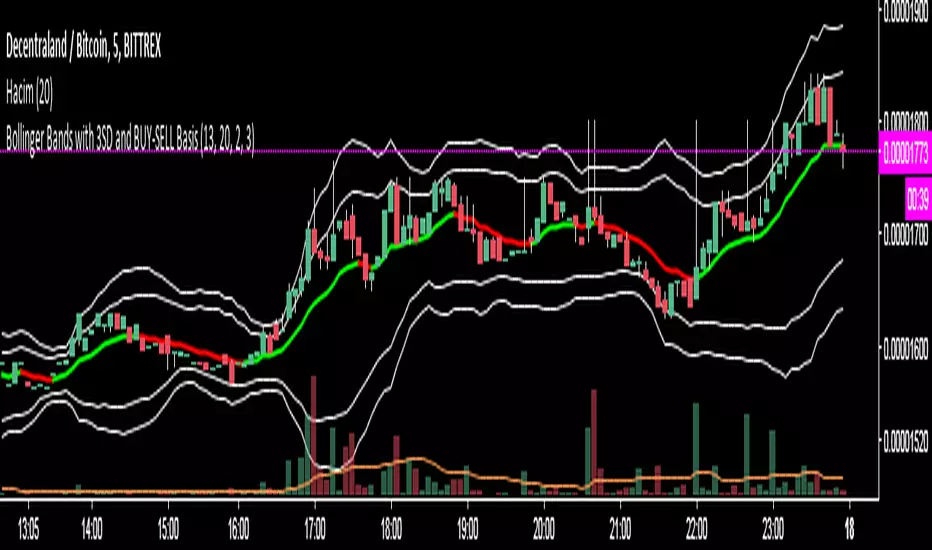
Bollinger Bands with 3SD and BUY-SELL Basis*The white lines(both inner and outer ones) are from original Bollinger Bands (calculated as SMA20+SD and SMA20-SD).
*Inner lines are calculated with 2 Standard Deviation ( as classical Bollinger Bands ) and outer ones are with 3 Standard Deviation.
*3 SD calculation is important because, it is useful to investigate further the volatility.
*Classical Bollinger Bands Basis is included in calculations to obtain the bands, but the basis isn't plotted (SMA20).
*For Basis, a-13 bar EMA line is added which tells "BUY" when GREEN, and which tells "SELL" when RED.
*Generally, this code is good to further investigate the volatility especially by the help of 3SD lines. It is particularly important for crypto currencies which are generally highly volatile. On the other hand, the basis will tell BUY-SELL points and BUY-SELL points can be confirmed further, by investigating classical Bollinger Bands rules and anticipate about the volatility.