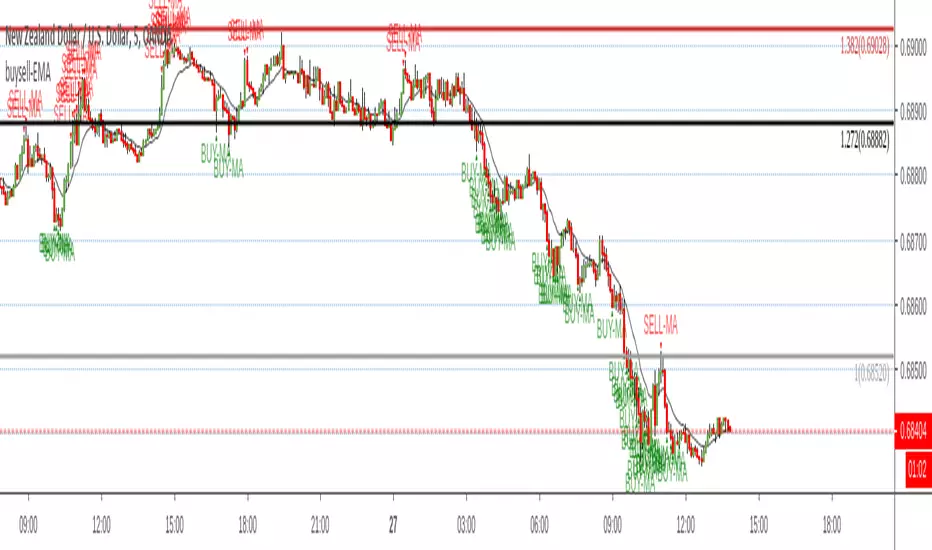
Reversal off EMASimple script find when a probable reversal will start. When price moves sharply away from the 13 EMA a BUY/SELL signal will pop up. Scripted to work on 5m 1h, 4h, and daily chart. But it doesn't work on all charts. Not sure why. I'm a forex trader and use this on NZDUSD. It doesn't give too good results on the JPY charts. I think its a fairly good reversal indicator. It definitely doesn't catch them all, and if there is a strong bearish or bullish impulse it doesn't work too well. But with all indicators, you need other conformations when to get in and when to get out. Hope it helps someone.
Wyszukaj w skryptach "细算江西救护车家长倒赚了四万三+-医疗花费13万(家长视频)++医保报"
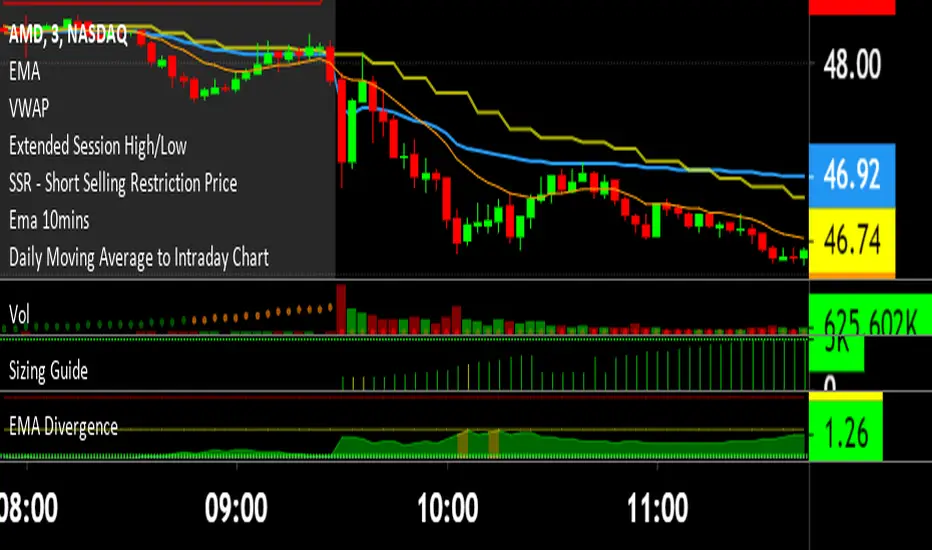
EMA DivergenceThis script automatically calculates the divergence between your favorite exponential moving average and the current price (13 ema default).
Additionally, it displays the area in yellow once the first threshold gets reached (1.5% divergence default) and in red once the second threshold gets reached (1.5% divergence default).
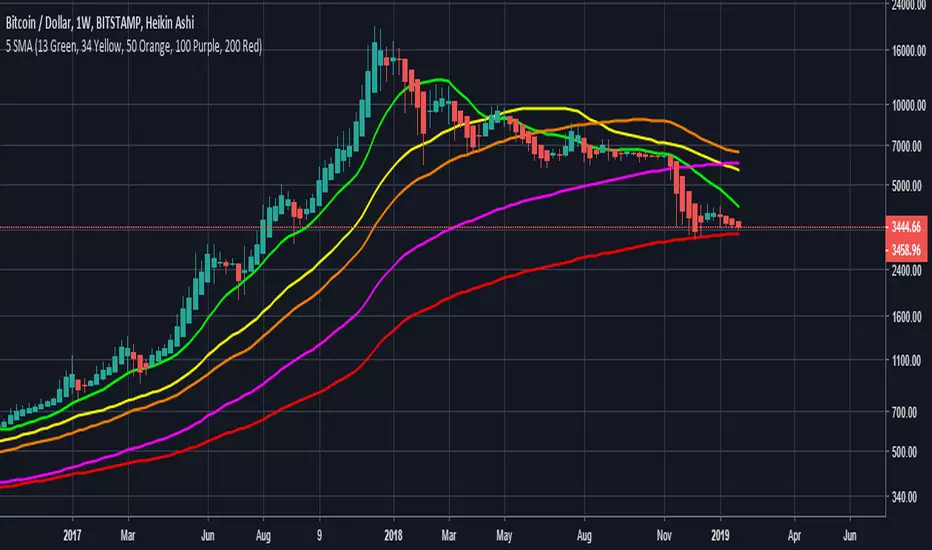
Multi SMAPlot all of the most important SMA values.
SMA 5, 8, 13 are based on Fibonaci values and frequently used in day trading frequently.
SMA 50, 100, 200 are important support/resistance lines.
Especially, SMA 50, 100, 200 are the most important support/resistance on BTC 1W. Dont forget to look at the weekly prices when trading :)

ATR+VWAP Alert//These signals mostly consist of crossovers between a 13 VWMA and a 62 VWMA. I've found these two moving averages to be quite special in their ability to
//recognize a quick trend using volume data. The VWAP is used in the alert system as well, to give some perspective on which direction we are looking to take. We
//are also using ATR. We only take trades when the ATR is on the move, meaning we have a chance to catch a volatile move! Finally, we use RSI to help weed out bad
//trades. We only take 'longs' with bullish readings from RSI, and we only take 'shorts' with bearish readings from RSI. These alerts are fantastic for catching quick intraday
//trades in either direction. I recommend using a small 'take profit' target rather than using an exit indicator. These trades can move 20-30 pips and reverse just as quickly. Good luck!
//How To Use:
//When the alert system is added to the chart, you will notice up/down symbols appear at various locations. For bullish alerts, right click an 'Up' symbol and choose 'Add Alert on VWap & ATR..'
//There are two condition options. 'Long/short', and right below that 'Buy-Signal/Sell-Signal'. Choose 'long' and 'Buy-Signal'. At options, choose 'Once Per Bar Close'. Design your alert, and you're good to go.
//For bearish signals, find a 'down' signal on the chart. Right click and follow the same process, except choosing 'short/Sell-Signal' conditions.
Tips:
Use VWAP as a stop-loss. If a candle closes below/above the VWAP in the direction against you.. get out of the trade. The losses will be minimal and few compared to the wins. Use discretion and trade carefully. This works great with crypto. Invent your own exit. If you come up with a clever exit, please share!
You can contact me at my Discord!
discord.gg


5 Simple Moving Averages5 Simple Moving Averages (13 Green, 34 Yellow, 50 Orange, 100 Purple, 200 Red)

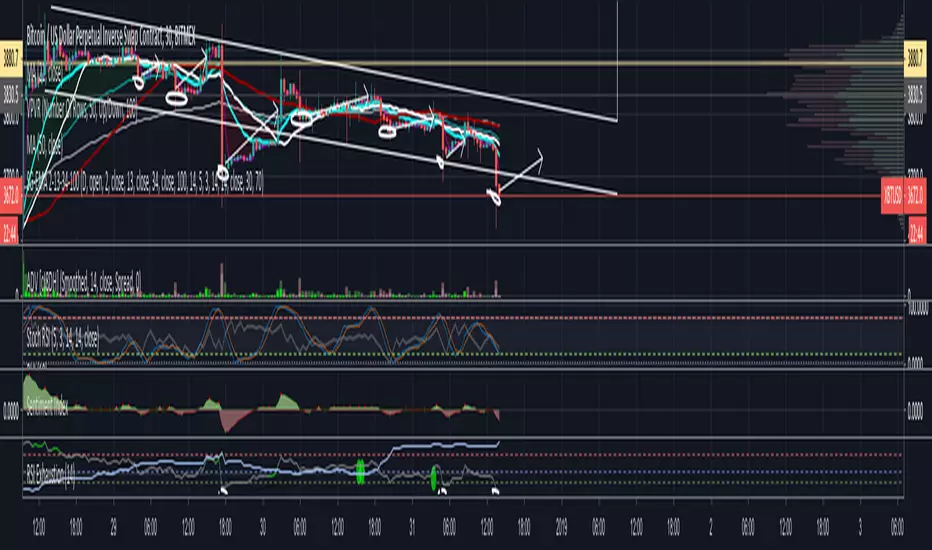
[astropark] MACD, RSI+, AO, DMI, ADX, OBV, ADI//******************************************************************************
// Copyright by astropark v4.1.0
// MACD, RSI+, Awesome Oscillator, DMI, ADX, OBV, ADI
// 24/10/2018 Added RSI with Center line to have clear glue of current trend
// 10/12/2018 Added MACD
// 13/12/2018 Added multiplier for MACD in order to make it clearly visible over RSI graph
// 11/01/2019 Added Awesome Ascillator (AO)
// 11/01/2019 Added Directional Movement Index (DMI) with ADX
// 14/01/2019 Added On Balance Volume (OBV)
// 14/01/2019 Added Accelerator Decelerator Indicator (ADI)
//******************************************************************************

[astropark] MACD, RSI+, Awesome Oscillator, DMI, ADX, OBV//******************************************************************************
// Copyright by astropark v4.0.0
// MACD, RSI+, Awesome Oscillator, DMI, ADX, OBV
// 24/10/2018 Added RSI with Center line to have clear glue of current trend
// 10/12/2018 Added MACD
// 13/12/2018 Added multiplier for MACD in order to make it clearly visible over RSI graph
// 11/01/2019 Added Awesome Oscillator (AO)
// 11/01/2019 Added Directional Movement Index (DMI) with ADX
// 14/01/2019 Added On Balance Volume (OBV)
//******************************************************************************

[astropark] MACD, RSI+, Awesome Oscillator, DMI with ADX//******************************************************************************
// Copyright by astropark v3.1.0
// MACD, RSI+, Awesome Oscillator, DMI, ADX
// 24/10/2018 Added RSI with Center line to have clear glue of current trend
// 10/12/2018 Added MACD
// 13/12/2018 Added multiplier for MACD in order to make it clearly visible over RSI graph
// 11/01/2019 Added Awesome Ascillator (AO)
// 11/01/2019 Added Directional Movement Index (DMI) with ADX
//******************************************************************************

[astropark] MACD, RSI+, Awesome Oscillator//******************************************************************************
// Copyright by astropark v3.0.0
// MACD, RSI+, Awesome Oscillator
// 24/10/2018 Added RSI with Center line to have clear glue of current trend
// 10/12/2018 Added MACD
// 13/12/2018 Added multiplier for MACD in order to make it clearly visible over RSI graph
// 11/01/2019 Added Awesome Ascillator (AO)
//******************************************************************************

Fibonacci Moving Average (EMA/SMA) Bundle //@v1.2 Fibonacci Moving Average (EMA/SMA) Bundle
//By Tantamount
//Save your TV indicator use counts by using the Fibonacci SMA/EMA all in one indicator! Toggle between Exponetial or Simple moving averages functionality, using Fibonacci the sequence.
//Fib moving averages are very good at locating support and resistance zones on multiple time frames.
//Customize and or input your very own moving average nomenclature by simply changing the input options from default: SMA (21, 55, 89, 144, 233) or EMA (21, 55, 89, 144, 233) Example: (8,13,21,55,89)
Support and Resistance Lines

Fibonacci Trendlines 8-200In my opinion best EMA Trendlines there is, simple yet very reliable on any time frame, i found the version that had 8-13-21-55, so i decided to add 100 and 200 for higher time frames enjoy please share and like

SG-2-13-34-100 EMA's with AlertsSeveral different uses, but great for scalping when watching EMA2 open crosses with EMA13 close on 1M time frames. It can give early warning before pump and dumps.
BO Willians EMA'sBo Williams is a North America/Brazilian trader. He created a trading software called PHI CUBE.
This ema ratios are very used in Brazil. They a based in the Golden Number PHI.
"There is a special ratio that can be used to describe the proportions of everything from nature's smallest building blocks, such as atoms, to the most advanced patterns in the universe, such as unimaginably large celestial bodies. Nature relies on this innate proportion to maintain balance, but the financial markets also seem to conform to this "golden ratio." Here, we take a look at some technical analysis tools that have been developed to take advantage of it.
The Mathematics
Mathematicians, scientists and naturalists have known this ratio for centuries. It's derived from something known as the Fibonacci sequence, named after its Italian founder, Leonardo Fibonacci (whose birth is assumed to be around 1175 A.D. and death around 1250 A.D.). Each term in this sequence is simply the sum of the two preceding terms (1, 1, 2, 3, 5, 8, 13, etc.).
But this sequence is not all that important; rather, it is the quotient of the adjacent terms that possesses an amazing proportion, roughly 1.618, or its inverse 0.618. This proportion is known by many names: the golden ratio, the golden mean, PHI and the divine proportion, among others. So, why is this number so important? Well, almost everything has dimensional properties that adhere to the ratio of 1.618, so it seems to have a fundamental function for the building blocks of nature. "
More here www.goldennumber.net

[astropark] MACD & RSI+//******************************************************************************
// Copyright by astropark v2.0
// MACD RSI+
// 24/10/2018 Added RSI with Center line to have clear glue of current trend
// 10/12/2018 Added MACD
// 13/12/2018 Added multiplier for MACD in order to make it clearly visible over RSI graph
//******************************************************************************

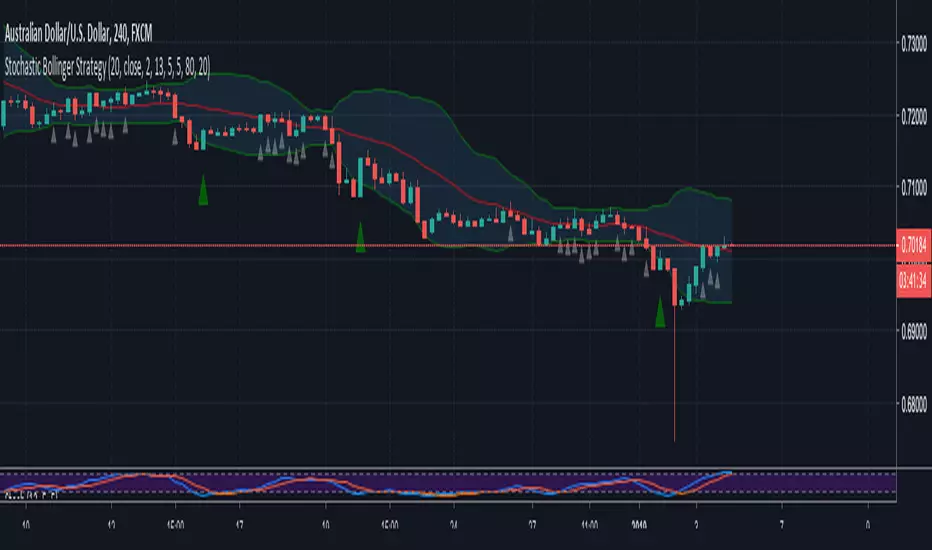
Stochastic Bollinger StrategyBollinger defaults = 20, close, 2
Stochastic defaults = 13, 5, 5
Buy Signal (GREEN triangle):
BULLISH candle formed
Candle OPEN is LESS than LOWER Bollinger Band
Stochastic (K) is LESS than 20
Sell Signal (RED triangle):
BEARISH candle formed
Candle OPEN is GREATER than UPPER Bollinger Band
Stochastic (K) is GREATER than 80
Read more about the strategy and where to set buy stops and sell stops here: swing-trading-strategies.com

Febres StrategyThe strategy consist in every time that price failed to break any of the EMAs, we need to wait for the right price action and make a buy or sell when it bounce from it to keep surfing on the trend (using the stochastic oscillator and the 5-13 EMAs cross as an additional confirmation).
When do we start looking for a change on the trend? When it repeats the blue tracer (high or low of the previous day) without breaking it and bouncing from it, there will be our signal to start looking for a change of direction on the trend.
Only applicable on 15 minute chart.

The Scale Of Sacred SoundsBased on the Sacred Sound Scale
How to use it:
This indicator is designed to capture the inferred behavior of traders and investors by using two groups of averages.
Meant for longer trades and trend indicator.
Used on any timescale as needed.
Can trade on long or short where the slow MA crosses fast Ma or where the Slow MA compresses and flips open again.
Follow the trend to the end - pot of gold at the end of the rainbow :-)
References:
Based on Daryl Guppy GMMA and
www.guppytraders.com
Read more at:
whatmusicreallyis.com
There is one tuning in which the frequencies 432, 528, 424 and 440 Hz can peacefully coexist. The scale has 32+1 pure harmonic tones and the reference frequency of 256 Hz. It comes from the Natural Ascending Series of Harmonics 32 to 64 of the 8 Hz Fundamental Tone, and represents its 6th double. I call this tuning The Scale of Sacred Sounds.
Representation using ancient Sumerian/Babylonian/Vedic math:
32; 33; 34; 35; 36; 37; 38; 39; 40; 41; 42; 43; 44; 45; 46; 47; 48; 49; 50; 51; 52; 53; 54; 55; 56; 57; 58; 59; 60; 61; 62; 63; 64
Representation using musical ratios:
1/1; 33/32; 17/16; 35/32; 9/8; 37/32; 19/16; 39/32; 5/4; 41/32; 21/16; 43/32; 11/8; 45/32; 23/16; 47/32; 3/2; 49/32; 25/16; 51/32; 13/8; 53/32; 27/16; 55/32; 7/4; 57/32; 29/16; 59/32; 15/8; 61/32; 31/16; 63/32; 2/1
The math for deriving one of the above series from the other is simple. Divide all numbers from the ancient series by the first, then simplify the fractions. Conversely, the series of ratios can be turned into the series of integers by calculating their least common denominator (the smallest whole number that is a multiple of all numbers under the fraction bar) and discarding it.
Logarithmic representation using musical constants (definition given further down):
0,000; 30,772; 60,625; 89,612; 117,783; 145,182; 171,850; 197,826; 223,144; 247,836; 271,934; 295,464; 318,454; 340,927; 362,905; 384,412; 405,465; 426,084; 446,287; 466,090; 485,508; 504,556; 523,248; 541,597; 559,616; 577,315; 594,707; 611,802; 628,609; 645,138; 661,398; 677,399; 693,147

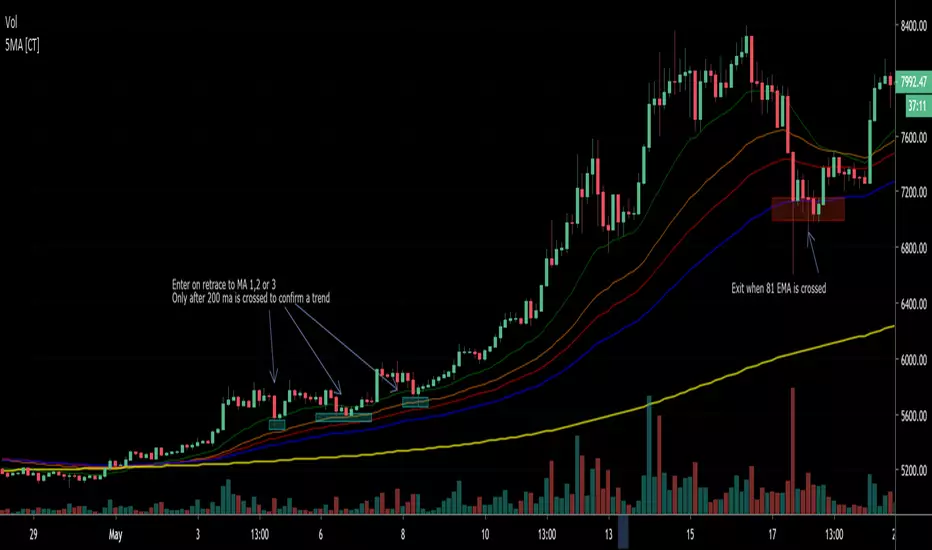
5 Moving Average (Simple / Exponential)Defaults to 1 SMA with 4 EMA bands. 200 SMA is intended to show the trend; 20,40 and 55 EMA show entries; 81 EMA is used as stop/take profit. Defaults are inspired by 'Eric Choe' but you can switch between EMA and SMA as per your own preference. Philakone uses all 5 as EMA 8, 13, 21, 55, 200
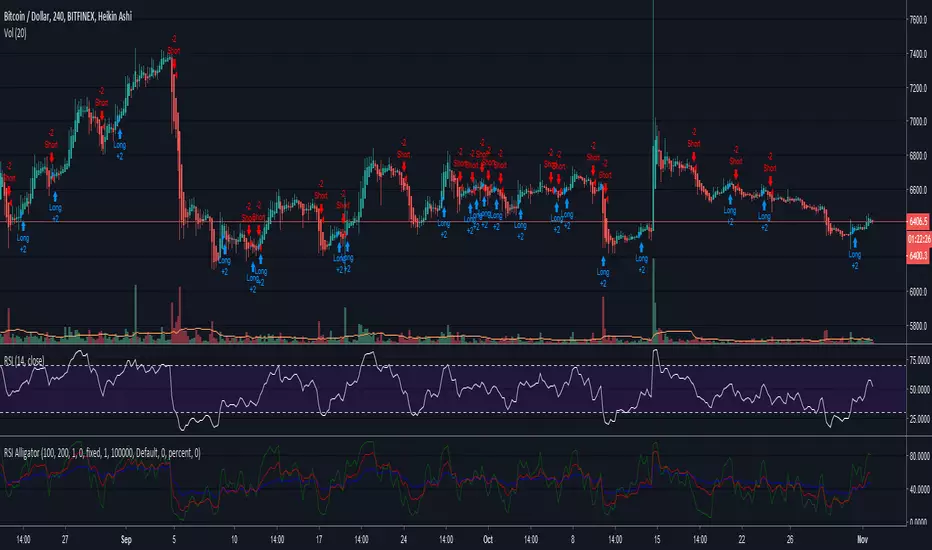
RSI Alligator StrategyHello trading family! Just wanted to give a quick write up and share the new code for the RSI Alligator Strategy. I amended it to show every crossover signal, weak and strong, so we can accurately gauge its effectiveness.
Having played with this for a couple hours now I have learned a few things
-Using Heikin Ashi seems to smooth it out a bit and provides about 20% fewer signals, leading to overall more accuracy. However, it can be misleading as the Heikin Ashi opening price doesn't always line up with the market price, especially in cases of large moves. Overall though it didn't seem too far off except for a few instances.
-Also, using the Heikin Ashi gives you a better idea of the trend, which this indicator is primarily used to detect and exploit.
-Having tested on TF of 1H-1D, overall profitability is found to be highest between 4H-12H, with 1D giving the "safest" longer term signals, and lower TF's generating many more signals due to volatility.
-Instead of waiting for the next signal in order to close, you can often use a crossover/crossunder of the 5 and 13 to close the previous trade, especially if paired with a Heikin Ashi of opposite color (green to close a short, red to close a long)
-You will also notice several instances where the Green 5 period show divergences that aren't visible on the regular RSI, another handy little feature
So far I have still only tested this on BTCUSD. Feel free to apply it to any coin and let me know what you find.
Here is the script. If you have any ideas or suggestions please let me know!