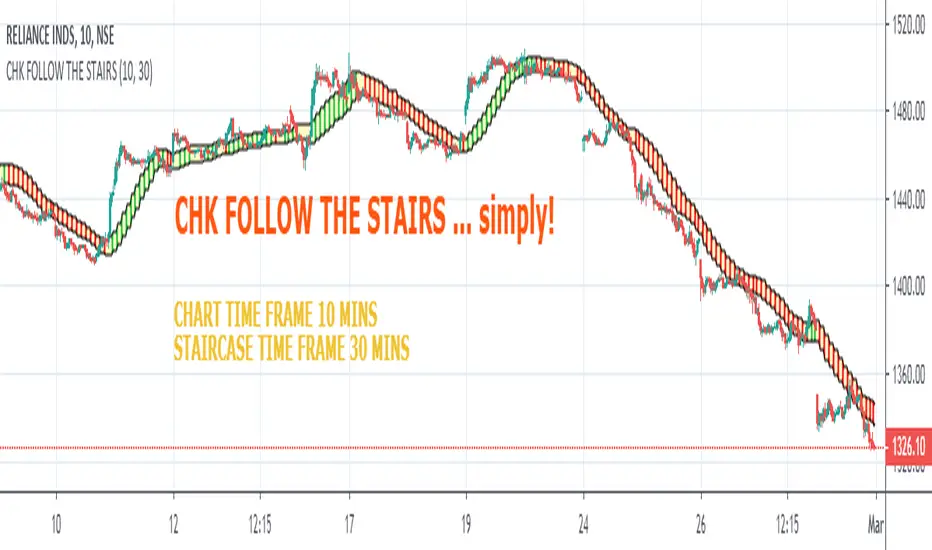
CHK FOLLOW THE STAIRSCHK FOLLOW THE STAIRS....
The stairs are nothing but HIGH LOW CHANNEL at HTF or LTF
I observed 10 Period Moving Average an optimum length for the Staircase
you can change it to 8 or 13, one will generate noise, other will generate lag
Tinker with the Staircase Time Frame to get an optimum fit
The script also shows Strength of the Trend.
If there is a gap between the price and the stairs, that is relection of the strength
The script can also be used for scalping.
Wyszukaj w skryptach "细算江西救护车家长倒赚了四万三+-医疗花费13万(家长视频)++医保报"
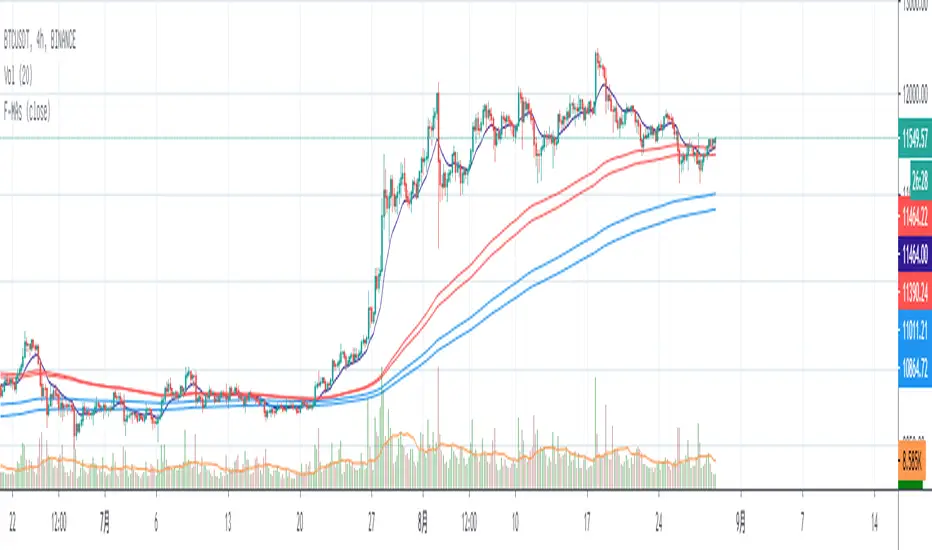
Moving Average ChannelThis script display three moving average channels,
main channel (EMA144, EMA169), second (EMA288, EMA338), third (EMA576, EMA676)
This channels can act as support/resisitance, a trade can be setup when price enter and then leave the channel.
There are also other moving averages base on FIbnacci numbers ( 13,21,34,55,89,144,233....), you can use it if you like.
This channels is base on idea of Vegas Tunnel Strategy developed by Vegas.
Momentum Sentiment Indicator by mattzabThis indicator uses 3 moving averages and includes volume to display sentiment and momentum.
By default, a 5, 8, and 13 SMA is displayed (black lines).
The colored bands are the corresponding volume weighted moving averages.
When the colored band is above the black line, sentiment is bullish.
Think of the color as being a show of volume, and the black lines as support and resistance.
When the lines are trending up, and colors are above the black lines, an uptrend is in progress.
When the colors are mixed above and below, and the lines are intertwined, it is a ranging market.
The lines operate similar to the Williams Alligator.

HatiKO EnvelopesPublished source code is subject to the terms of the GNU Affero General Public License v3.0
This script describes and provides backtesting functionality to internal strategy of algorithmic crypto trading software "HatiKO bot".
Suitable for backtesting any Cryptocurrency Pair on any Exchange/Platform, any Timeframe.
Core Mechanics of this strategy are based on theory of price always returning to Moving Average + Envelopes indicator (Moving_average_envelope from Wiki)
Developement of this script and trading software is inspired by:
"Essential Technical Analysis: Tools and Techniques to Spot Market Trends" by Leigh Stevens (published on 12th of April 2002)
"Moving Average Envelopes" by ChartSchool, StockCharts platform (published on 13th of April 2015 or earlier)
"Коля Колеснік" from Crypto Times channel ("Метод сетка", published on 19th of August 2018)
"3 ways to use Moving Average Envelopes" by Rich Fitton, published on Trader's Nest (published on 28st of November 2018 or earlier)
noro's "Robot WhiteBox ShiftMA" strategy v1 script, published on TradingView platform (published on 29th of August 2018)
"Moving Average Envelopes: A Popular Trading Tool" Investopedia article (published 25th of June 2019)
and KROOL1980's blogpost on Argolabs ("Гридерство или Сетка как источник прибыли на форекс", published on 27th of February 2015)
Core Features:
1) Up to 4 Envelopes in each direction (Long/Short)
2) Use any of 6 different basis MAs, optionally use different MAs for Opening and Closure
3) Use different Timeframes for MA calculation, without any repainting and lookahead bias.
4) Fixed order size, not Martingale strategy
5) Close open position earlier by using Deviation parameter
6) PineScript v4 code
Options description:
Lot - % from your initial balance to use for order size calculation
Timeframe Short - Timeframe to use for Short Opening MA calculation, can be chosen from dropdown list, default is Current Graph Timeframe
MA Type Short - Type of MA to use for Short Opening MA calculation, can be chosen from dropdown list, default is SMA
Data Short - Source of Price for Short Opening MA calculation, can be chosen from dropdown list, default is OHLC4
MA Length Short - Period used for Short Opening MA calculation, should be >=1, default is 3
MA offset Short - Offset for MA value used for Short Envelopes calculation, should be >= 0, default is 0
Timeframe Long - Timeframe to use for Long Opening MA calculation, can be chosen from dropdown list, default is Current Graph Timeframe
MA Type Long - Type of MA to use for Long Opening MA calculation, can be chosen from dropdown list, default is SMA
Data Long - Source of Price for Long Opening MA calculation, can be chosen from dropdown list, default is OHLC4
MA Length Long - Period used for Long Opening MA calculation, should be >=1, default is 3
MA offset Long - Offset for MA value used for Long Envelopes calculation, should be >= 0, default is 0
Mode close MA Short - Enable different MA for Short position Closure, default is "false". If false, Closure MA = Opening MA
Timeframe Short Close - Timeframe to use for Short Position Closure MA calculation, can be chosen from dropdown list, default is Current Graph Timeframe
MA Type Close Short - Type of MA to use for Short Position Closure MA calculation, can be chosen from dropdown list, default is SMA
Data Short Close - Source of Price for Short Closure MA calculation, can be chosen from dropdown list, default is OHLC4
MA Length Short Close - Period used for Short Opening MA calculation, should be >=1, default is 3
Short Deviation - % to move from MA value, used to close position above or beyond MA, can be negative, default is 0
MA offset Short Close - Offset for MA value used for Short Position Closure calculation, should be >= 0, default is 0
Mode close MA Long - Enable different MA for Long position Closure, default is "false". If false, Closure MA = Opening MA
Timeframe Long Close - Timeframe to use for Long Position Closure MA calculation, can be chosen from dropdown list, default is Current Graph Timeframe
MA Type Close Long - Type of MA to use for Long Position Closure MA calculation, can be chosen from dropdown list, default is SMA
Data Long Close - Source of Price for Long Closure MA calculation, can be chosen from dropdown list, default is OHLC4
MA Length Long Close - Period used for Long Opening MA calculation, should be >=1, default is 3
Long Deviation - % to move from MA value, used to close position above or beyond MA, can be negative, default is 0
MA offset Long Close - Offset for MA value used for Long Position Closure calculation, should be >= 0, default is 0
Short Shift 1..4 - % from MA value to put Envelopes at, for Shorts numbers should be positive, the higher is number, the higher should be Shift position, example: "Shift 1 = 1, shift 2 = 2, etc."
Long Shift 1..4 - % from MA value to put Envelopes at, for Longs numbers should be negative, the lower is number, the lower should be Shift position, example: "Shift 1 = -1, shift 2 = -2, etc."
From Year 20XX - Backtesting Starting Year number, only 20xx supported as script is cryptocurrency-oriented.
To Year 20XX - Backtesting Final Year number, only 20xx supported as script is cryptocurrency-oriented.
From Month - Years starting Month, optional tweaking, changing not recommended
To Month - Years ending Month, optional tweaking, changing not recommended
From day - Months starting day, optional tweaking, changing not recommended
To day - Months ending day, optional tweaking, changing not recommended
Graph notes:
Green lines - Long Envelopes.
Red lines - Short Envelopes.
Orange line - MA for closing of Short positions.
Lime line - MA for closing of Long positions.
**************************************************************************************************************************************************************************************************************
Опубликованный исходный код регулируется Условиями Стандартной Общественной Лицензии GNU Affero v3.0
Этот скрипт описывает и предоставляет функции бектеста для внутренней стратегии алгоритмического программного обеспечения "HatiKO bot".
Подходит для тестирования любой криптовалютной пары на любой бирже/платформе, на любом таймфрейме.
Кор-механика этой стратегии основана на теории всегда возвращающейся к значению МА цены с использованием индикатора Envelopes (Moving_average_envelope from Wiki)
Разработка этого скрипта и программного обеспечения для торговли вдохновлена следующими источниками:
Книга "Essential Technical Analysis: Tools and Techniques to Spot Market Trends" Ли Стивенса (опубликовано 12 апреля 2002 года)
«Moving Average Envelopes» от ChartSchool, платформа StockCharts (опубликовано 13 апреля 2015 года или раньше)
«Коля Колеснік» с канала Crypto Times («Метод сетка», опубликовано 19 августа 2018 года)
«3 ways to use Moving Average Envelopes» Рича Фиттона, опубликованные в «Trader's Nest» (опубликовано 28 ноября 2018 года или раньше)
Скрипт стратегии noro "Robot WhiteBox ShiftMA" v1, опубликованный на платформе TradingView(опубликовано 29 августа 2018 года)
«Moving Average Envelopes: A Popular Trading Tool», статья Investopedia (опубликовано 25 июня 2019 года)
Блог KROOL1980 из Argolabs («Гридерство или Сетка как источник прибыли на форекс», опубликовано 27 февраля 2015 года)
Основные особенности:
1) До 4-х Ордеров в каждом из направлении (Лонг / Шорт)
2) Выбор из 6-ти разных базовых МА, опционально используйте разные МА для открытия и закрытия.
3) Используйте разные таймфреймы для расчета MA, без перерисовки и "эффекта стеклянного шара".
4) Фиксированный размер ордера, а не стратегия Мартингейла
5) Возможность закрытия открытой позиции заблаговременно, используя параметр Deviation
6) Код реализован на PineScript v4
Описание параметров:
Lot - % от вашего первоначального баланса, используется при расчете размера Ордера
Timeframe Short - таймфрейм, используемый для расчета МА Открытия Шорт позиций, может быть выбран из списка, по умолчанию - таймфрейм текущего графика
MA Type Short - тип MA, используемый для расчета МА Открытия Шорт позиций, может быть выбран из списка, по умолчанию SMA
Data Short - источник цены для расчета МА Открытия Шорт позиций, может быть выбран из списка, по умолчанию OHLC4
MA Length Short - период, используемый для расчета МА Открытия Шорт позиций, должен быть >= 1, по умолчанию 3
MA Offset Short - смещение значения MA, используемого для расчета Шорт Ордеров, должно быть >= 0, по умолчанию 0
Timeframe Long - таймфрейм, используемый для расчета МА Открытия Лонг позиций, может быть выбран из списка, по умолчанию - таймфрейм текущего графика
MA Type Long - тип MA, используемый для расчета МА Открытия Лонг позиций, может быть выбран из списка, по умолчанию SMA
Data Long - источник цены для расчета МА Открытия Лонг позиций, может быть выбран из списка, по умолчанию OHLC4
MA Length Long - период, используемый для расчета МА Открытия Лонг позиций, должен быть >= 1, по умолчанию 3
MA Offset Long - смещение значения MA, используемого для расчета Лонг Ордеров, должно быть >= 0, по умолчанию 0
Mode close MA Short - Включает отдельное MA для закрытия Шорт позиции, по умолчанию «false». Если false, MA Закрытия = MA Открытия
Timeframe Short Close - таймфрейм, используемый для расчета МА Закрытия Шорт позиций, может быть выбран из списка, по умолчанию - таймфрейм текущего графика
MA Type Close Short - тип MA, используемый при расчете МА Закрытия Шорт позиции. Mожно выбрать из списка, по умолчанию SMA
Data Short Close - источник цены для расчета МА Закрытия Шорт позиций, может быть выбран из списка, по умолчанию OHLC4
MA Length Short Close - период, используемый для расчета МА Закрытия Шорт позиции, должен быть >= 1, по умолчанию 3
Short Deviation - % отклонения от значения MA, используется для закрытия позиции выше или ниже рассчитанного значения MA, может быть отрицательным, по умолчанию 0
MA Offset Short Close - смещение значения MA, используемого для расчета закрытия Шорт позиции, должно быть >= 0, по умолчанию 0
Mode close MA Long - Включает разные MA для закрытия Лонг позиции, по умолчанию «false». Если false, MA Закрытия = MA Открытия
Timeframe Long Close - таймфрейм, используемый для расчета МА Закрытия Лонг позиций, может быть выбран из списка, по умолчанию - таймфрейм текущего графика
MA Type Close Long - тип MA, используемый при расчете МА Закрытия Лонг позиции. Mожно выбрать из списка, по умолчанию SMA
Data Long Close - источник цены для расчета МА Закрытия Лонг позиций, может быть выбран из списка, по умолчанию OHLC4
MA Length Long Close - период, используемый для расчета МА Закрытия Лонг позиции, должен быть >= 1, по умолчанию 3
Long Deviation -% для перехода от значения MA, используется для закрытия позиции выше или ниже рассчитанного значения MA, может быть отрицательным, по умолчанию 0
MA Offset Long Close - смещение значения MA, используемого для расчета закрытия Лонг позиции, должно быть >= 0, по умолчанию 0
Short Shift 1..4 - % от значения MA для размещения Ордеров, для Шорт Ордеров должен быть положительным, чем выше номер, тем выше должна располагаться позиция Shift, например: «Shift 1 = 1, Shift 2 = 2 и т.д. "
Long Shift 1..4 - % от значения MA для размещения Ордеров, для Лонг Ордеров должно быть отрицательным, чем ниже число, тем ниже должна располагаться позиция Shift, например: «Shift 1 = -1, Shift 2 = -2, и т.д."
From Year 20XX - Год начала тестирования, из-за ориентированности на криптовалюты поддерживаются только значения формата 20хх.
To Year 20XX - Год окончания тестирования, из-за ориентированности на криптовалюты поддерживаются только значения формата 20хх.
From Month - Начальный месяц, опционально, менять не рекомендуется
To Month - Конечный месяц, опционально, менять не рекомендуется
From day - Начальный день месяца, опционально, менять не рекомендуется
To day - Конечный день месяца, опционально, менять не рекомендуется
Пояснения к графику:
Зеленые линии - Лонг Ордера.
Красные линии - Шорт Ордера.
Оранжевая линия - MA Закрытия Шорт позиций.
Лаймовая линия - MA Закрытия Лонг позиций.

Balanced/Unbalanced MarketWhen market chooses to go uptrend or downtrend, the equilibrium between buyers and sellers vanishes and the trend with the different qualifications forms. The number of balanced and unbalanced periods of a trend can relate to it's weakness/strength.
Using indicators like ichimoku can initially help us to simply understand these concept.
So simply:
1- When Kj (Kijunsen=Ichimoku baseline) become flat, it shows the equilibrium between buyers and sellers. In line 13 of the script code, we can see the condition for this. In this case, better to use Kj=52 as it's closer to the concept of equilibrium market and contains more flat periods.
Also we can use Kj ==Kj and Kj ==Kj instead, to filter the balanced bars more.
2- When Kj stand higher or lower than it's previous value, it can be used as determiner for bullishness and bearishness of the market. In lines 16,19 of the script code, we can see the conditions for this. In this case, better to use Kj=26 as it's closer to the concept of trend market.

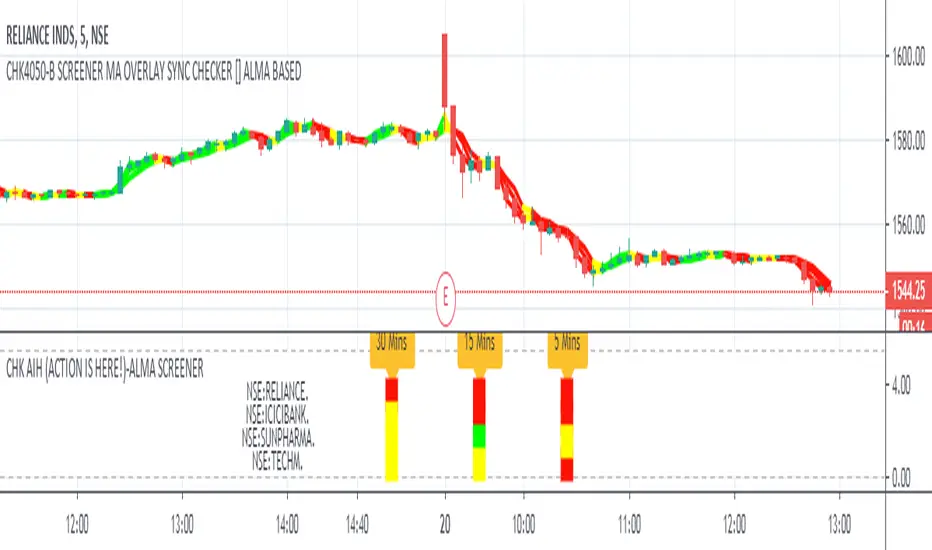
CHK AIH (ACTION IS HERE!)-ALMA SCREENERWe do not like to stare at the screen whole day, instead we like to jump where the
action is.... The Screener was written with this in mind
CHK AIH (ACTION IS HERE!)-ALMA BASED SCREENER
FEATURES
User can enter 3 Resolutions of his/her choice
User can select 3 Mov Avg Length of his her choice, which would be identical for all the three timeframes
User can enter stock basis his/her region's stock exchange
User can shift the screener left or right if not visible in a Multiscreen mode
Uses ALMA (Arnaud Legoux Mov Avg) as it smooth and reactive
Code is also provided below of MTF ALMA Moving Average OVERLAY on which this screener is based
LOGIC
For a particular timeframe If all the Moving Average are calibrated in one direction, it will show the requisite color.
For Example in an ideal scenario for a bull trend ALMA(5)> ALMA(13) > ALMA(21), once such a situation is identified, the screener will show green.
Yellow means lack of Calibration.
When 3 timeframes are calibrated, it becomes a high Probability Trade
BUGS
It is not allowing to enter the D/W/M timeframes, timeframe in numbers ...5/15/60 is working fine. If somebody can fix it
it would be great
LIMITATIONS
Because of TV's limitations only 4 scrips can be entered, however one add the indicator again with new scrips
//////////// CREDITS ////////////////////////////////////////////////////////////////////////////////////
//// hxxps://www.tradingview.com/script/rwdgyEZe/
/// Thank You Inno14 for graciously sharing your work. Your work has helped immensely !!!
////////////////////////////////////////////////////////////////////////////////////////////////////////
ICICIBANK
TECHMAHINDRA
YESBANK
Ichimoku Kinkō hyō Keizen 改MTF善The script is not finnished yet and show's an other interpretation of how it could be scripted
Step -1 is complete... Basic Ichimoku with asjutable length and editable lines colors and visibilities.
Step -2 in progress... Adding ability to une multiple Spans, sens and Kumo on higher and lower timeframe.
Your Step : Like and Share ;) have a good year 2020 !
2020-01-06 /--------/ -R.V.
Jan 06
Release Notes: The script is not finnished yet and show's an other interpretation of how it could be scripted
Step -1 is complete... Basic Ichimoku with asjutable length and editable lines colors and visibilities.
Step -2 in progress... Adding ability to une multiple Spans, sens and Kumo on higher and lower timeframe.
Your Step : Like and Share ;) have a good year 2020 !
2020-01-06 /--------/ -R.V.
Jan 07
Jan 13
Release Notes: MTF Ichimoku is on it's way !!
Jan 17
Release Notes: The script is not finnished yet and show's an interpretation of how it could be scripted
Step -1 is complete... Basic Ichimoku with asjutable length and editable lines colors and visibilities.
Step -2 in complete... Adding ability to use multiple Spans, sens and Kumo on higher timeframe.
Step -3 in progress... Creating a UNIX based function to framgments actual chart periods in subcandles or "Subprices/periods" to plot multiple Spans, sens and Kumo on LOWER timeframe.
Your Step : Like and Share ;) have a good year 2020 !
/--------Coder--------/ -R.V.


(JS) Ultimate RSISo my goal here was to combine all of my RSI ideas into a single indicator in order to make kind of a "Swiss Army Knife" version of the Relative Strength Index ...
------------------------------------------------------------------------------------------------------------------------------------------------------------------------------------------------------------------------------------------------------------------
So, let's begin with the first RSI indicator I made, which is the RSIDVW (Divergence/Volume Weighted);
To rephrase my original post, the "divergence/volume weighted" portion is meant to expand upon the current RSI format by adding more variables into the equation.
The standard RSI is based off one value that you select (open, close, OHLC4, HLC3, etc.) while this version takes three variables into account.
The default setting is to have RSI normal without anything added to it (Divergence Weight = 0)
1st - it takes the standard variable that RSI normally uses.
2nd - it factors RSI divergence by taking the RSI change % and price change % to form a ratio. Using this ratio, I duplicated the RSI formula and created a divergence RS to be factored in with the standard price RS .
3rd - it takes Relative Volume and amplifies/weakens the move based upon volume confirmation. (So if Relative Volume for a price bar is 1.0, the RSI plot would be the same as it normally would)
So to explain the parameters
- Relative Volume Length: This uses the RV length you specify to determine spikes in volume (or lack of volume ), which then is added into the formula to influence the strength of the RSI move
- RV x Divergence: This is how I calculated the original formula, but you can leave this unchecked to turn Relative Volume off, or apply elsewhere.
- RV x RS: There's two sides, Divergence RS and Standard RS - these check marks allow you to select which part you prefer to be multiplied by Relative Volume .
Checking neither turns off Relative Volume , while checking both amplifies its effects by placing it on both sides of the equation.
-Divergence Weight: This controls how much the DVW portion of the formula influences the RSI plot. As I referred to earlier, default is 0 making RSI normal. The Scale is 0-2, so 1.0 would be the same as 50%.
When I do have DVW on, I generally set it to 0.5
-SMA Divergence: To smooth, or not to smooth, that is the question. UJsing an SMA here is much smoother in my opinon, but leaving it unchecked runs it through an RMA the same way standard RSI is calculated.
-Show Fractal Channel: This allows you to see the whole fractal channel around the RSI (This portion of the code, compliments of the original Ricardo Santos fractal script)
------------------------------------------------------------------------------------------------------------------------------------------------------------------------------------------------------------------------------------------------------------------
The next portion of the script is adding a "Slow RSI"...
This is rather simple really, it allows you to add a second RSI plot so that you can watch for crossovers between fast and slow lines.
-Slow RSI: This turns on the second RSI Plot.
-Slow RSI Length: This determines the length of the second RSI Plot.
------------------------------------------------------------------------------------------------------------------------------------------------------------------------------------------------------------------------------------------------------------------
Pivot Point RSI was something a friend of mine requested I make which turned out pretty cool, I thought... It is also available in this indicator.
-Pivot Points: Selecting this enables the rest of the pivot point related parts of the script
If Pivot Points isn't selected, none of the following things will work
-Plot Pivot: Plots the pivot point .
-Plot S1/R1: Plots S1/R1.
-Plot S2/R2: Plots S2/R2.
-Plot S3/R3: Plots S3/R3.
-Plot S4/R4: Plots S4/R4.
-Plot S5/R5: Plots S5/R5.
-Plot Halfway Points: Plots a line between each pivot .
-Show Pivot Labels: Shows the proper label for each pivot .
When using intraday charts, from a 15 minute interval or less the pivots are calculated based on a single days worth of price action, above that the distance expands.
Here are the current resolutions Pivot Points will work with:
Minutes - 1 , 2, 3, 5, 10, 13, 15, 20, 30, 39, 78, 130, 195
Hours - 1, 2, 3, 4, 5, 6
Daily
Weekly
Currently not available on seconds or monthly
------------------------------------------------------------------------------------------------------------------------------------------------------------------------------------------------------------------------------------------------------------------
Background Colors
Background Colors: I have six color schemes I created for this which can be toggled here (they can be edited).
Gray Background for Dark Mode: Having this on looks much better when using dark mode on your charts.
------------------------------------------------------------------------------------------------------------------------------------------------------------------------------------------------------------------------------------------------------------------
Now finally the last portion, Fibonacci Levels
-Fibonacci Levels: This is off, by default, which then uses the standard levels on RSI (30-50-70). When turned on, it removes these and marks fib levels from 0.146 through 0.886.
------------------------------------------------------------------------------------------------------------------------------------------------------------------------------------------------------------------------------------------------------------------
So the quick rundown:
Ultimate RSI contains "divergence/volume weighted" modifications, a slow RSI plot, pivot points , and Fibonacci levels all while auto-plotting divergence and having the trend illustrated in the background colors.
RSI has always been my "go to" indicator, so I hope you all enjoy this as much as I do!

Trend-Following Combo-SuperTrend, EMA, Aroon, DMI, Laguerre RSIThis is a trend-following indicator which condenses two SuperTrend indicators -- one based on analysis over a shorter period of time (1.5, 7), and one based on analysis over a longer period of time (1.65, 100) -- into a single indicator which appears on your chart only when both the shorter- and longer-term analysis indicates a "SuperTrend" in the same direction.
Additionally, potential trade entry indicators are displayed in the form of up and down arrows when (by default) three of the following five indicators suggest that the market is trending in the same direction as both the shorter- and longer-term SuperTrend indicators:
EMA Crossover (8, 15)
Aroon Indicator (8)
Aroon Oscillator (8)
Directional Movement Index (DI +/-) (8)
Laguerre RSI (13)
You may update the parameters of any of the indicators to match your own preferences.
Additionally, you may also adjust the "Threshold" of indicators that must be in agreement with the SuperTrend to show a potential trade entry arrow. Bear in mind that if you set the Indicator Threshold too low, you will see more frequent trade entry arrows, many of which will not be profitable if taken. Similarly, set this value too high, and you will see fewer trade entry arrows that may not appear until after most of the "juice" in the trend has evaporated. Ideal values for the threshold seem to be between 2-4, depending on the symbol you are trading.
The following image shows all of the indicators referenced above on a 5-minute chart of the SPY during a single trading day:
And, here is the same period of time showing only the Trend-Following Combo indicator with default settings:
This indicator would not have been possible save for work contributed by the following:
SuperTrend by Rajandran R
Aroon w/ crossovers highlighted by seiglerj
Aroon Oscillator by jcrewolinsky
Directional Movement Index by TradingView
Laguerre RSI (Self Adjusting Alpha with Fractals Energy) by everget

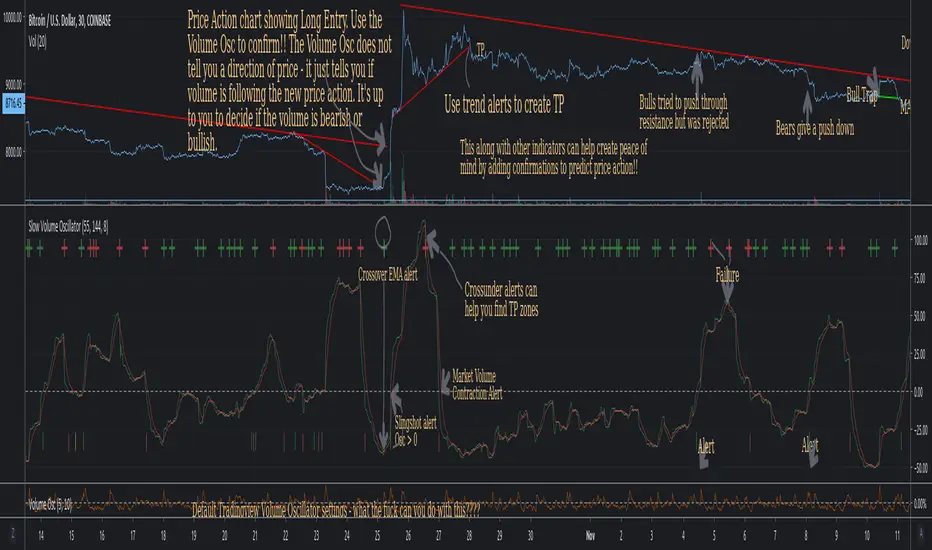
Slow Volume Oscillator Indicator - Just a Better Way To TradeThis script is nothing new. However, I feel that traders do not know the full potential it can provide if they just increase the lookback periods.
Tradingview's default Vol Osc uses a fast setting of 5 and a slow setting of 10. It just paints pointless scribbling. Slow all your indicators down and wake up to a whole new world of Technical Analysis.
To create consistency with variables I typically use Fib numbers for lookback periods. (3,5,8,13,21,34,55,89,144,233,377,610,987)
As noted in chart. An increase in volume can be either bullish or bearish. It's up to you to decide which way price action will move.
If you use with other indicators you can create more confirmations.
More confirmations = peace of mind
My favorite indicators are (Detrended Price Oscillator, Momentum, MACD, Chaikin Money Flow, Ultimate Oscillator, and this Volume Oscillator)
Here is just one example of MACD strategy indicator that can be used with this Vol Oscillator
Aroon Oscillator strategy by SauciusThis strategy suits better for stock, indexes and commodities sufficiently volatile but with not so strong trend, where perspective of future quotations are not so certain.
For these financial instruments this system works better than others based on classical trend oscillator (like Supertrend)
This strategy starts from the idea of the creator of Aroon lines, Tushar Chande, whose suggested to an unique Aroon Oscillator (defined as Aroon Up - Aroon Down), instead of 2 lines (for reference, original article avaible in:" Stocks & Commodities , V. 13:9 : A Time Price Oscillator by Tushar Chande, Ph .D."" - paragraph: "more patterns").
Use middle line for taking position, and the extreme ones (high and low) for exiting from long/short position. Extreme lines are not use for opening position against the trend.
Best values are for EU stocks and indexes: 19 periods, middle line = - 25 (ecxpecially for shares, give the general tendency of growing). Therefore also levels for exiting long/short position are not specular (levelhigh stops at + 75, low at -85 since stocks when go down, fall often heavily)
Please give feedback for improving this strategy! All the best,
MS .

FibMAThis study visually demonstrates Fibonacci moving averages.
The darker the color, the stronger the signal is for either buying or selling.
Buys/Sells only take place when each moving average is above/below the its adjactent fibonacci sequence, i.e 5<8<13<21<34<55<89<144 for buying..
Alerts are provided as BUY ASSET and SELL ASSET.
Multiple moving averages are also provided.

Range Force Impulse The "Range Force Impulse" indicator combines 4 useful indicators into one, freeing up chart real-estate and giving the trader insight into trend health, bull/bear commitment, range and volatility all at a glance.
The indicator consists of the following:
Direction - True Range and Average True Range columns shown above and below 0 depending on direction of the period's price
-- TR (gray) shows the current period's trading volatility
-- ATR (Impulse colors, see below) shows an EMA of TR over a specified length
-- Can be used to determine stops and targets (Example: Stop loss at prev close - ATR, Target at 2x ATR)
Index - Alexander Elder's EMA of (change(close) * volume), shows crosses above 0 (green) and below 0 (red), and intermediate signals
-- Shows bull vs. bear interest/commitment/dominance
-- Elder recommends EMA length of 2 for daily chart buy/sell signals, and 13 for weekly chart bull/bear dominance & trend direction signals
-- Intermediate signals are shown above 0 when falling (salmon), or below 0 when rising (pale yellow)
System - Range columns are colored using Alexander Elder's censorship system (green: do not short, red: do not long, blue: is up to you)
-- Shows overall trend health (Macd histogram and EMA up/down changes)

Binary Options Arrows (example)An example of Binary Option Arrows (BOA) for candlestick patterns bearish and bullish harami.
With results as coloured background and an option to choose your expiration (one candle by default).
It's just an example for those who has their own strategy and wants to make nice arrows in their chart.
All you need to do is rewrite piece of script in lines 9:13 - feel free to ask me for any help.
Disclaimer: It's just an example how to script arrows for binary option trading, Poshtrader is not responsible for any loss of money by using this particular strategy.
Happy Trading

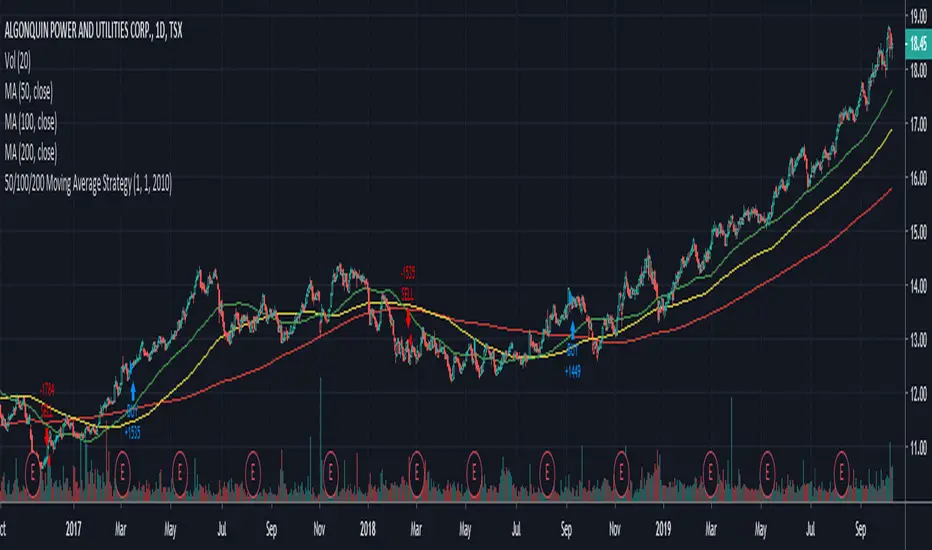
Easy to Use 50/100/200 Day Moving Average StrategyWhenever you see someone publish a chart or idea, what's the one thing you almost always see? Moving Averages!
Many investors focus on these indictors solely as entry and exit points, so here's an easy to manipulate strategy to backtest and see if this is feasible on your security.
CODE VARIABLES
LINE 2 - Here you can change your currency and amount you want to invest on each entry.
LINE 8/9/10 - Here we establish the 50 (Fast), 100 (Medium) and 200 (Slow) day variables. These can be adjusted to your choosing.
LINE 13/14/15 - Here we establish what date we want to start backtesting from. Simple change the defval on each line to change the date (In the code below we start on Jan 1st, 2010).
LINE 20/23 - Here, within the crossover and crossunder functions, we set which MA's must cross to enter and exit a trade. Below we have the 50 day moving above and under the 200 day. Simple change the variables to FastMA, MediumMA and SlowMA to your choosing.
NOTE: As a beginner you may not want to short stock, therefore LINE 5 was added to only allow long positions.
Hope this helps, from one beginner to another.
Cheers!
[MyCryptoradar] Three Moving Average Strategy + S/R levels + BBMade this script for a friend. There are three moving average strategy and automatic S/R level reconizing and BB.
EMA 8, 21 & 55 Strategy
EMA 5, 8 & 13 Strategy
EMA 12 & 26 Strategy
Credits to @parsa1368 for BB script i used.


Weiss Wave Open Interest BarsFirstly :
LazyBear ' s "Weiss Wave " codes are used for open interests.
Original Weiss Wave Volume :
Let's start :
Open Interest vs. Volume: An Overview
Volume and open interest are two key measurements that describe the liquidity and activity of contracts In the options and futures markets. However, their meanings and applications are different. Volume refers to the number of contracts traded in a given period, while open interest denotes the number of active contracts.
Volume
Trading volume measures the number of options or futures contracts being exchanged between buyers and sellers, identifying the level of activity for that particular contract. For every buyer, there is a seller, and the transaction itself counts toward the daily volume.
Open Interest
Open interest indicates the number of options or futures contracts that are held by traders and investors in active positions. These positions have not been closed out, expired, or exercised. Open interest decreases when holders and writers of options (or buyers and sellers of futures) close out their positions. To close out positions, they must take offsetting positions or exercise their options. Open interest increases once again when investors and traders open new long positions or writers/sellers take on new short positions. Open interest also increases when new options or futures contracts are created.
Options or futures contract trading volume can only increase while open interest can either increase or decrease. While trading volume indicates the number of contracts that have been bought or sold, open interest identifies the number of contracts that are currently held.
Reference : www.investopedia.com
*** Worked to define all futures . You can look them in codes (between line : 13 to line 94 )
** CAUTION 1 : Since each instrument in the list has its own unique contract data, you must first enter its name to display it. I recommend you to select OANDA from the markets. Finally, when the COT reports are issued, it may repaints. However, this repaint is usually close to closing or after close .(When COT reports are so sharp ) So use this script only 1W ( 1 week ) or 1 M ( 1 month ) timeframe.
** CAUTION 2 : This data is taken to Tradingview with the help of Quandl. This is a tremendous possibility, but the system will not work if there is a malfunction.
Best regards.

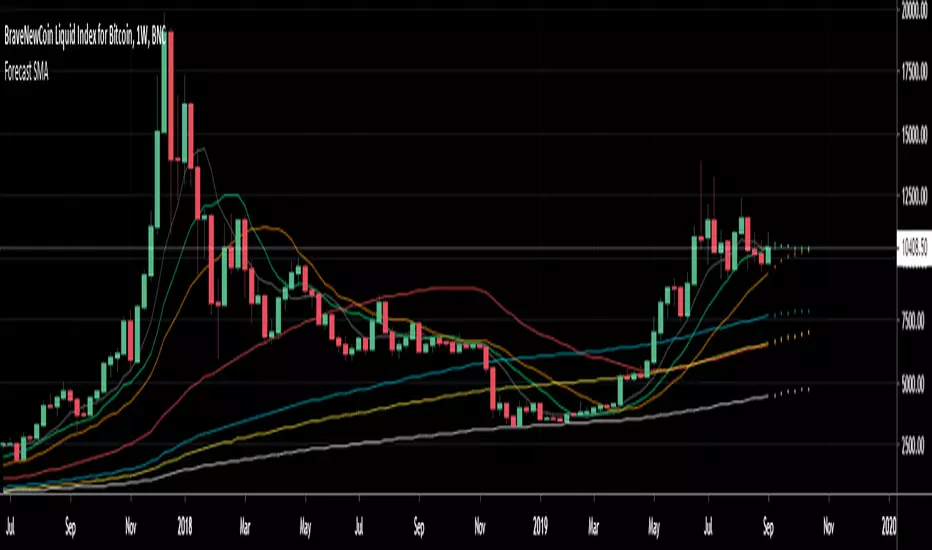
Forecast 7 SMA's 6 periodsForecast 7 SMA's 6 periods
This script is an upgrade of the existing Triple MA Forecast from Yatrader2
To allow the user to display 7 different SMAs and look 6 candles ahead
Default Value
8 SMA
13 SMA
20 SMA
50 SMA
100 SMA
128 SMA
200 SMA
Note:
Best to use on high timeframe, if on low timeframe change the forecast maximum to lower
This was made to forecast the 20 SMA on weekly timeframe on the upcomming Bitcoin price
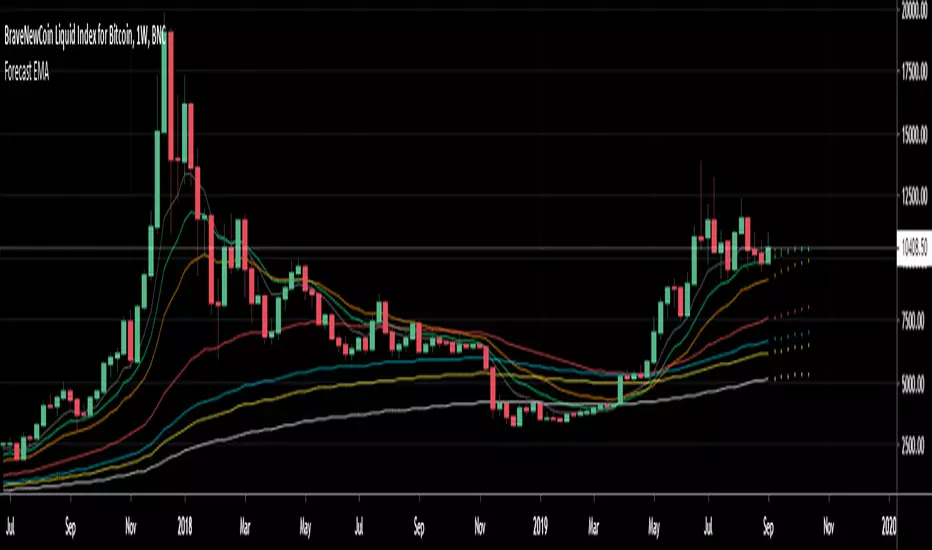
Forecast 7 EMA's 6 periodsForecast 7 EMA's 6 periods
This script is an upgrade of the existing Triple MA Forecast from Yatrader2
To allow the user to display 7 different EMAs and look 6 candles ahead
Default Value
8 ema
13 ema
21 ema
55 ema
100 ema
128 ema
200 ema
Note:
Best to use on high timeframe, if on low timeframe change the forecast maximum to lower
This was made to forecast the 21 ema on weekly timeframe on the upcomming Bitcoin price
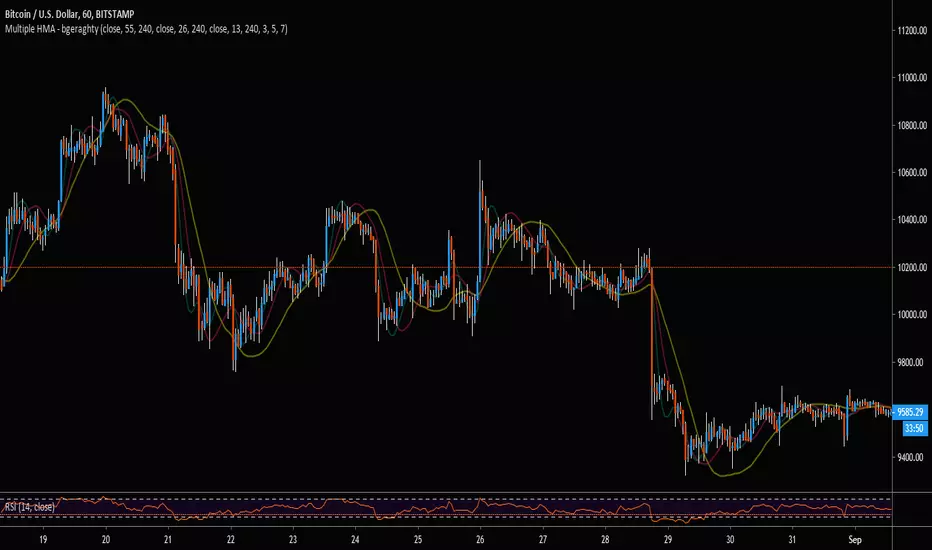
Multiple HMA - bgeraghtyTo save space on a chart's maximum indicator count, this single indicator includes:
- Three Hull Moving Averages, Defaulted to 13, 26, and 55 Periods.
- Customizable Time-Frame for Each HMA.
- Customizable Triple Weighted MA Smoothing for Jagged Lines from Higher Time-Frame
- Alert Conditions for Price Cross Over/Under the HMAs.